


Many older adults in Canada enjoy active lives, which they attribute, in part, to being able to access a passenger vehicle (Turcotte, Reference Turcotte2012). The automobile remains the most viable means of community mobility, particularly for seniors living in rural and suburban areas, who rely on their vehicle to maintain their independent lifestyle. In the next decade, older consumers are set to become the single largest segment of potential buyers of automobiles. Understanding how age and health-related changes can affect driver-vehicle–roadway interactions is important given the high crash rates of this growing segment of the driving population and their corresponding injury and fatality risk when in a collision.
The incidence of vehicle collisions increases for those over the age of 70, with these collisions most often occurring at intersections, particularly left turns, and when merging (Stutts, Martell, & Staplin, Reference Stutts, Martell and Staplin2009). West et al. (Reference West, Hahn, Baldwin, Duncan, Munoz and Turano2010) indicated that intersections pose a higher collision risk for older drivers due to age-related decreases in useful field of view (UFOV). Changes in UFOV and its relationship to crash risk in older adulthood have been discussed at length in the literature (see Friedman, McGwin, Ball, & Owsley, Reference Friedman, McGwin, Ball and Owsley2013). In addition to age-related changes in visual-attentional processing (i.e., UFOV), an association between age and a decrease in head rotation, or rotational neck range of motion (ROM) has also been reported (Youdas et al., Reference Youdas, Garrett, Suman, Bogard, Hallman and Carey1992). Decreased neck ROM may affect the ability of older drivers to visually process information in their external environment. These changes in driver functional and visual abilities can have implications on the behind-the-wheel performance of older drivers (Butler-Jones, Reference Butler-Jones2010).
Line-of-sight Footnote 1 to the external environment, which is sometimes referred to as driver visibility, has been identified as a key area in which older drivers experience problems that can affect their operation of a motor vehicle (Charlton, Fildes, & Andrea, Reference Charlton, Fildes and Andrea2002; Eby & Molnar, Reference Eby and Molnar2012; Zhan, Porter, Polgar, & Vrkljan, Reference Zhan, Porter, Polgar and Vrkljan2013). A survey of older drivers indicated that most respondents (74%) attributed problems with line-of-sight to limitations in their neck mobility (Herriotts, Reference Herriotts2005).
In a focus group study that explored the factors that influence vehicle purchase patterns, participants indicated that modern designs impacted their ability to see outside of their vehicle. As one of their participants described it, “I find a lot of the manufacturers are shortening the windows. They look beautiful on the road, but to see outside the car though, that’s a problem” [male, age 72] (Zhan et al., Reference Zhan, Porter, Polgar and Vrkljan2013, p. 284). When an older driver fails to see information within the driving environment, particularly during situations that require performance of key maneuvers, such as checking the blind spot, the result could have devastating consequences. In fact, Anstey and Wood (Reference Anstey and Wood2011) found that failure to check a blind spot was the most commonly identified critical error among a healthy (i.e., showed no signs of dementia) cohort of older drivers in Australia who underwent a behind-the-wheel evaluation. Although some may argue that the advancement of in-vehicle technologies, including blind spot monitoring systems, might compensate for a decline in physical abilities, not all cars have this technology. Moreover, there is the possibility that this technology might fail, and, as such, it remains crucial for researchers, automotive engineers, healthcare professionals, and drivers to understand the relationship between the functional abilities of older drivers with different anthropometrics in terms of the driving environment, including the vehicle.
In this context, digital human models (DHMs) based on actual user data could prove helpful to understand the older driver–vehicle interaction. DHMs can be used to study the ergonomics of a product, such as a car, in relation to user needs (Sabbah, Zaindl, & Bubb, Reference Sabbah, Zaindl and Bubb2009). However, it is imperative that the DHMs in question are representative of actual users in order for the simulation outcomes to be meaningful (Kajaks, Stephens, & Potvin, Reference Kajaks, Stephens and Potvin2011). Researchers in the mining industry have successfully employed DHMs to study line-of-sight in load haul truck operators when working underground (e.g., Godwin, Eger, Corrigan, & Grenier, Reference Godwin, Eger, Corrigan and Grenier2010). Interest in this particular field of research was prompted by a rise in serious collisions over the past three decades that resulted in high rates of injury and fatality in the mining industry (Tyson, Reference Tyson1997). Using computer-aided design (CAD), researchers have successfully simulated operator line-of-sight using Jack software (Siemens PLM Solutions, TX, USA) to do the following: (1) identify areas of poor operator line-of-sight surrounding the vehicle (Godwin & Eger, Reference Godwin and Eger2009); (2) suggest vehicle design of mining trucks to improve line-of-sight (Godwin, Eger, Salmoni, & Dunn, Reference Godwin, Eger, Salmoni and Dunn2008), and (3) study driver posture and ergonomics (Eger et al., Reference Eger, Godwin, Henry, Grenier, Callaghan and Demerchant2010).
Hence, the purpose of the current proof-of-concept pilot study was to determine if the same methodology could be applied to simulate driver line-of-sight for left and right blind spots using a computer-generated avatar based on neck ROM values gathered from a sample of older drivers. We hypothesized that differences in the sample with respect to gender, anthropometrics, and rotational neck ROM (i.e., head rotation) would influence line-of-sight specific to blind spot detection. Our primary aim was to validate the use of virtual computer software to predict differences in per cent line-of-sight using avatars of older drivers.
Methods
Participants
Demographic, anthropometric, and physical function data were obtained for the Hamilton cohort of older drivers (n = 100) enrolled in one of seven sites of the longitudinal Candrive II study (see Marshall et al., Reference Marshall, Man-Son-Hing, Bédard, Charlton, Gagnon and Gélinas2013). To participate in the study, participants had to be aged 70 and older, and drive a minimum of four times a week for at least one year with a valid license. Participants were screened to ensure that they did not have any contraindications of driving as per the Canadian Medical Association (CMA) Driver’s Guide. As a representative older driver sample of convenience, data from the third year of the Hamilton, Ontario, Candrive cohort were selected. This cohort consisted of 64 males (mean age: 77.5 years ± 4.0 = 5) and 36 females (mean age: 78.7 ± 4.0), with one female not completing all components of the functional assessment, including the neck ROM test.
Procedure
Each of the Candrive sites obtained ethical approval from their human ethics review board prior to conducting the study. All participants provided written informed consent. As part of the study, participants underwent an annual comprehensive evaluation of their health, including physical, cognitive, and sensory testing. Neck ROM was measured as part of this evaluation following the protocol and classification system described by Youdas et al. (Reference Youdas, Garrett, Suman, Bogard, Hallman and Carey1992). To measure neck ROM, participants sat in a chair in an upright sitting posture with their thoracic spine in contact with the backrest, feet flat on the floor, and arms resting to the side of the chair while they looked straight in front of them. Calculations of their neutral posture were measured by placing a goniometer centered over their head at the intersection of a line through the bridge of the nose in the sagittal plane and through the ears in the frontal plane. Participants were then asked to rotate their head three times to each side while their head rotation was measured by tracking the angular movement of the bridge of their nose. Youdas et al. (Reference Youdas, Garrett, Suman, Bogard, Hallman and Carey1992) described all rotational neck ROM scores above 65 degrees as “normal” regardless of age. A neck ROM score below 65 degrees is considered “abnormal” for participants aged 70 and younger; a score below 50 degrees is considered “abnormal” for participants between the ages of 80 and 90. Participants were classified as having “normal” or “abnormal” neck ROM based on these classifications for their age group.
The anthropometric and neck ROM data for all 100 participants were used to derive eight older driver avatars, or virtual participants, (four male and four female) using Siemens Jack software. For the purpose of this proof-of-concept pilot study, avatar anthropometrics were selected based on the 25th and 75th percentiles of male and female height from the Hamilton, Ontario, cohort of the Candrive participant database. By our using the Candrive database, we ensured that the avatar anthropometrics were representative of a range of older driver anthropometrics. The older driver avatars were then simulated as having “normal” neck rotation ROM (n = 4) as per Candrive criteria (ROM: 65 degrees) and abnormal neck rotation ROM (n = 4) for an older adult aged 80–89 (ROM: 50 degrees) (Youdas et al., Reference Youdas, Garrett, Suman, Bogard, Hallman and Carey1992).
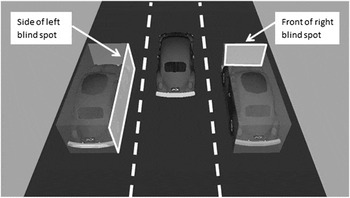
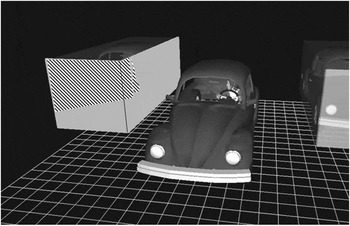
An expert Jack simulation technician with over 6 years of experience using the software was tasked with running the DHM line-of-sight simulations. These simulations were performed by inserting the scaled older driver avatars into the driver seat of a virtual (CAD model) of a Volkswagen Beetle. Field of view of each avatar was assessed using line-of-sight quantification methodology (Jeffkins, Eger, Salmoni, & Whissell, Reference Jeffkins, Eger, Salmoni and Whissell2004), which required the coverage zone module within the occupant packaging toolkit as well as the field-of-view feature (i.e., view cone) within Jack. Driver posture was determined using the software’s pre-set CAD file, which is based on the Society of Automotive Engineer (SAE) guidelines that are integrated in the software as part of the occupant packaging module. The blind spot was positioned 1.14 meters away from the Beetle on both the left and right side of the driver. The front of the blind spot was in line with the backrest of the driver seat, and length, height, and width distances were equal to that of the Beetle (see Figure 1). The distance between vehicles was based on standard lane width of 2.9 m, with each vehicle being centered within their respective lanes.
The vehicle with the older driver being studied (center), with a vehicle in each of the left and right blind spots enclosed within the line-of-sight measurement box. For each vehicle in the left and right blind spots, the “side” and “front” of the surrounding line-of-sight measurement box is used to quantify driver line-of-sight, where each of these locations is highlighted in the above figure using a white box

To test for differences as a function of gender, non-parametric (χ2) analyses were performed on the nominal data while a one-way ANOVA was performed on the height and weight data. Descriptive statistics of the sample are also provided.
Results
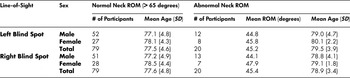
Data from this Candrive site showed that, overall, 21 per cent of its participants had abnormal left and/or right rotational neck ROM. Although there were no differences between left and right neck ROM (see Table 1), 12 participants had unilateral abnormal neck ROM and 14 participants had bilateral abnormal neck ROM. No age or gender differences in neck ROM were found, although there was a trend towards increased age being associated with abnormal neck ROM (Table 1). As expected, males were taller and heavier (174.9 cm ± 6.6; 85.4 kg ± 13.7) than females (161.88 cm ± 5.5; 67.1 kg ± 12.07). The majority of participants at this site were active drivers (i.e., driving an average of 5 days a week; range 4 to 7), with many using their vehicles to be involved in either paid (14 %) or unpaid (67 %) activities.
Number of participants with normal (i.e., any score above 65 degrees) rotational neck range of motion (ROM) and abnormal rotational neck ROM (where rotational neck ROM is determined to be abnormal, the mean ROM score is reported)

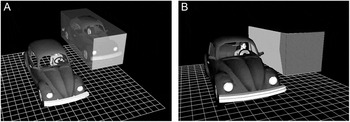
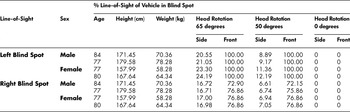
The simulation results indicated average line-of-sight along the upper front side of the left blind spot to be 22.3 per cent and 10.4 per cent in the 65- and 50-degree neck ROM conditions respectively (p < 0.01) (see Figure 2 for an example), with no differences between 25th and 75th percentile male and female avatars (see Table 2). However, the front of the left blind spot was 100 per cent visible in both neck ROM conditions.
Sample images of (a) the location of the blind spot relative to the simulation vehicle and avatar as shown in the line-of-sight measurement box (left), and (b) the measured line-of-sight of the driver avatar (diagonal lines on the front and side of the box) compared to his lack of line-of-sight (solid gray on the side of the line-of-sight measure measurement) (right)

Demographic, anthropometric, and % line-of-sight scores (side and front of blind spot) for the simulation of avatars checking their left and right blind spots

The side of the right blind spot had significantly less overall per cent line-of-sight (p < 0.01) compared to the left blind spot. Line-of-sight to the side of the right blind spot was 16.9 per cent in the 65-degree ROM condition and significantly less (p < 0.01) at 6.84 per cent in the 50-degree neck ROM conditions (Table 2), with the line-of-sight being located towards the upper front of the vehicle due to obstruction from the vehicle (Figure 3). For the right side, the front of the blind spot had significantly less (p < 0.01) per cent line-of-sight, as compared to the left blind spot, with an average of 75.65 per cent line-of-sight across both neck ROM conditions (Table 2). Unlike when looking towards the left blind spot, where 100 per cent line-of-sight was achieved in both neck ROM conditions, the vehicle itself obstructed the view to the right blind spot which resulted in the bottom quarter of the vehicle not being visible (Figure 3). No differences were found between neck ROM conditions within each of the front left or right blind spots. As expected, the left and right blind spot was not visible when the head was not rotated.
Sample image of the measured line-of-sight of the driver avatar (diagonal lines on the front and side of the box) compared to her lack of line-of-sight (solid gray on the side of the line-of-sight measure measurement) for her right blind spot

Discussion
The present study demonstrates a method for simulating older driver blind spot line-of-sight based on actual participant characteristics from older drivers (i.e., neck ROM limitations). Results indicated that participants with greater neck ROM have a higher percentage of line-of-sight of their left and right blind spot, with better line-of-sight from the driver position in the vehicle when rotating their neck to view the left blind spot, as compared to the right blind spot. Conversely, as reflected in the virtual environment, those participants with less neck ROM were more likely to have restrictions in both their left and right blind spots.
These problems could translate to difficulties performing certain behind-the-wheel maneuvers, such as merging and changing lanes. Stutts et al. (Reference Stutts, Martell and Staplin2009) reported that older drivers are more likely to crash when merging. Although the cause of crashes are multi-factorial, blind spot line-of-sight could be one such factor. On the basis of results of our current study, those with restrictions in neck ROM may benefit from compensatory strategies and/or advanced blind spot detection technologies that are available in some vehicles. While such advancements could prove helpful to older drivers during certain maneuvers, there is a possibility that this technology might fail. Accordingly, having the physical ability to check one’s blind spot is crucial. For example, the Canadian Automobile Association (CAA) has released a set of recommendations for older drivers that outline trunk rotation as part of a series of movements that can maintain or even improve driver line-of-sight in older adulthood (Canadian Automotive Association, 2012).
An important and unique feature of this study was the use of simulation technology to study older drivers, which few researchers have demonstrated in the literature with respect to line-of-sight and visibility issues. Using avatars that are based on actual anthropometric and functional data of older drivers, such as the ones developed in this study, will have tremendous value moving forward as we continue to investigate the influence of vehicle ergonomics and human factors issues with respect to driving behaviour.
Older drivers are set to become the single largest market share of potential buyers of automobiles (Eby & Molnar, Reference Eby and Molnar2012). Zhan et al. (Reference Zhan, Porter, Polgar and Vrkljan2013) found that older buyers consider line-of-sight as one of the key features that influence their vehicle purchase. In this respect, a virtual avatar, such as the one we developed in the current study, could be particularly helpful to vehicle designers during the early stages of CAD. Digital human modeling of older drivers can be used to evaluate the impact of line-of-sight with respect to the external driving environment, and can be used to help design engineers build vehicles that consider the needs not only of the general population, but also of the aging population, which is set to become the biggest vehicle user group in the next decade (Turcotte, Reference Turcotte2006). Indeed, many vehicle manufacturers are already using digital human modeling technology within their vehicle design and manufacturing processes (e.g., Kajaks et al., Reference Kajaks, Stephens and Potvin2011).
Although this study used a relatively small sample of older drivers from one of the Candrive sites to investigate the influence of neck ROM on driver line-of-sight, the results demonstrated how simulation technology can be used to measure the potential impact of rotational neck ROM on both left and right blind spot detection. Using our sample, we were able to test and validate this approach in an older driver population. Hence, the aim going forward is to use the data collected across all Candrive sites (n = 928) to develop more advanced avatars for the purpose of evaluating age- and health-related changes, including visual impairments common in older adulthood (e.g., glaucoma, cataracts), with respect to improving vehicle design.
We undertook the current study to demonstrate the extension of line-of-sight virtual applications – commonly used in the mining industry – to research with older drivers; nonetheless, the limitations of the methods we employed must be acknowledged. Blind spot conditions were only tested using one type of vehicle (i.e., Volkswagen beetle). This model is the only full-scale CAD available of a vehicle in the Jack software database, but it provided the necessary information to test our protocol. Future work will validate the use of virtual mock-ups of other types of vehicles (e.g., sub-compact car, mid-size sedan, sports utility vehicle [SUV]) using the methodology described herein.
Additionally, future work will integrate multiple driving postures in the simulations (Park et al., Reference Park, Choi, Lee, Jung, Sah and You2014; Reed, Manary, Flannagan, & Schneider, Reference Reed, Manary, Flannagan and Schneider2002). The present study focused on one seated posture, which is the pre-set posture already integrated into the Jack software, and is based on research from the HUMOSIM group (University of Michigan, MI, USA, www.humosim.org). However, it is possible that other functional limitations, personal preferences, or vehicle characteristics may cause a driver to adopt a different seated posture or use a different technique for checking the blind spots. Environmental factors, both internal and external to the vehicle, may also hinder one’s ability to appropriately check the blind spot, such as nighttime darkness with poorly lit cyclists or vehicle passengers causing line-of-sight obstructions. Our simulation protocol has the ability to accommodate many posture variations, which we intend to explore in future work, potentially concurrently with a driving simulator so that multiple environments and conditions can be investigated with respect to driver line-of-sight.
The research team is excited about the overall potential of simulation technology for older driver research given older drivers’ vulnerability to collision, injury, and fatality. Eby and Molnar (Reference Eby and Molnar2012) noted a gap in the literature with respect to research on vehicle design for older drivers, with visibility being one of the key issues emphasized. The protocol detailed in the current study should enable researchers to identify and quantify line-of-sight issues for older drivers, leading to (1) a better understanding of the relationship between line-of-sight issues, vehicle design, and behind-the-wheel performance; and (2) identification of potential strategies to compensate for age- and health-related changes that influence line-of-sight that can improve the ability of older drivers to visually attend to information in their driving environment to enhance their safety when travelling by automobile.