People engage in collective action all over the world.Footnote 1 They strike for better wages, petition for collective bargaining rights, demonstrate for civil rights protections, rally in the name of white supremacy and engage in acts of civil disobedience for improved environmental policies. There is increasing evidence that protest influences legislative behavior (for example, Cress and Snow Reference Cress and Snow2000; Gamson Reference Gamson1975; Lipsky Reference Lipsky1968; Piven and Cloward Reference Piven and Cloward1977). McAdam and Su (Reference McAdam and Su2002) demonstrate that large and disruptive anti-war protests during the Vietnam War shifted US congressional voting behavior in protesters' favor. Gillion (Reference Gillion2012) finds that salient protest for racial and ethnic minorities' interests leads to responsive roll-call voting by US legislators representing districts in which protest occurs. More recently, Wouters and Walgrave (Reference Wouters and Walgrave2017) find that asylum-issue protests that are large and have a cohesive message are more likely to shape Belgian elected officials' interests, position taking and future actions concerning asylum policies.
Protests are seen as ‘rational attempts by excluded groups to mobilize sufficient political leverage to advance collective interests through noninstitutionalized means’ (McAdam Reference McAdam1982, 37). They are recognized as a strategy of the powerless because of their ability to provide negative inducements for legislators to engage in bargaining (Gamson Reference Gamson1975; Lipsky Reference Lipsky1968; McAdam and Su Reference McAdam and Su2002). But little is known about whether protest advantages the groups with the most to gain from representation.
Scholars continue to find inequalities in political representation that overwhelmingly disadvantage certain groups. Legislators are less likely to represent the preferences of low-income constituents than higher-income constituents (Bartels Reference Bartels2008; Ellis Reference Ellis2012; Gilens Reference Gilens2009; Gilens Reference Gilens2012). They are also less likely to represent the preferences of Black or Latino constituents than White constituents (Butler and Broockman Reference Butler and Broockman2011; Griffin and Newman Reference Griffin and Newman2007).
The political disadvantage of these low-resource groups can be attributed to the lack of economic, racial, ethnic and gender diversity among elected officials (Carnes Reference Carnes2012; Hawkesworth Reference Hawkesworth2003; Tate Reference Tate2004). For instance, political parties and candidates are less likely to appeal to low-resource groups than to White and wealthier constituents (Griffin and Newman Reference Griffin and Newman2008; Rosenstone and Hansen Reference Rosenstone and Hansen1993). Differences in the capacity to participate in politics are also responsible for the political disadvantage of low-resource groups. Political participation increases with income and education and is more likely among White constituents than racial and ethnic minorities (Abrajano and Alvarez Reference Abrajano and Alvarez2010; Leighley and Nagler Reference Leighley and Nagler2014; Verba, Schlozman and Brady Reference Verba, Schlozman and Brady1995). The political marginalization of low-resource groups is therefore compounded: political elites rarely mobilize those with fewer resources, and those with fewer resources face more barriers to participation and representation.
I argue that despite, and perhaps because of, the general disadvantage that racial and ethnic minority, low-income and other low-resource groups face in politics, there are circumstances in which these groups have a political advantage. Following collective action, legislators desiring to represent the salient interests of their constituents are more likely to represent the preferences of low-resource protesters than their higher-resource counterparts. Considering the findings discussed in recent literature, this argument may seem surprising or even counterintuitive. If low-resource groups are less likely than their more resourced counterparts to gain representation via other forms of political participation, then why might legislative behavior following protest be different?
To begin, protest is more likely to communicate issue salience than other forms of participation, like voting, public opinion surveys or lobbying behavior. However, the ability of protest to communicate the salience of issue preferences differs depending on the protesting group. Collective action demands time, energy, information, income and other resources. Groups with low-resource capacity are typically unable and unwilling to incur collective action costs unless they have intense issue preferences (Banks, White and McKenzie Reference Banks, White and McKenzie2018; Klandermans Reference Klandermans1984). In contrast, groups with high-resource capacity can engage in collective action despite their issue salience (Klandermans Reference Klandermans1984). This does not mean that high-resource groups do not face costs or that they do not value policy support; more precisely, their lower participation costs do not require high issue salience for collective action to occur.
To demonstrate the logical implications of this counterintuitive argument, I employ a game-theoretic model. The model formally examines the strategic interaction between groups that can communicate their interests via costly participation and a re-election-minded legislator who wants to represent the salient interests of her constituents. The theory suggests that legislators are more likely to support constituents who protest than those who do not. It also suggests that legislators are more likely to reward protest by low-resource groups and discount protest by high-resource groups because protest is more costly for groups with fewer resources.
I empirically evaluate this theory using legislators’ roll-call votes in the US House of Representatives in the 102nd through the 104th Congresses and data on collective action events on civil rights, minority issues and civil liberties issues reported in the New York Times from 1991 through 1995. This data is supplemented with information from several datasets on legislators and the congressional districts they represent to assess whether any differences in the legislative support of protesters are due to protesters' resource capacity or to other factors known to influence legislative decision making.
The empirical analyses corroborate my theoretical argument. Legislative behavior is more likely to represent constituent preferences communicated via protest than those communicated via other means. Legislative behavior is also more likely to align with racial and ethnic minority, low-income and grassroots protesters' preferences relative to White, more affluent and formally organized protesters' preferences, respectively. As expected, legislative roll-call voting behavior aligns with the preferences of constituents engaging in costlier participation, but only on roll-call votes concerning protesters' interests. Moreover, the argument mostly holds, even when considering other protest characteristics.
This work does not invalidate the many investigations into legislative behavior that uncover inequalities in representation favoring White and affluent constituents over racial and ethnic minority and low-income constituents, respectively (for example, Bartels Reference Bartels2008; Butler and Broockman Reference Butler and Broockman2011; Gilens Reference Gilens2012; Page, Bartels and Seawright Reference Page, Bartels and Seawright2013). Rather, it provides a deeper understanding of inequalities in political representation. Following collective action, re-election-minded legislators seeking to represent the salient interests of their constituents are most likely to represent the preferences of protesters belonging to resource-constrained constituencies.
Costly Protest as Salience-Conveying Participation
Salience is vital for legislative responsiveness. Legislators are more likely to represent constituency preferences when the issue is important to constituents (Canes-Wrone Reference Canes-Wrone2001; Kingdon Reference Kingdon1977; Kollman Reference Kollman1998), perhaps because constituents electorally punish or reward legislators for their roll-call votes on salient legislation (Ansolabehere and Jones Reference Ansolabehere and Jones2010). Legislators know that the importance of an issue to collective action participants is unlikely to reflect the salience, or even the preferences, of all of their constituents. But the fear of negative electoral repercussions from previously inactive participants motivates legislators to be responsive (Arnold Reference Arnold1990). This concern is particularly relevant following protest, since electoral participation increases among individuals who participate in social movements and collective action (Rosenstone and Hansen Reference Rosenstone and Hansen1993).
Protest can serve as a valuable political resource for legislators concerned about their re-election prospects even when the primary goal of protest is not to influence legislative behavior (Kollman Reference Kollman1998; Lohmann Reference Lohmann1993). Employment strikes to encourage corporations to increase minimum wages or improve workplace conditions are not politically focused and do not directly target elected officials. They can, however, inform a legislator about the salience of constituency preferences for labor and employment practices in ways that are not otherwise observable.
Nevertheless, protest is costly. There are opportunity costs associated with choosing to attend an event instead of working or spending time with family. Economic hardships emerge in securing transportation, contributing financially or getting arrested at an event. Physical harm is possible at events that become violent or during encounters with police using pepper spray, tear gas or other crowd control techniques. There are also legal and emotional costs associated with the repression, stigmatization or criminalization of protesters.
These costs are more consequential for groups with fewer resources (Banks, White and McKenzie Reference Banks, White and McKenzie2018; Klandermans Reference Klandermans1984). Opportunity costs and economic hardships are significant for groups with inflexible work schedules, scarce income or fewer participation options. The physical and emotional costs resulting from state repression and stigmatization are more likely for Black protesters (Davenport, Soule and Armstrong Reference Davenport, Soule and Armstrong2011) and other marginalized groups, especially when events diverge from mainstream narratives (Davenport Reference Davenport2010). Similarly, the civic skills and expertise required to co-ordinate events are less likely to exist among groups with lower levels of formal education or those that are detached from civic-minded social and professional networks. I argue that it is the relative costliness of protest for low-resource groups that makes legislators more likely to represent these groups’ concerns.
A Formal Theory of Protest and Legislative Behavior
I develop a formal theory to discern how protesters' resource capacity influences a legislator's decision to support participants' preferences. This theory builds upon Kollman's (Reference Kollman1998) outside lobbying as a costly signaling model. The fundamental difference between the two models is in the consideration of protesters' resource capacity.
As in traditional signaling models, my theory contains a sender with private information about the state of the world and a receiver who takes an action that influences both players' payoffs. The sender is a group, G, and the receiver is a legislator, L. Both the group and legislator possess common knowledge about certain aspects of the issue, such as the distribution of preferences for or against the policy. However, the group has private information about the salience of the issue for the legislator's constituents.Footnote 2 The private information is reflected in the group's type, t i, where i ∈ {L, H}. For the high-type group (t H), the policy in question is highly salient. A low-type group (t L) places relatively little importance on the policy's realization. The group's type is distributed such that the group is a high-salience type (t H) with probability λ and a low-salience type (t L) with probability 1 − λ. This distribution is common knowledge and determined exogenously by nature or some other player or event not involved in this interaction.
The group moves first: it decides whether or not to protest. Even if the group's decision is not motivated by its legislator's responsiveness, it prefers an outcome in which the legislator supports its policy preferences. Nevertheless, protest is costly. The group prefers to get policy support without engaging in protest. The group will protest if it expects that the payoffs of protesting will outweigh the payoffs of inaction.Footnote 3
After the group moves, the legislator takes an action, a, where a ∈ {0, 1}. With this action, the legislator informs the group whether she is supporting its policy preference. The legislator would prefer to support a group that provides her with more electoral support without discouraging existing support. The legislator would prefer to support a high-salience group over a low-salience group, since the former is more likely to base its electoral participation on the legislator's action. What makes this decision interesting is that the legislator does not know whether a high- or low-salience group is protesting. Higher levels of salience increase the probability of protest, but groups with lower levels of salience can also protest. To navigate this quandary, the legislator updates her beliefs about the issue's salience for the group once she observes the group's (in)action. These posterior beliefs are also common knowledge.
The group only receives value from policy support when the legislator chooses to legislatively support the group (a = 1). When the legislator votes against the group's preferences (a = 0), the group receives no utility from protesting. Even when legislative support is likely and important for the group, the costs of protest could prohibit participation. Consequently, the utility that the group receives from protesting is a function of the expected value obtained from participation and the protest costs, p, where p ∈ {0, 1}. As the importance of issue representation increases for a group (0 < t L < t H), it is more willing and able to incur collective action costs (see also Kollman Reference Kollman1998; Lohmann Reference Lohmann1993). Similarly, protest costs decrease as the group's resource levels increase, where C r = (0, 1). The group's expected utility of protesting is as follows:
 $${\rm E}{\rm U}_{G_i}( {a, \;p, \;t_i} ) = a-\displaystyle{\,p \over {t_i}} \times C_r$$
Notice that the cost component of the utility function includes the participants’ resource level, C r. This is a departure from the outside lobbying as costly signaling model in Kollman (Reference Kollman1998) as well as other scholarship that do not explicitly account for participants’ resource levels when seeking to understand legislative behavior following protest. The addition of this variable in the model enables analyses of whether and how protesters' resource capacity influences legislative behavior.
When choosing how to respond to a protest, the legislator considers the consequences of each potential action. When the group's salience is high (t H), she receives a positive payoff for supporting the group (a = 1) and no payoff if she does not support the group. Choosing to support the group may result in an electoral gain, but this decision is also costly. This cost, k = (0, 1), could arise from writing and implementing legislation, convincing others to adopt the group's policy position, supporting the group instead of another group, or any other type of support that results in the legislator expending resources on behalf of group G. This cost is particularly high when participants' issue preferences diverge from other legislative considerations (party pressures, constituency preferences or the legislator's personal preferences). The legislator's costs may be small or even non-existent if non-protesters' preferences align with protesters' concerns. Indeed, protest can have a positive, indirect influence on legislative behavior through public opinion (Gillion Reference Gillion2020; Lee Reference Lee2002; Mazumder Reference Mazumder2018; Wasow Reference Wasow2020). The legislator has the following utility function:
 $${\rm E}{\rm U}_L( {a, \;t_i} ) = a( {t_i-k} ) $$
This utility function suggests that a legislator will support a group if the expected utility of doing so is greater than the expected utility of not supporting it.
Theoretical Expectations
A particularly interesting equilibrium of this theoretical model is the perfect Bayesian semi-pooling equilibrium in which the legislator supports a protesting group with probability γ but never supports a group that does not protest, and the group always protests when salience for the issue is sufficiently high (t H) but protests with probability α when salience is low (t L).Footnote 4 This model specification characterizes real-world phenomena in which some groups protest despite having low issue salience, while some high-salience groups do not receive legislative support for their issues. Furthermore, it reveals several implications relating to legislative behavior. The first implication concerns the likelihood of legislative support of protesters compared to non-protesting groups.
Hypothesis 1 (Protest Hypothesis): A legislator is more likely to support a group that protests than one that does not protest.
While legislators certainly represent the preferences of constituents who do not protest, the strategy informing this hypothesis is grounded in protest's ability to reveal constituents' issue salience. Protest can better convey issue salience than other forms of communication. For example, voting during elections reveals preferences but not the intensity or prioritization of those preferences. Public opinion polls can communicate salience, but only after an academic or polling agent deems the issue important enough to include on a survey. Likewise, effective lobbying is more about access and networks than communicating the intensity of issue preferences (for example, Baumgartner et al. Reference Baumgartner2009). Protest, however, can communicate issue preferences, and the salience of those preferences increases the likelihood of representation.
The strategy also ensures that the legislator is indifferent between supporting and not supporting a protesting group to enable predictions of when legislative support following protest is likely. The most relevant implication of this equilibrium for the relationship between protesters' resources and legislative behavior is revealed in Result 5 (derivation in Appendix A), which describes the probability of legislative support following protest (γ) relative to protesters' resource capacity (C r). This result yields the following hypothesis:
Hypothesis 2 (Resource Constraint Hypothesis): A legislator is more likely to support protesters as protesters' resource capacity decreases.
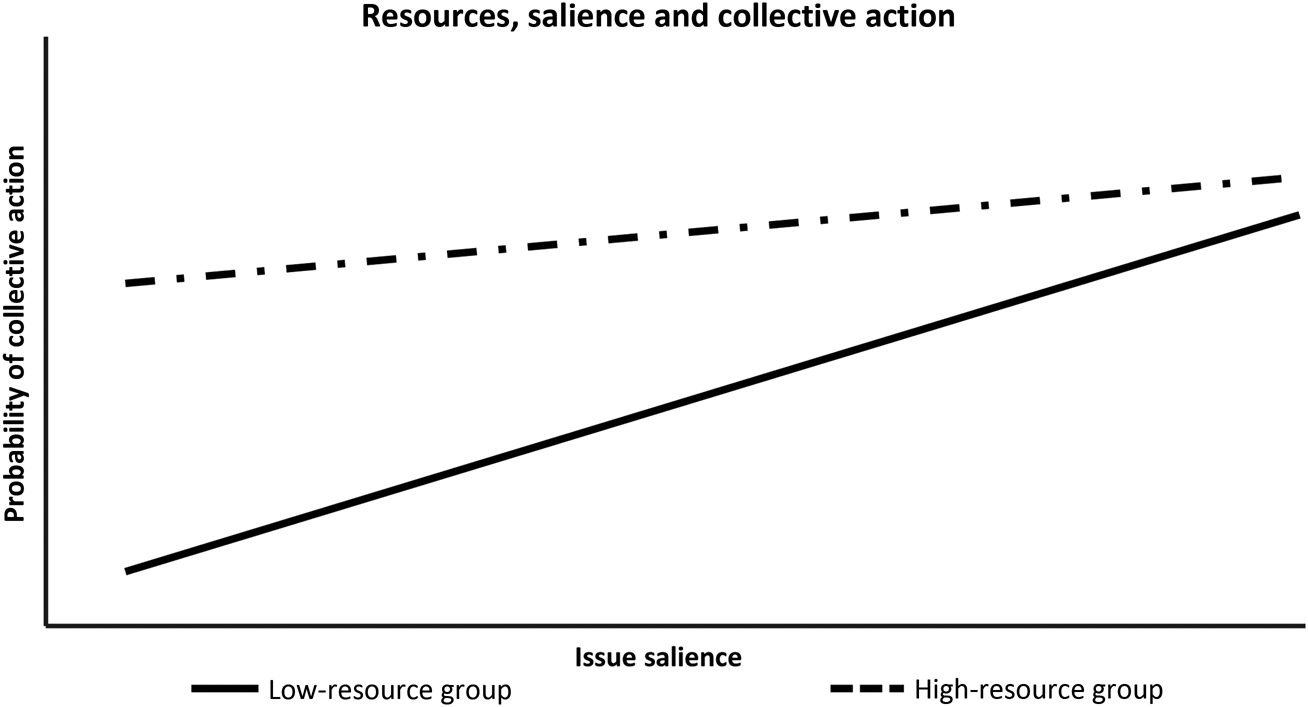
As Figure 1 depicts, the probability of protest rises as the salience of the issue inciting collective action increases for both high- and low-resource groups (also see Results 3 and 4 in Appendix A). Yet this probability is also influenced by the group's resource capacities (see Equation 1 above). For low-resource groups, the costliness of protest prevents collective action at lower levels of issue salience; but when issue salience is high, the costs of participation are less prohibitive for collective action. For high-resource groups, their resource levels enable participation independently of issue salience. Consequently, collective action by low-resource groups is more likely to represent truly salient concerns, whereas protest by high-resource groups is possible even when issue salience is low.
Expectations for the likelihood of protest by low- and high-resource groups
Note: this is a hypothetical depiction of the relationship between resources, salience and the likelihood of protest based on the expected utility of protest (Equation 1) and the implications of the semi-pooling perfect Bayesian equilibrium. The solid and dashed lines denote how increasing costs (based on protesters' resource capacities) and issue salience interact to influence the likelihood of protest for low- and high-resource groups, respectively.

Data and Measures
I employ several datasets with information on protests, legislators and the congressional districts they represent to empirically test the theoretical implications relating to legislative behavior following protest. The primary dataset is the Dynamics of Collective Action (DCA), which is a compilation of all US protest events reported in the New York Times from 1960 through 1995 (McAdam and Su Reference McAdam and Su2002). The DCA includes a wealth of information on the nature and frequency of protest and has been used extensively to analyze the relationship between protest and policy making (for example, Gillion Reference Gillion2012; McAdam and Su Reference McAdam and Su2002).
The empirical analyses are confined to the most recent events available in the DCA, 1991 through 1995, to avoid the infamous social movement activity of the 1960s through the 1980s in which many politically marginalized groups were involved in sustained social movement activity to produce radical change. During that period, collective action was more frequent, media coverage was more prevalent, and public issue salience for civil rights and civil liberties-related issues was relatively high. Hence, assessing protests occurring from 1991 through 1995 enables a more straightforward, albeit conservative, empirical test of legislative behavior given protesters' resource capacity. Another benefit of this period of analysis is the variability in the partisan control of each Congress.Footnote 5 Partisan control affects the types of issues that legislators have the opportunity to vote on and the strategies they employ when voting (Peress Reference Peress2013; Whitby Reference Whitby1997). Indeed, a legislator is more likely to defect from voting with her party when it is in the minority than when it is in the majority (Cox and McCubbins Reference Cox and McCubbins2005; Whitby Reference Whitby1997). The generalizability of the empirical findings is revisited in the discussion section.
The dependent variable, which is described in detail in the next section, measures legislative support for collective action on the first final-passage roll-call vote following a collective action event but during the same congressional session. Therefore, the analyses are based on legislative responsiveness from 1991 through 1996 (that is, the 102nd, 103rd and 104th Congresses).
Analyses are conducted for the issue area with the most frequent major topic classification of protest claims in the DCA: civil rights, minority issues and civil liberties. Over two-thirds of events in the DCA fall into this category. This issue area classification embraces a variety of concerns including abortion, hate crimes, first amendment freedoms, access to education, affirmative action, immigration, globalization and discrimination based on gender, age, sex, sexuality, race or religion. Furthermore, only liberal claims are included in the empirical analyses.Footnote 6
Representation Via Roll-Call Votes
Legislative responsiveness is the degree to which representatives' behavior shifts following a change in constituency behavior (Achen Reference Achen1978). This investigation explores legislators' responsiveness to protesters by focusing on their roll-call voting behavior. Roll-call voting facilitates position taking and allows constituents to monitor legislative behavior. The recognition that constituents may vote against a legislator once they learn about a roll-call vote incites legislators to be strategic in casting such votes (Ansolabehere and Jones Reference Ansolabehere and Jones2010; Arnold Reference Arnold1990; Hutchings Reference Hutchings2003).
I create a dependent variable, Support, indicating whether a legislator supports constituents' preferences. For districts where a protest occurs, I first identify the legislator(s) representing constituents in cities where the protest occurs using GIS software.Footnote 7 I then extract the specific claim, or concern, of each protest as detailed in the DCA.Footnote 8 The first final-passage roll-call voteFootnote 9 on an issue relevant to protesters' claims is found using http://www.govtrack.us. If protesters' preferences relating to the roll-call vote align with their legislator's vote, then Support takes a value of 1, and 0 otherwise.Footnote 10 A legislator supports, or is responsive to, protesters if she votes in support of the claims specified during a protest on the first final-passage roll-call vote occurring after the event and before the next congressional election.Footnote 11
In districts where protests do not occur, I use the multilevel regression and post-stratification (MRP) method to produce an estimate of district-level opinion from national survey data (Lax and Phillips Reference Lax and Phillips2009; Warshaw and Rodden Reference Warshaw and Rodden2012) to estimate legislative support. For the 1992, 1994 and 1996 American National Election Study (ANES) surveys, I partially pooled responses across districts for questions appearing in all three surveys relating to civil rights, minority issues and civil liberties issues.Footnote 12 A respondent is coded 1 – pro-civil rights, minority issues and civil liberties issues – if he supports at least half of the issue-area-related questions, and 0 otherwise.Footnote 13 Using the glmer package in R, the individual survey responses are estimated using a hierarchal model of the binary dependent variable (whether they are pro-civil rights, minority issues and civil liberties issues) as a function of individual characteristics (race, age, income, survey), district, district characteristics (income, percent Black, percent Hispanic, percent urban), region, state and state characteristics (veteran population). The estimates are then post-stratified using breakdowns of congressional district demographics by race, age and income.Footnote 14 This MRP process culminates in a measure of the percentage of a district that is pro-civil rights, minority issues and civil liberties issues for each Congress. This measure is used to identify whether legislators support constituents' civil rights, minority issues and civil liberties issue area preferences in districts where protest did not occur for each roll-call vote identified as relevant to protesters’ claims.
In the 102nd through the 104th Congresses, 612 unique protests occurred within the civil rights, minority issues and civil liberties major topic classifications. For 82 per cent (n = 503) of those events, members of the House of Representatives voted on at least one bill addressing the issue raised during a protest.Footnote 15 Once the location of the protest event is accounted for, there are 3,012 protest observations for analysis.Footnote 16 For each bill relating to issues raised during a protest, the analyses also include the roll-call voting behavior of legislators representing districts with no protests (n = 31,055 observations).Footnote 17
A logistic regression with congressional district random effects is employed to account for the dichotomous dependent variable and the possibility that a protest may be included multiple times in the analyses (Greene Reference Greene2008, Ch. 23).Footnote 18 The primary independent variables remain robust to alternative model specifications (see Appendix D).
Protests, Resources and Other Legislative Considerations
The DCA includes several measures relating to protesters' resource capacities: their perceived income, race and ethnicity, and organizational capacity.Footnote 19 These resource variables relate to the opportunity costs, economic hardships, physical harm, and legal and emotional challenges associated with participation and that differentially affect groups depending on their economic well-being, social or political standing, and connectedness in networks. For each of these resource variables, the reference category, 0, indicates districts where protest does not occur. The value of 1 is given to the high-resource group, whose participation may not be indicative of the protesters' issue salience. The value of 2 is given to the low-resource group, whose participation depends on having high issue salience. Thus, the variables are coded such that constituents' revealed issue salience increases with the value of the measure.
Economic resource capacity is measured using Low-Income Participants, a variable denoting whether the DCA describes any protesters at an event as being low income or homeless.Footnote 20 It is easier for higher-income groups to afford transportation, childcare or other pecuniary participation costs. They are also more likely to have internal and external political efficacy and to be in networks that encourage political participation.
The Non-White Participants variable compares protests involving racial or ethnic minorities to White protests.Footnote 21 While racial and ethnic minorities, on average, have less income and education than their White counterparts, the resource capacities relating to race and ethnicity are more than just socioeconomic. For example, Black protesters are more likely to be arrested at a protest event than White protesters (Davenport, Soule and Armstrong Reference Davenport, Soule and Armstrong2011), and the presence of foreign imagery at a protest is enough to increase negative reactions to protest and decrease support for more immigration (Wright and Citrin Reference Wright and Citrin2011). These negative outcomes increase the protest costs for likely participants. Thus, race and ethnicity matter independently of income, given the differential costs associated with protesting for these historically marginalized groups.
Resource disparities are also revealed in a group's organizational capacity, which is measured using a binary variable, No Organized Interest Group, indicating the absence or presence of a formal interest group.Footnote 22 The presence of an organized interest group suggests an agent that can co-ordinate events as well as entice participation even when issue salience is low.
The DCA data is supplemented with data on legislators and their congressional districts. The replication dataset from the Paradox of Representation provides data on the districts' level of education and the legislators' party, length of service in Congress, race and gender (Lublin Reference Lublin1997). Additionally, the legislator's winning vote share in the previous election is attained from the CQ Press Voting and Elections Collection (CQ Press 2015).
Results: Resources and Legislative Support
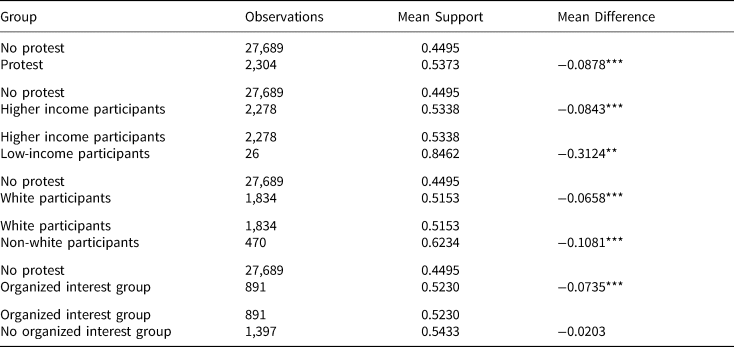
The theoretical expectations suggest that legislative support for constituency preferences should be more likely following a costly protest than a less costly protest or no protest at all. The difference of means tests (t-tests) in Table 1 provide preliminary empirical support for these expectations. For each variable, the likelihood of legislative support increases as participation becomes more costly. These differences reach conventional levels of statistical significance, except when comparing protesters’ organizational capacity.
Difference of means tests by legislative support (liberal claims)

*p < 0.10, **p < 0.05, ***p < 0.01
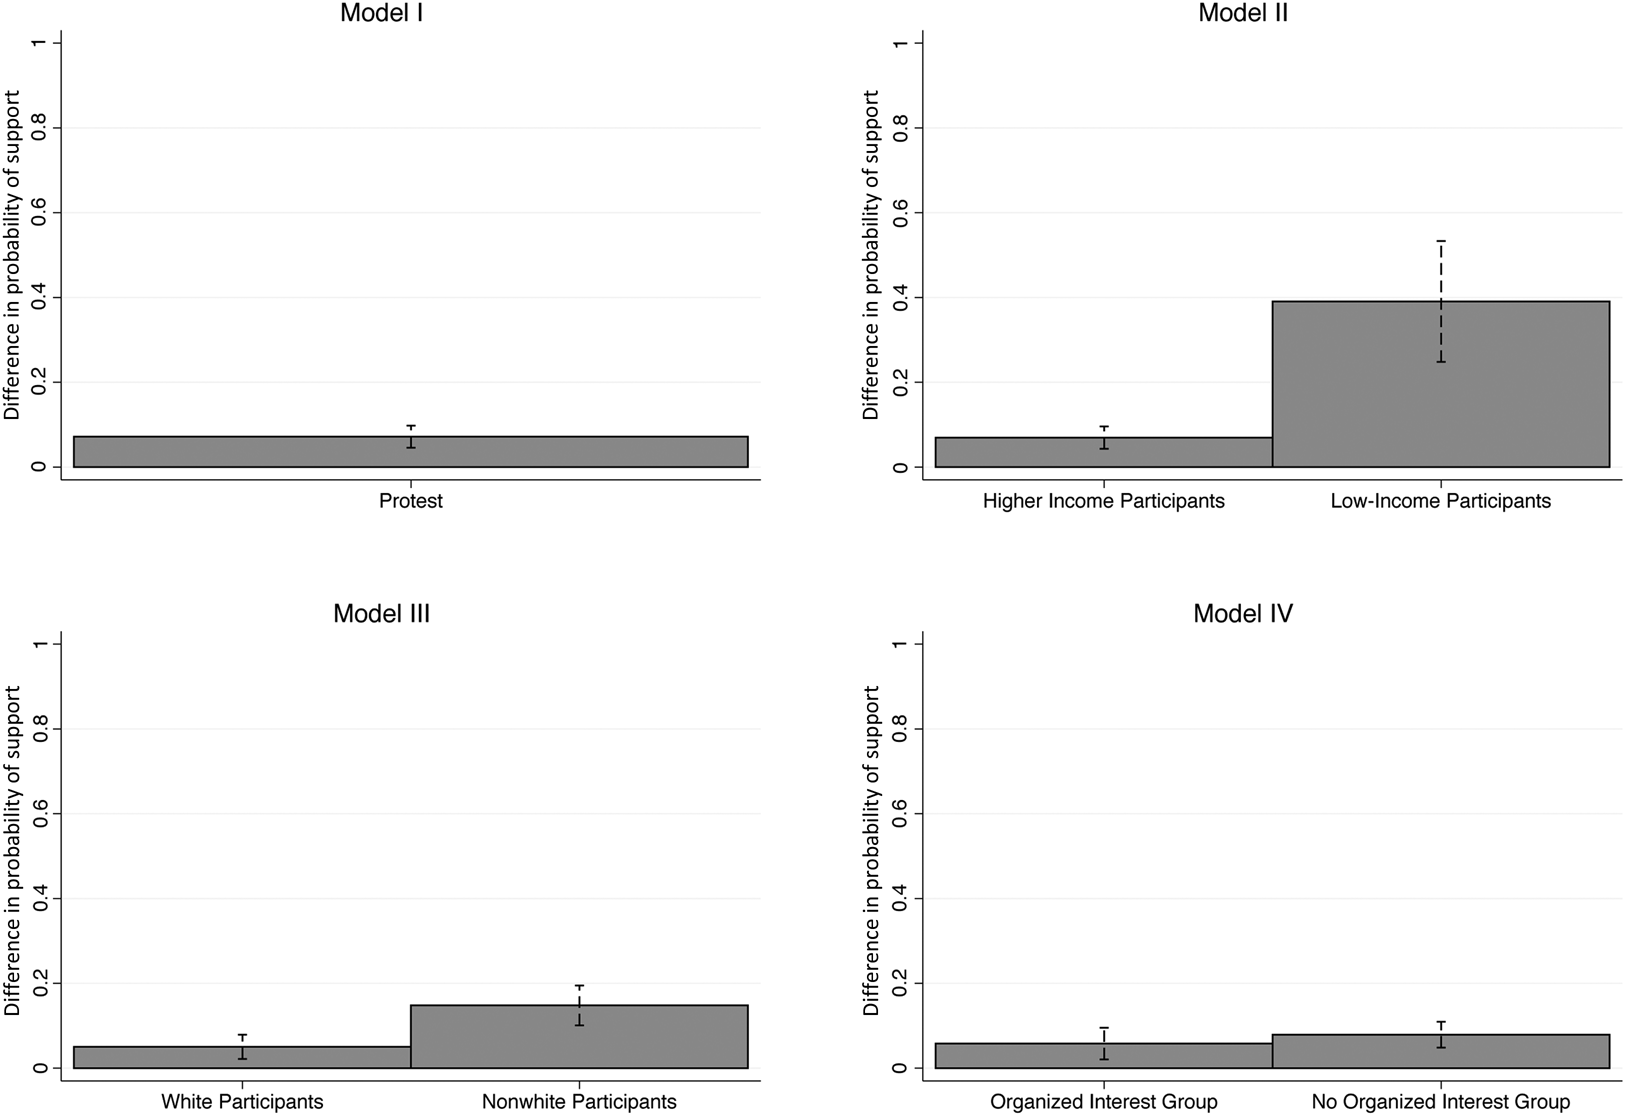
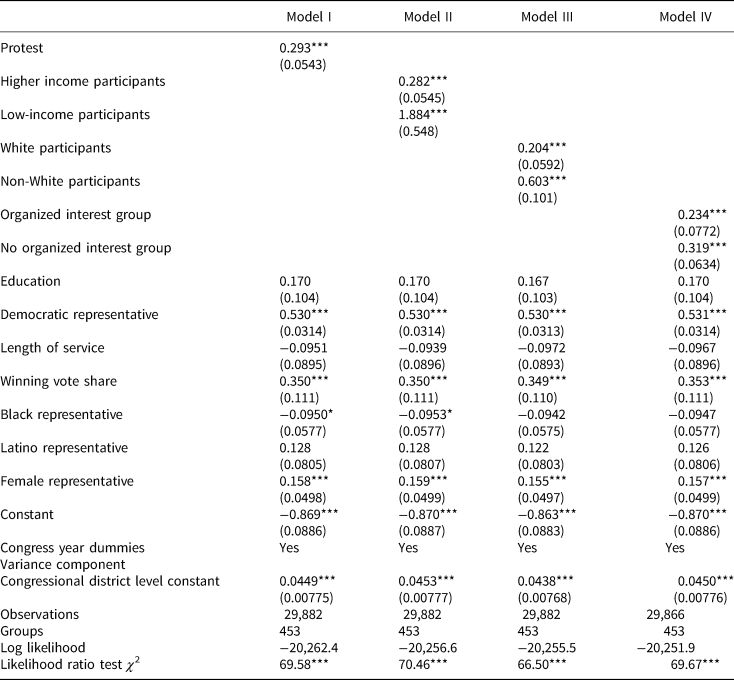
The empirical models in Table 2 employ logistic regressions with congressional district random effects to further evaluate the theoretical argument. Model I compares legislative support for constituency preferences in districts with and without a protest. The coefficient on the Protest variable suggests that legislators are more likely to support constituency preferences when there is a protest about an issue addressed during a roll-call vote than they are to support constituency preferences when a district does not experience a relevant protest. Figure 2 shows that the probability of legislative support for constituency preferences is 7.2 percentage points higher (p < 0.05) in districts where a protest occurred than in those without a protest when all other variables are held at their means.
Protesters' resources and legislative support
Note: derived from Models I–IV in Table 2. Model I displays the differences in the predicted probability of legislative support of preferences in districts with a protest relative to districts without a protest relevant to a roll-call vote. Models II–IV display the differences in the predicted probability of legislative support of low-resource groups (left bar within each graph) and high-resource groups (right bar within each graph), each relative to districts without a protest. The differences in each graph are statistically significant. All covariates are held at their means.

Legislative support and constituency preferences (liberal claims)

In Models II–IV of Table 2, the positive and statistically significant coefficients on the resource variables suggest that legislators are more likely to support constituency preferences following a protest in their district than if there is no protest in their district. Referring again to Figure 2, there are statistically significant differences in legislative support based on how well resourced the protesting groups are. The greatest difference occurs with respect to protesters' economic resource capacity: the predicted probability of legislative support following a protest by low-income participants is 39 percentage points higher (p < 0.05) than the predicted probability of legislative support without a protest. In contrast, the difference in support for higher-income protesters compared to districts without protests is only 7 percentage points (p < 0.05). Thus legislative support is 32 percentage points greater following protest by low-income participants than protest by higher-income participants. An F-test suggests the difference in legislative support for low- vs. higher-income participants is statistically significant.
Similar patterns emerge for race: legislative support is 14.7 percentage points more likely (p < 0.05) following non-White protest relative to no protest and 5 percentage points more likely (p < 0.05) following White protest relative to no protest. This suggests that legislators are more than twice as likely to support non-White protesters than White protesters. Once again, an F-test reveals that the greater likelihood of legislative support for non-White compared to White protesters is statistically significant.
The weakest differences in legislative support given protesters' resource capacity occur when evaluating protesters’ organizational capacity: legislative support is 7.9 percentage points more likely (p < 0.05) following grassroots protest relative to no protest and 5.8 percentage points more likely (p < 0.05) following formally organized protest relative to no protest. While legislators may be more likely to support grassroots protesters relative to formally organized protesters, this difference in legislative support is again not statistically significant at the 0.05 level.
Taken together, these results suggest that legislative support is most likely following costly protest for all measures of resource capacity, though the difference is not statistically significant for organizational capacity. In no analysis does legislative support favor high-resource protesters or constituencies without a protest. These empirical corroborations of the theoretical expectations exist even after controlling for other indicators of legislative voting behavior. Table 2 shows similar influences from a legislators' constituency, party and personal preferences across each model. Democratic and female legislators are more likely than Republicans and Independents, or males, respectively, to support constituents' preferences on legislation relating to civil rights, minority issues and civil liberties issues raised during protests. And, as a legislator's winning vote share in the previous election increases, she is more likely to support constituents' preferences. The controls in the models demonstrate that legislators are likely responding to protesters in their districts even as they consider other factors that influence their behavior.
Placebo Tests
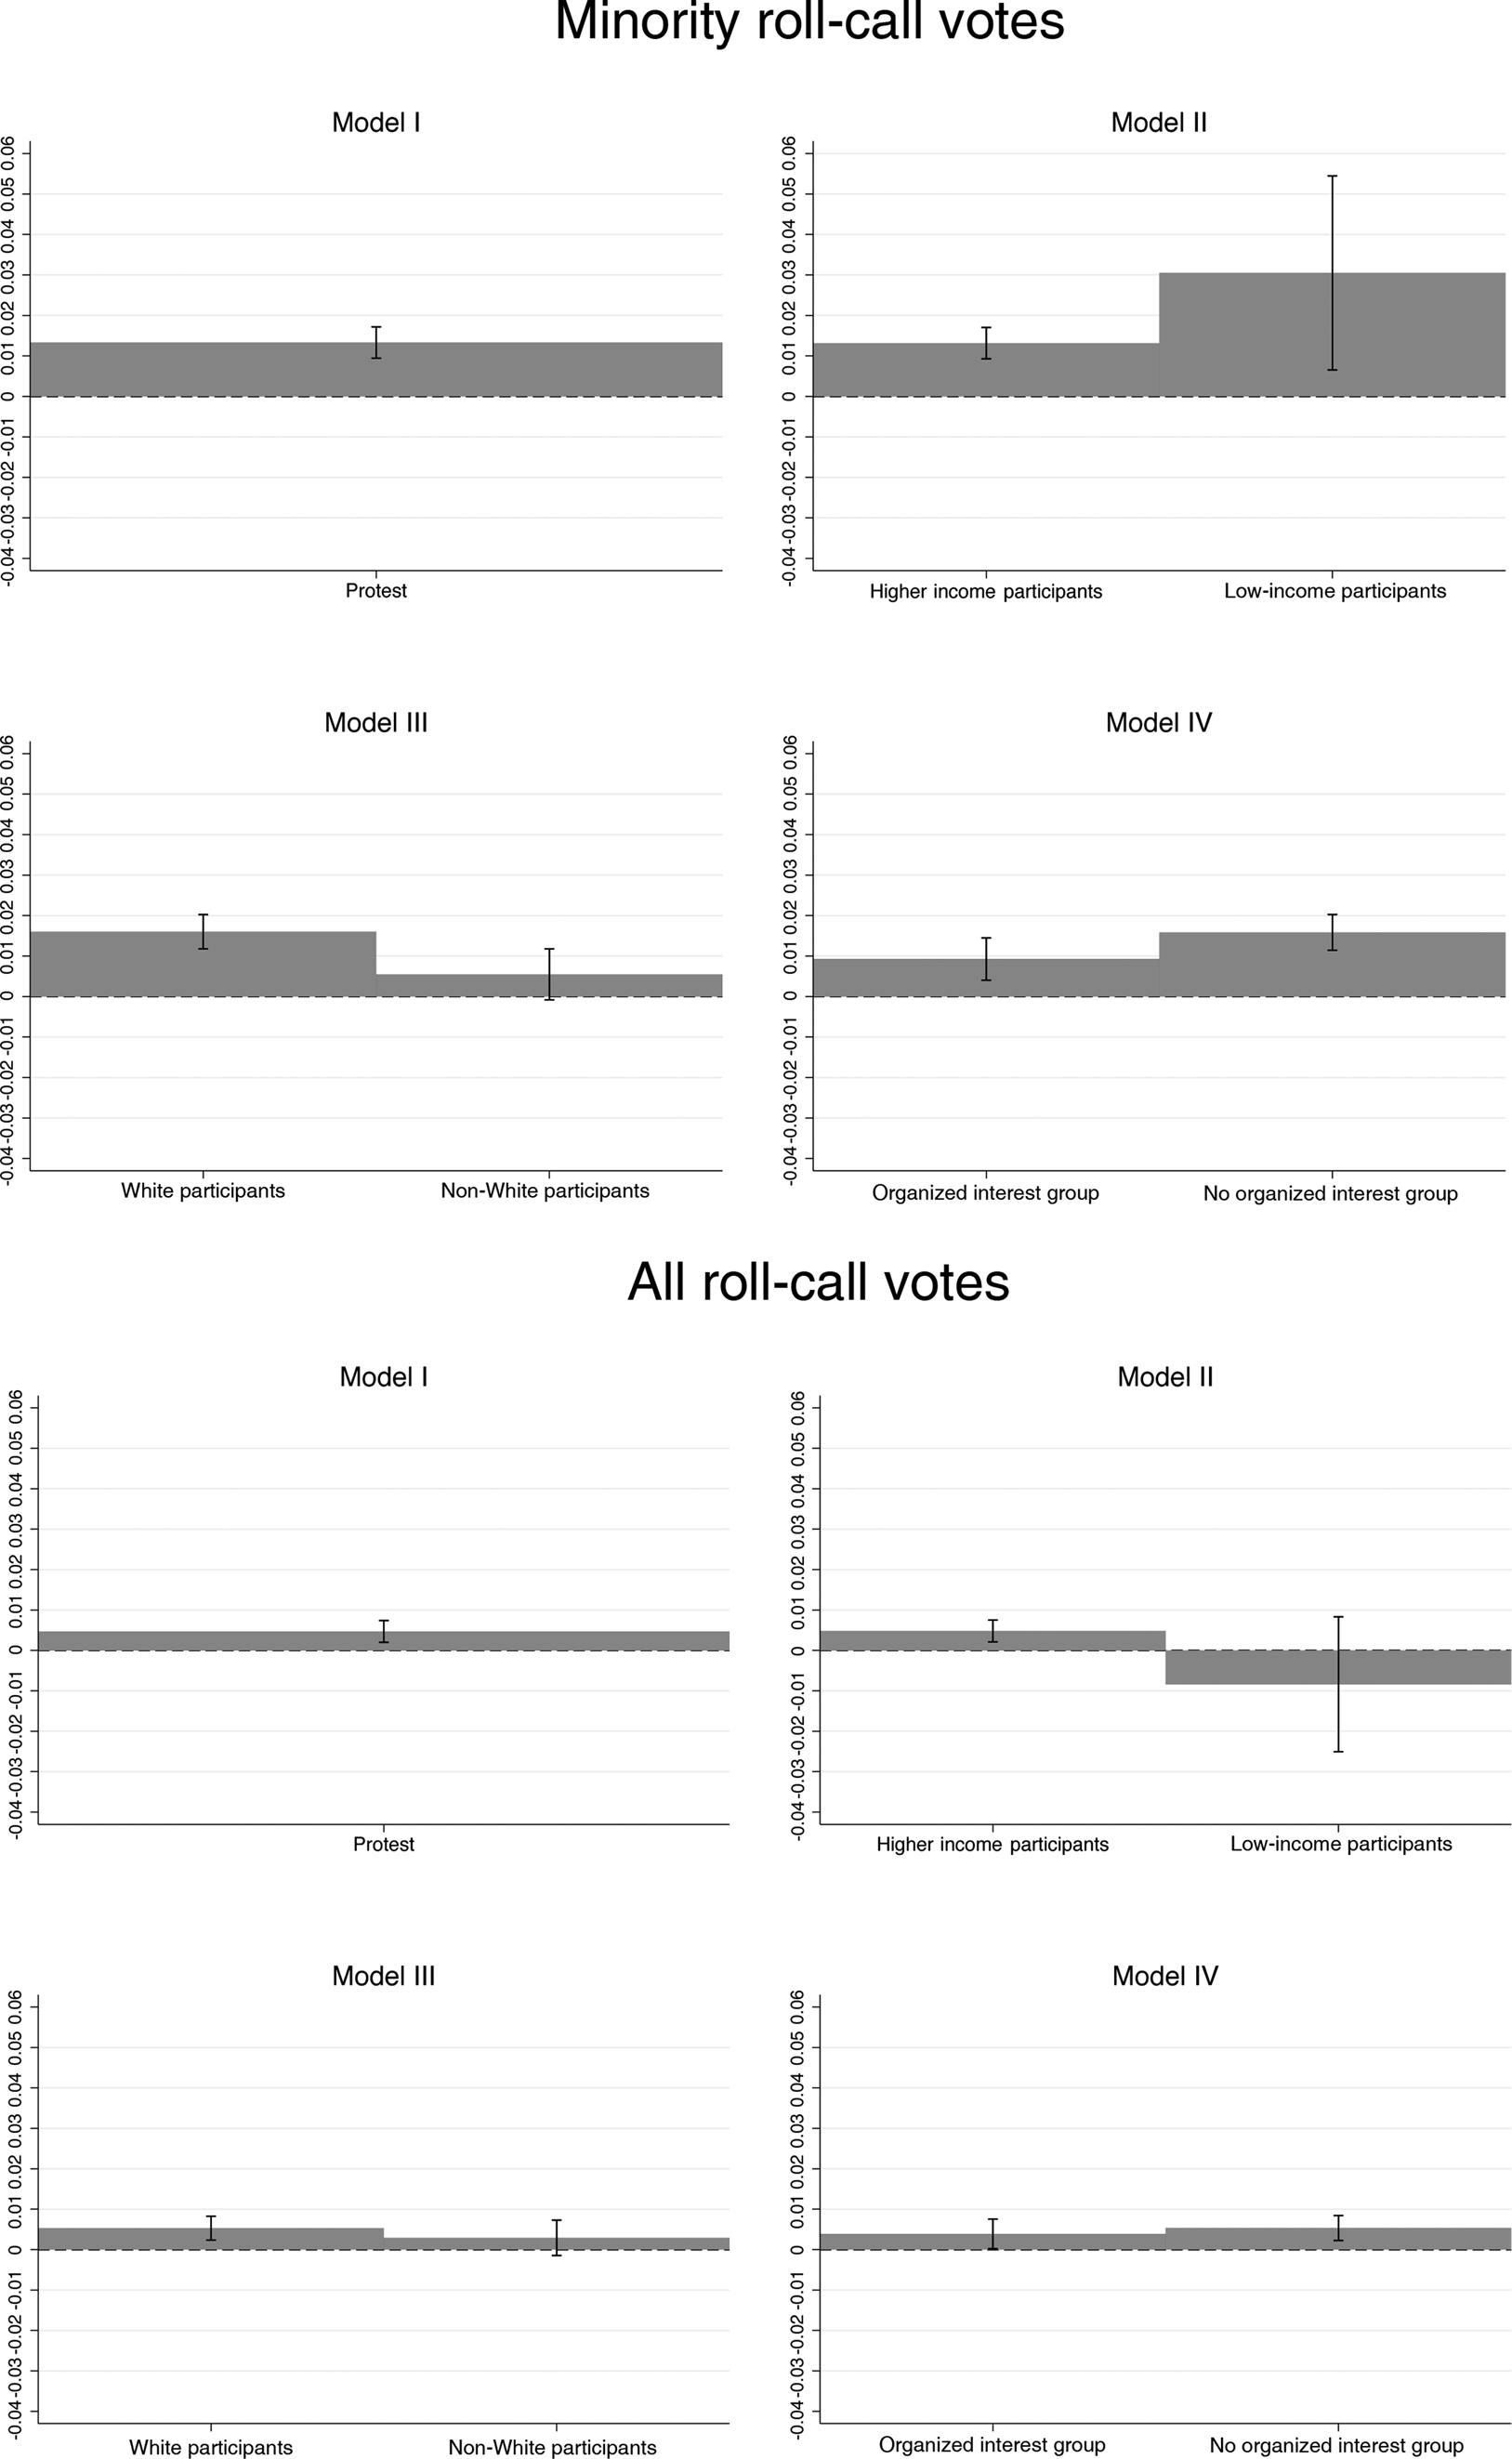
Theoretically, legislative roll-call voting behavior should align with the preferences of constituents engaging in costlier participation only on roll-call votes related to protesters' interests. That is, legislators' roll-call voting on bills that are unrelated to issues raised during protest should align less often with constituents engaging in costlier participation. Figure 3 evaluates these expectations by examining two additional sets of roll-call votes.Footnote 23 The first set of graphs demonstrates that on minority roll-call votes, legislators are more likely to support issues expressed during protests relative to those not expressed during protest.Footnote 24 However, the difference in favor of protesters is smaller for minority roll-call votes (1.3 percentage points) than for roll-call votes immediately following protests and more directly related to protesters' concerns (7.2 percentage points, shown in Figure 2). Moreover, an F-test suggests that the differences in legislative support in favor of low- relative to high-resource groups on these minority roll-call votes are not statistically significant.
General legislative support (via W-NOMINATE scores) and constituency preferences (liberal claims)
Note: derived from mixed-effects logistic regression models. Tables appear in Appendix E. Model I displays the differences in the predicted probability of legislative support of preferences in districts with a protest relative to districts without a protest relevant to a roll-call vote. Models II–IV display the differences in the predicted probability of legislative support of low-resource groups (left bar within each graph) and high-resource groups (right bar within each graph), each relative to districts without a protest. All covariates are held at their means.

Figure 3 further demonstrates that legislators' roll-call voting is unlikely to align with the preferences of constituents engaging in costlier participation on unrelated roll-call votes. Legislators are more likely to support high-resource groups than non-protesting constituents (p < 0.05) and grassroots protesters over non-protesting constituents (p < 0.05). But in no case is there a statistically significant difference in legislative support in favor of low- relative to high-resource protesting groups. In sum, Figures 2 and 3 confirm that legislative roll-call voting behavior aligns with the preferences of constituents engaging in costlier participation, but only on roll-call votes related to protesters' interests.
Alternative Explanations
Legislators may be less concerned about participants’ resource levels than they are about the issue salience revealed by other protest characteristics. That is, if most grassroots protests involve thousands of participants while protests by organized interest groups involve dozens, then the fact that legislators are more responsive to grassroots protesters compared to formally organized protesters could be a function of the size of the event rather than participants' resource capacity.Footnote 25 This concern is addressed by including in each of the subsequent models an interaction between protesters' resources and another salience-conveying characteristic of protest.Footnote 26
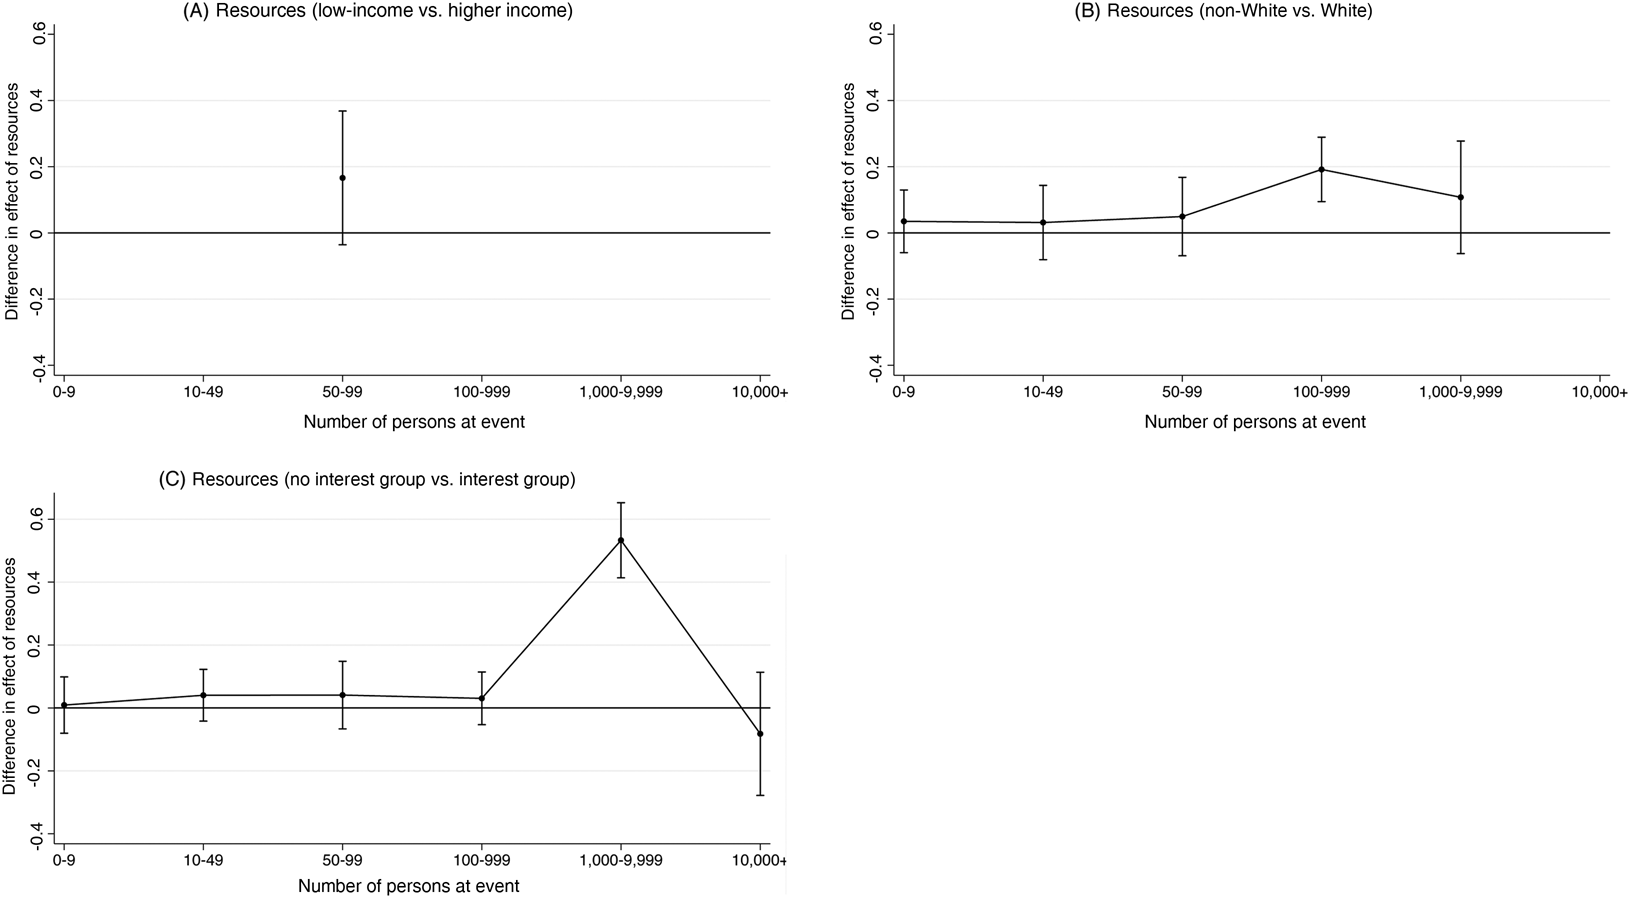
Figure 4 displays the difference in the probability of legislative support for protest for low- vs. high-resource groups for differently sized protests.Footnote 27 A trend emerges for all three resource capacity measures: when the protest is extremely small or large, there is generally no statistically significant difference in legislative support for low- relative to high-resource protesters. This is perhaps because legislators are unable to gauge the salience of an issue when very few people show up for a protest. However, when the event is extremely large, it is difficult for a legislator to infer that no one cares about the issue being protested. The behavior of the relationships at the extremes in Figure 4 does not disconfirm the implications of the formal theory, but suggests that there are contexts in which the costly signal provided by protesters' resources is more informative. Following moderately sized protests, legislators are more likely to support low-resource protesters than their higher-resource counterparts.
Resources, salience (size) and legislative support
Note: the differences in the predicted probability of legislative support of low- relative to high-resource groups at different protest sizes. All covariates are held at their means.

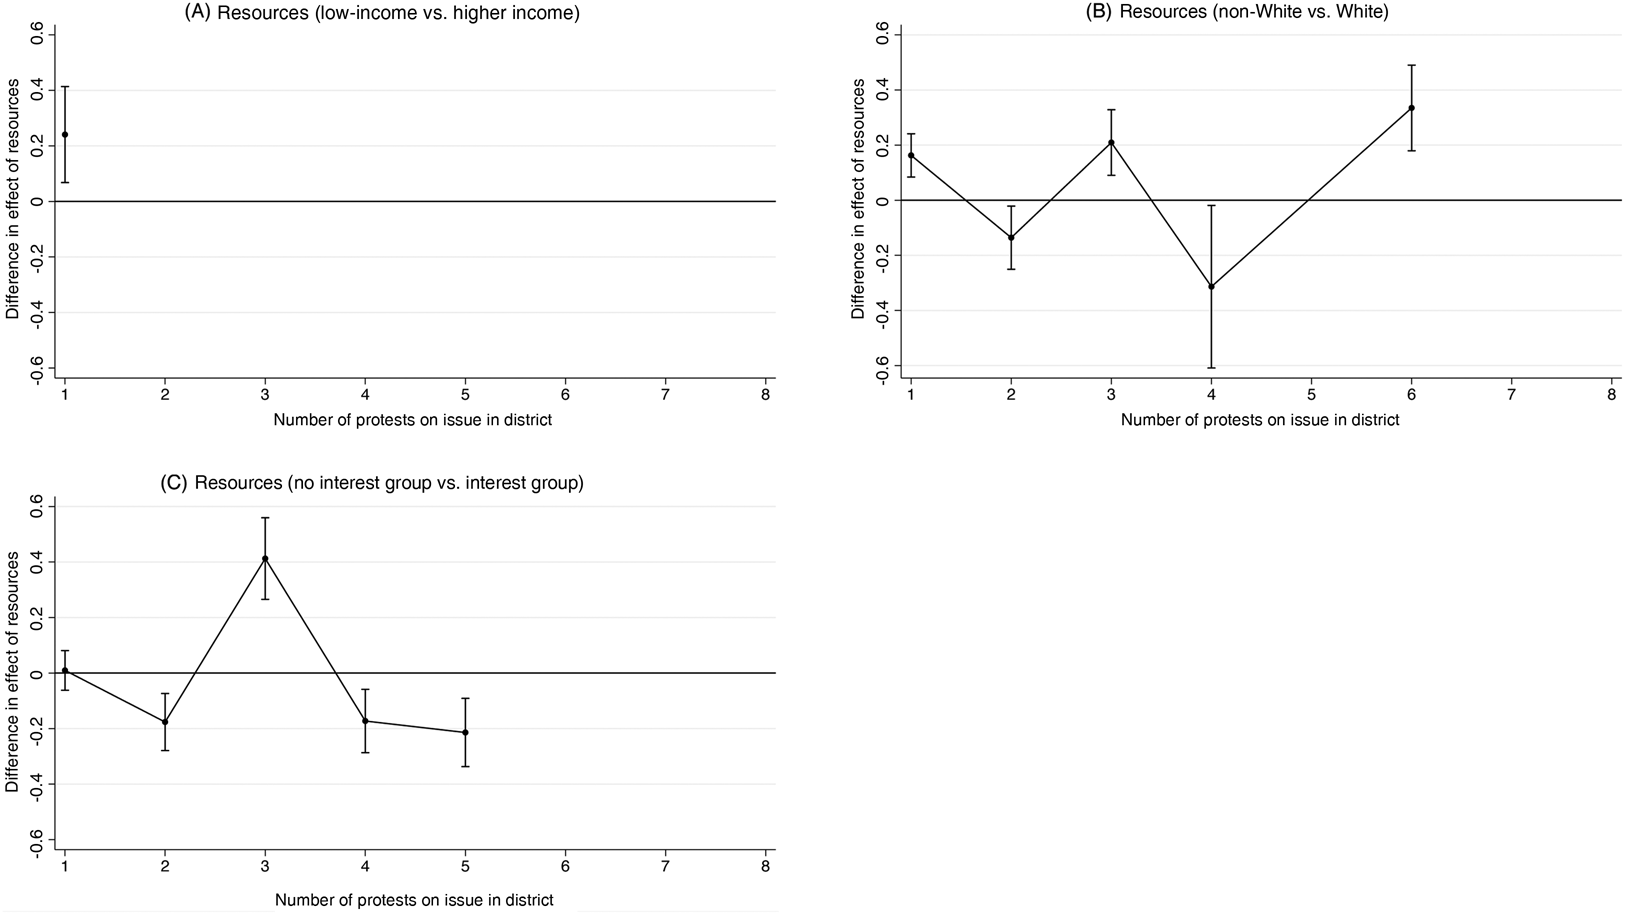
Figure 5 displays the difference in legislative support for low- and high-resource groups by the number of protests by each group in each district before a roll-call vote on issues raised during protest. When low- and high-resource groups protest at similar frequencies, legislators are at times more likely to support high-resource groups and other times are more likely to support low-resource groups. While this suggests that the greater legislative support for low-resource groups is not absolute, it also implies that legislators remain concerned about the issue salience revealed by protesters' resource capacities. The lower participation barriers for high-resource groups enable greater protest frequency,Footnote 28 but they might also be responsible for the generally lower likelihood of legislative support relative to low-resource groups.
Resources, salience (frequency) and legislative support
Note: the differences in the predicted probability of legislative support of low- relative to high-resource groups given protest frequency in each district per roll-call vote. All covariates are held at their means.

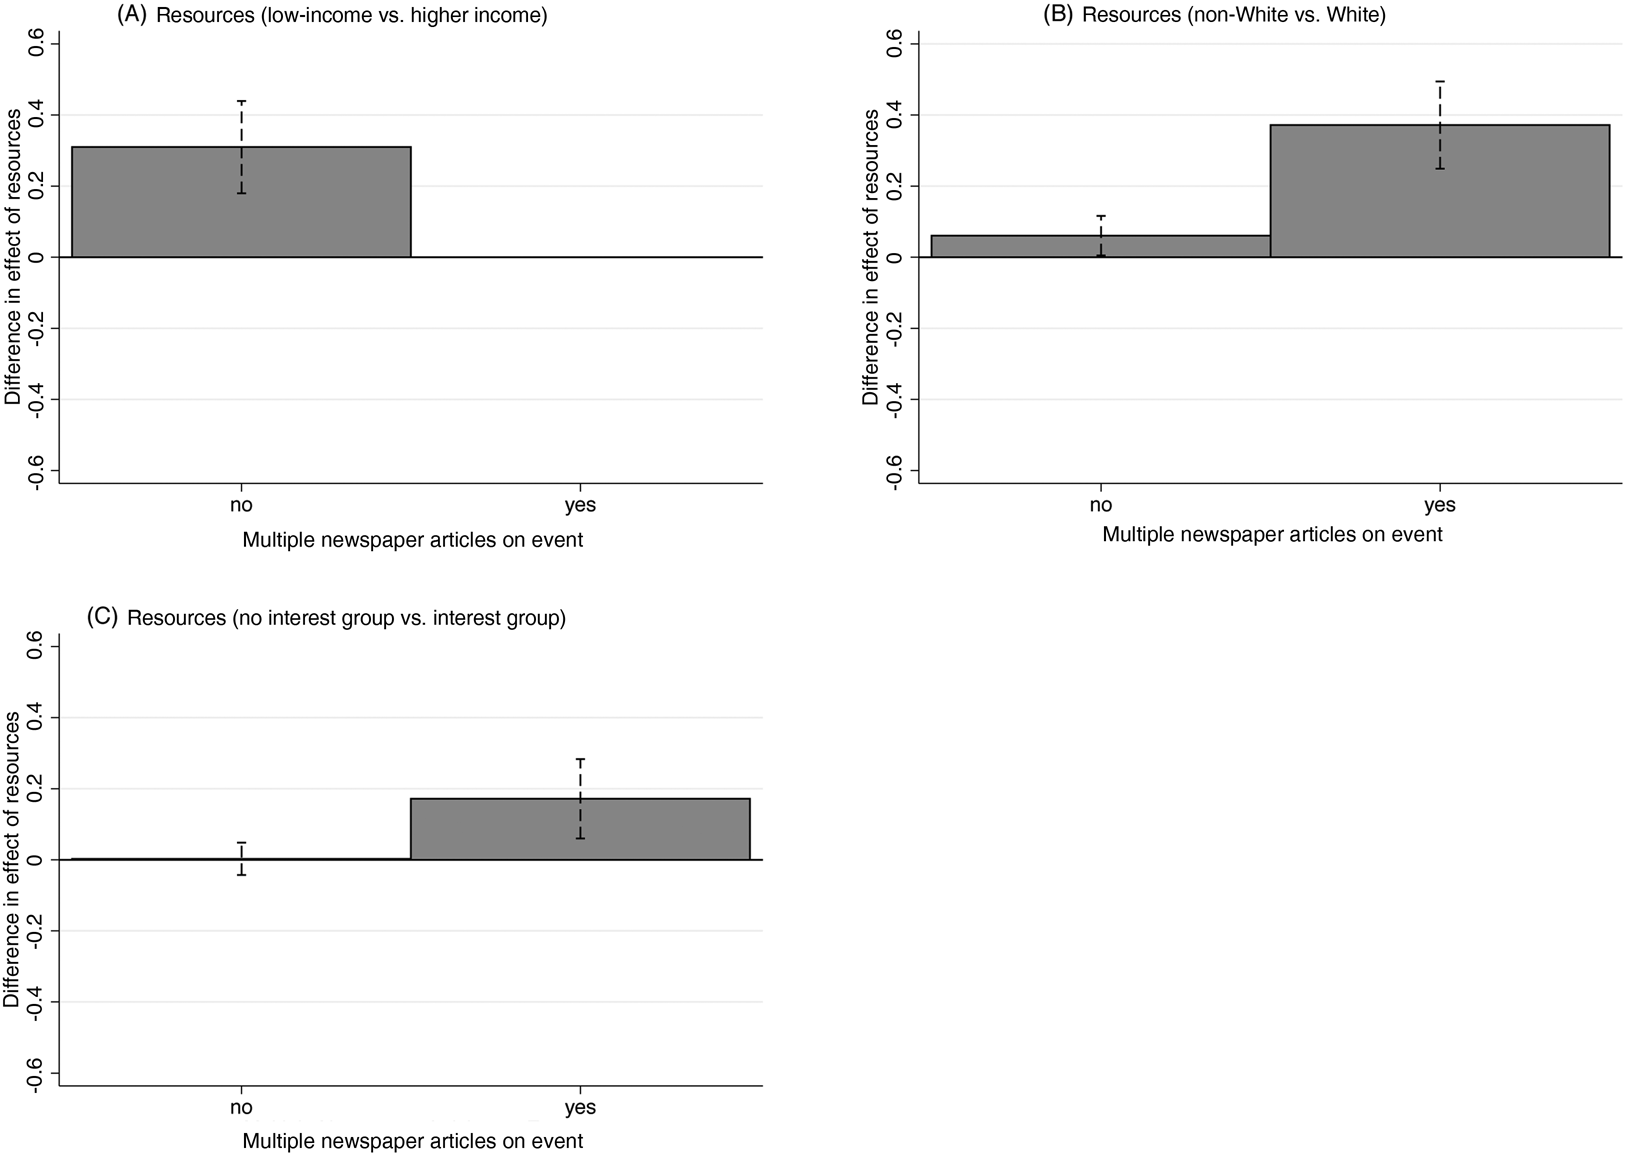
Another alternative explanation for the greater legislative support for low-resource protesters might be the amount of coverage protests receive in the New York Times. While the New York Times is a proxy for the presence of protests on legislators' radar, the newspaper's coverage of events could incite salience or give a greater platform to events it covers (for example, Wouters and Walgrave Reference Wouters and Walgrave2017). Figure 6 demonstrates that regardless of the number of times the New York Times covers a protest, legislators are more likely to support low-resource groups following protest than they are to support high-resource groups. These differences are statistically significant, except for when there is only one story on protests featuring protesters’ organizational resource capacity (Figure 6C). Nevertheless, when accounting for the newspaper's coverage of protest events, legislators remain more responsive to the preferences of low- than high-resource protesters.
Resources, salience (media coverage) and legislative support
Note: the differences in the predicted probability of legislative support of low- relative to high-resource groups for protests covered in one (the left bar) or multiple (the right bar) New York Times articles. All covariates are held at their means.

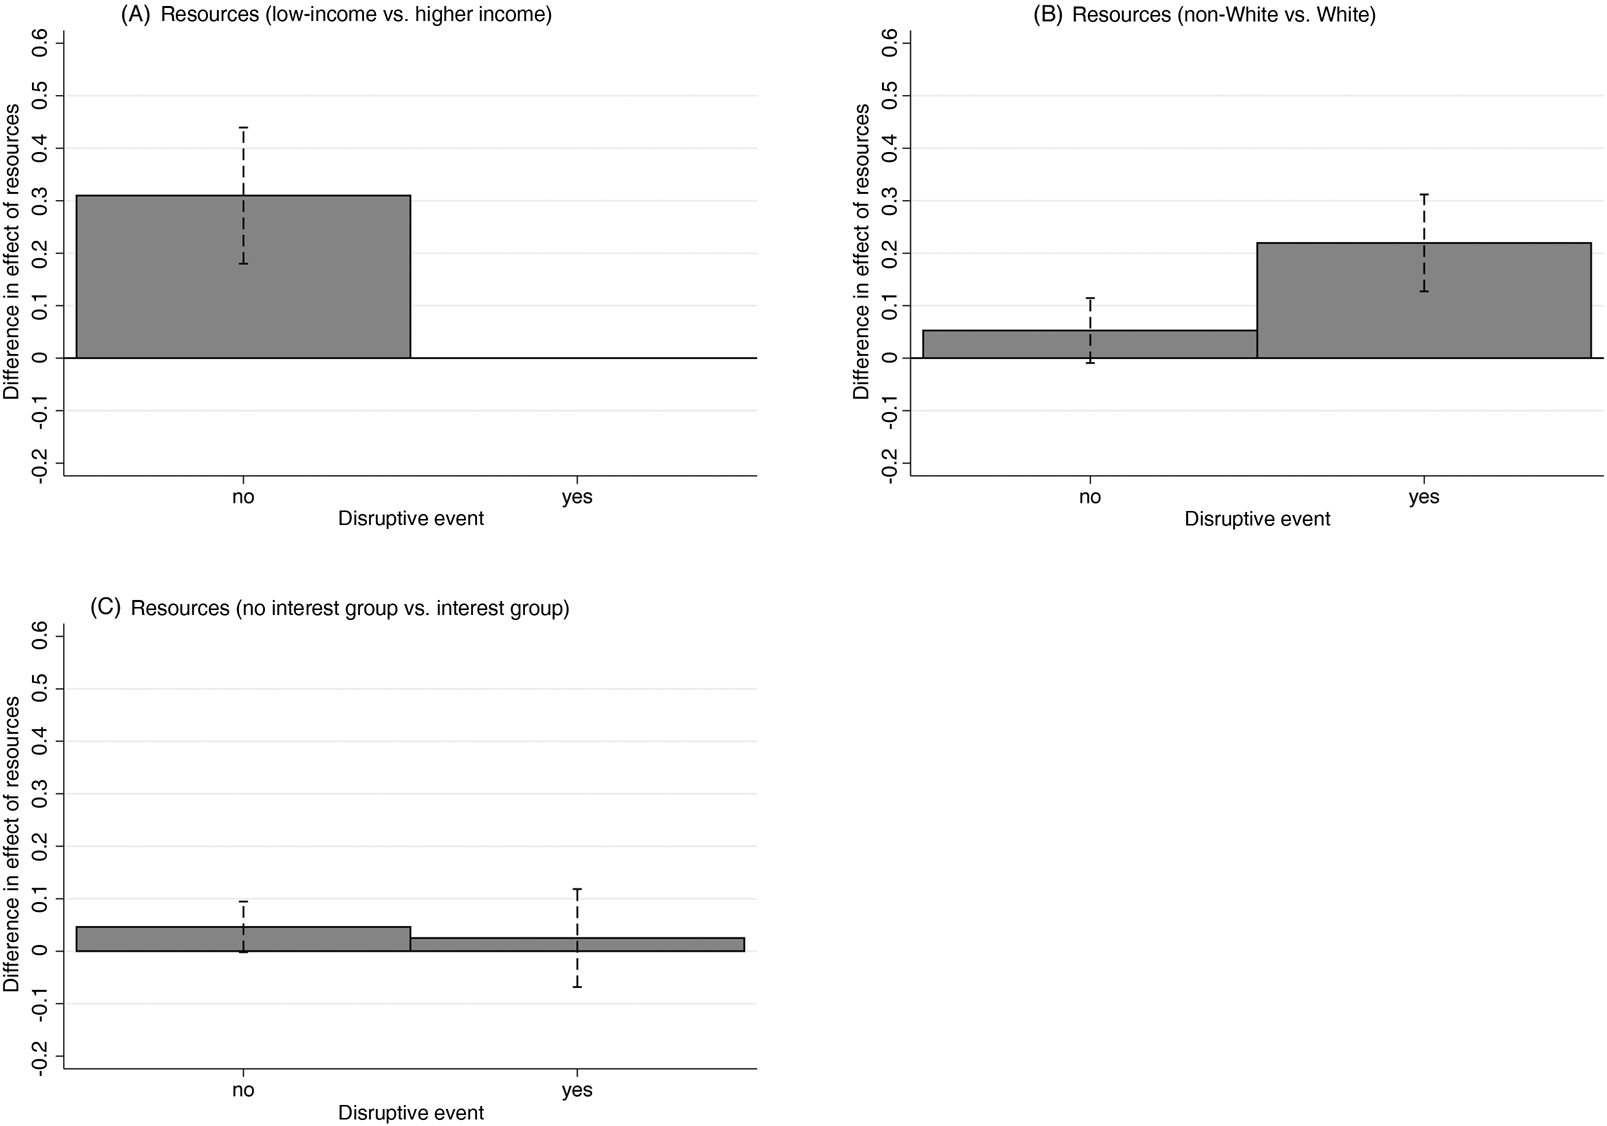
Finally, the disruptive politics literature identifies protests featuring property damage, police, arrest(s), weapons, injury or death as important indicators of salience (Browning, Marshall and Tabb Reference Browning, Marshall and Tabb1984; Lipsky Reference Lipsky1968; Piven and Cloward Reference Piven and Cloward1977). The literature is ambiguous as to whether disruptive collective action increases or decreases support for protesters' interests. Figure 7 suggests legislators are generally more likely to support low-resource groups than high-resource groups following collective action regardless of whether the event is disruptive. The difference in favor of the low-resource groups is statistically significant, except in Figure 7B when an event is not disruptive (p = 0.149) and in Figure 7C, regardless of the event's disruptiveness. Interestingly, when events by racial and ethnic minorities compared to White people are disruptive (Figure 7B), legislative responsiveness in favor of low-resource groups is actually larger than when the events are less contentious. So disruptive events might advantage racial and ethnic minorities.
Resources, salience (disruptiveness) and legislative support
Note: the differences in the predicted probability of legislative support of low- relative to high-resource groups for protests with no (the left bar) or at least one (the right bar) disruptive protest characteristic. All covariates are held at their means.

As a whole, the empirical results suggest that legislators are more likely to support low-resource protesters than their higher-resource counterparts. While statistically significant differences in favor of both low- and high-resource groups emerge when accounting for protest frequency, there are no obvious trends to suggest when a particular protest frequency might alter the likelihood of legislative support. Moreover, the fact that higher-resource groups protest more frequently and are generally less likely to receive legislative support suggests that legislators are indeed interested in issue salience revealed by protesters' resource constraints. For the other salience measures (size, media coverage and disruptiveness), the difference in favor of low-resource groups is not always statistically significant, but in no case is there a statistically significant difference in legislative support in favor of high-resource groups. Additionally, the empirical results suggest that organizational resource capacity may be a less clear indicator of protesters' salience. The difference in legislative support for grassroots vs. formally organized protest is not statistically significant for at least one value in all three analyses of alternative explanations of legislative voting behavior. Despite these idiosyncrasies, the empirical results support the contention that following protest, legislators are generally more likely to support the groups with the most to gain from representation.
Discussion
On 27 September 2015, Senator Elizabeth Warren spoke at the Edward M. Kennedy Institute for the United States Senate. She discussed the pursuit of justice in the 1960s Civil Rights Movement and the recent Black Lives Matter movement:
[T]he civil rights struggle [fought against] oppression wherever it was found – against violence, against the denial of voting rights, and against economic injustice. The battles were bitter and sometimes deadly. Firehoses turned on peaceful protestors. Police officers setting their dogs to attack black students. Bloody Sunday at the Edmund Pettus Bridge […] In the same way that the tools of oppression were woven together, a package of civil rights laws came together to protect black people from violence, to ensure access to the ballot box, and to build economic opportunity. Or to say it another way, these laws made three powerful declarations: Black lives matter. Black citizens matter. Black families matter […] Fifty years later, violence against African Americans has not disappeared […] Peaceful, unarmed protestors have been beaten. Journalists have been jailed. And, in some cities, white vigilantes with weapons freely walk the streets. […] Watch them march through the streets, ‘hands up don't shoot’ – not to incite a riot, but to fight for their lives (Warren Reference Warren2015).
Senator Warren's remarks demonstrate that elected officials both narrowly and broadly connect protesters' claims to legislative behavior. Her comments demonstrate that elected officials recognize the effort and issue salience that some protesters' collective action reveals. Indeed, she explicitly compared costly protest by African Americans to less costly collective action by White vigilantes with her implicit support for the former over the latter.
Conventional and theoretical wisdom would both lead one to believe that racial and ethnic minority and low-income groups are consistently disadvantaged in policy making, and that protest is an ineffective means of gaining representation. This work demonstrates that costly protest, even when disruptive, may lead to legislative support. But while it demonstrates that activism may be effective for disadvantaged communities, it also confirms there are persistent inequalities in representation and the undue burden placed on low-resource groups to receive representation.
For protest to be effective, it must be demanding for participants. Legislative responsiveness to low-resource groups requires constituents to overcome grave obstacles to convey salient concerns. This task is reflected in Senator Warren's remarks, which acknowledge the violence and potential death that Black people face to fight oppression and gain better representation. Still, this study demonstrates that protest, while costly, is likely to benefit the groups most in need of representation.
My formal theory suggests that legislators are generally more likely to support interests articulated during costly protest than in less costly protest or no protest at all, as costlier protest is more likely to signal salient concerns. The empirical analyses corroborate the theoretical results: legislators are more likely to support protesters than non-protesters, and to represent low-income protesters, racial and ethnic minority protesters, and grassroots protests than they are to support their higher-resource counterparts, respectively. These results emerge primarily on protest-related roll-call votes and hold while considering other legislative considerations and various protest characteristics.
Future research could explore other legislative behaviors, like bill sponsorship or speeches, that may evaluate how intensely a legislator supports an issue preference following collective action in their district. Certainly, a yea or nay on a roll-call vote says little about the intensity of a legislator's issue preferences or her prioritization of issues (Hall Reference Hall1996). With a roll-call vote, the level of support from a legislator with intense preferences may appear equivalent to one with only tepid issue preferences. At the same time, a legislator who regularly supports an issue would not appear responsive to protesters because she would have supported the issue even if the protest had not occurred. Furthermore, negative agenda control dictates that political parties will disallow issues on the agenda that will potentially divide or hurt the party (Cox and McCubbins Reference Cox and McCubbins1993). Therefore, issues important to protesters may not be reflected in legislators' roll-call voting behavior because the opportunity to represent constituents' interests does not present itself at that stage. While legislative roll-call votes provide a good test of legislators' strategic responsiveness to protesters, future work could explore how legislators may demonstrate their responsiveness to protesters in other legislative behaviors.
Future research might also explore how these results might hold in other periods. Notably, digital technologies could reduce participation costs by diminishing the necessity for co-presence and group behavior (Earl and Kimport Reference Earl and Kimport2011). On social media, individuals can participate in a viral hashtag movement without incurring many opportunity, economic, physical, social, emotional or legal costs. They can even engage in collective action with low issue salience because of likes, shares, view counts and comments that incentivize participation (Benkler Reference Benkler2006). In this environment, where high issue salience is not necessary for collective action, it may be difficult for a legislator to discern whether a group that is protesting actually cares about the issue it is promoting.
But while digital technologies reduce collective action costs, the accessibility of such technologies is not uniform. White, younger, more financially stable and educated Americans have greater access to the Internet than their lower-resource counterparts (NTIA 2010). Among Internet users, White respondents and people with higher socioeconomic status are more likely to be contacted and more likely to participate than racial and ethnic minorities and lower socioeconomic status respondents, respectively (Best and Krueger Reference Best and Krueger2005; Schlozman, Verba and Brady Reference Schlozman, Verba and Brady2010). Similarly, political operatives continue to be less likely to appeal to low-resource groups (Best and Krueger Reference Best and Krueger2005; Schlozman, Verba and Brady Reference Schlozman, Verba and Brady2010). Thus, in addition to having less access to the benefits of digital technologies for participation, low-resource groups remain outside the predominately White, male and affluent networks of politicians (Carnes Reference Carnes2012).
These findings suggest that while technology may alter the way people protest, things probably have not changed enough to alter many of the circumstances that make legislators more likely to support the concerns raised during protest by low-resource groups relative to high-resource groups. Disparities in resource capacity and representation remain, which makes legislative roll-call voting behavior following protest more likely to support disadvantaged, low-resource groups.
Supplementary material
Online appendices are available at https://doi.org/10.1017/S0007123420000423.
Acknowledgements
I thank Marisa Abrajano, Angie Bautista-Chavez, Vincent Hutchings, Spencer Piston, Nicole Yadon, the editors, and anonymous reviewers for their valuable insights and suggestions.
Data Availability Statement
Replication data available at Gause (2020).