Key points
-
• CoQ10 supplementation consistently raises blood CoQ10 levels but yields small, heterogeneous effects on exercise performance.
-
• Subjective fatigue tended to decrease with supplementation, but findings were inconsistent.
-
• Under chronic supplementation, potential benefits were observed for aerobic endurance exercise and trained individuals, though these results were not consistent across analyses.
-
• No stable dose–response relationships for supplementation duration or consistent improvements in anaerobic or strength outcomes have been demonstrated under chronic supplementation conditions.
-
• Preliminary evidence suggests that daily doses of approximately 90–100 mg may represent a practical starting point for chronic CoQ10 supplementation, though optimal dosing requires further investigation.
While structured training is the primary driver of physiological adaptation, the strategic use of nutritional supplements has gained increasing attention as a means to enhance exercise performance, support recovery and mitigate exercise-induced physiological stress. Among these, coenzyme Q10 (CoQ10) is biologically plausible because it cycles between oxidised (ubiquinone) and reduced (ubiquinol) forms, thereby supporting mitochondrial electron transport(Reference Littarru and Tiano1) and antioxidant defence(Reference Bentinger, Brismar and Dallner2), with high tissue distribution in mitochondria-rich membranes(Reference Crane3,Reference Hargreaves4) . These properties suggest the potential to support energy production and redox balance during exercise, particularly when reactive oxygen species increase with sustained or intense activity(Reference Merry and Ristow5–Reference Reid7).
However, findings from human trials are inconsistent. Some studies have reported benefits for aerobic capacity(Reference Alf, Schmidt and Siebrecht8,Reference Kunching, Nararatwanchai and Chalermchai9) , anaerobic power(Reference Ebrahimi and Ladary10,Reference Mizuno, Tanaka and Nozaki11) and strength(Reference Mohammadi, Naderi and Siavoshi12,Reference Moreno-Fernandez, Puche-Juarez and Toledano13) , while others have found no performance benefits(Reference Bloomer, Canale and McCarthy14–Reference Mieszkowski, Kochanowicz and Brzezińska16). Heterogeneity in design, formulation, dose, duration, participant characteristics and outcome selection likely contributes to these discrepancies.
Prior evidence syntheses offer only partial coverage. Most meta-analyses focused on biomarkers of muscle damage, oxidative stress or inflammation rather than exercise performance(Reference Akbari, Mobini and Agah17–Reference Sedaghat, Samadi and Shirvani20). A 2024 meta-analysis included only eight trials that reported power-based performance outcomes but did not detect clear ergogenic effects(Reference Talebi, Pourgharib Shahi and Zeraattalab-Motlagh21). Other reviews were narrative or athlete-focused(Reference Bian and Wei22–Reference Sarmiento, Diaz-Castro and Pulido-Moran25) and did not provide quantitative estimates or omitted eligible studies(Reference Kunching, Nararatwanchai and Chalermchai9–Reference Moreno-Fernandez, Puche-Juarez and Toledano13,Reference Mieszkowski, Kochanowicz and Brzezińska16,Reference Deichmann, Lavie and Dornelles26–Reference Zhou, Zhang and Davie34) . To date, no analysis has comprehensively quantified CoQ10 effects across multiple performance domains while formally addressing design heterogeneity.
Accordingly, this review synthesises randomised controlled trials in healthy adults to estimate the effects of CoQ10 on exercise performance. Acute and chronic supplementation were compared, and performance outcomes were grouped as aerobic endurance, anaerobic performance, muscular strength and muscular endurance. Subjective fatigue and circulating CoQ10 were evaluated as secondary outcomes to contextualise potential mechanisms. Exploratory analyses examined whether participant and intervention characteristics, including sex, training status, age, formulation, dose and duration, moderated the effects and sought to identify the conditions under which use may be most effective.
Methods
The systematic review adhered to the 2020 Preferred Reporting Items for Systematic Reviews and Meta-Analyses statement(Reference Page, McKenzie and Bossuyt35). The completed Preferred Reporting Items for Systematic Reviews and Meta-Analyses 2020 checklist is available in Electronic Supplementary Material Appendix S1. Additionally, this review protocol was preregistered with the Open Science Framework (registration ID: osf.io/f4y3j) on 27 June 2025. All extracted datasets and R code used for the analyses have also been deposited in the same Open Science Framework project to enhance transparency and reproducibility.
Eligibility criteria
For this systematic review and meta-analysis, studies were included if they met the following inclusion criteria: (1) randomised controlled trials published as full-text articles in peer-reviewed journals; (2) investigated the effects of CoQ10 supplementation; (3) included at least one measure of exercise performance derived from a structured exercise test; (4) involved original research on human subjects and (5) included healthy adults participants without known clinical conditions (≥ 18 years of age). Studies were excluded if they met any of the following criteria: (1) CoQ10 was co-administered with other active substances exclusively in the experimental group; (2) the experimental group underwent additional exercise training not equally applied to the control group; (3) animal or in vitro studies; (4) no exercise performance outcomes reported; (5) not original research articles (e.g. reviews, trial protocols and conference abstracts); (6) not published in English; or (7) lacked sufficient methodological detail to assess eligibility.
Data sources and search
We searched the Cochrane Library, PubMed, SciELO, SPORTDiscus-EBSCO and Web of Science database using the following terms: concept 1 (‘Coenzyme Q10’ OR ‘CoQ10’ OR ‘Co-Q10’ OR ‘Ubiquinone’ OR ‘Ubiquinol’ OR ‘ubidecarenone’ OR ‘Coenzyme Q-10’) and concept 2 (‘exercise’ OR ‘physical performance’ OR ‘aerobic capacity’ OR ‘aerobic exercise’ OR ‘anaerobic exercise’ OR ‘endurance’ OR ‘fatigue’ OR ‘training’ OR ‘maximal oxygen uptake’ OR ‘VO2max’ OR ‘sports performance’ OR ‘muscle function’). Searches were conducted on 1 June 2025 and updated on 12 November 2025, with no restrictions on publication year or language and no additional filters applied.
We did not search trial registries (e.g. ClinicalTrials.gov/WHO ICTRP), grey literature or preprints. This decision was made a priori to reduce the risk of including unverified, duplicate or non-peer-reviewed data and to ensure that all evidence used for quantitative synthesis was traceable to peer-reviewed randomised controlled trials with stable methods and outcomes.
Data extraction
All retrieved titles and abstracts were downloaded into Microsoft Excel spreadsheets and EndNote(Reference Talebi, Pourgharib Shahi and Zeraattalab-Motlagh21) and manually cross-referenced to identify duplicates. Article screening was performed independently by two researchers (D.H.Z and S.T.Y), and discrepancies were resolved by consensus.
Data extracted including:
-
1) Study characteristics: authors, publication year and study design (parallel or crossover).
-
2) Participant characteristics: sample size, sex, age, training status and health status.
-
3) Intervention characteristics: type of CoQ10 (ubiquinone or ubiquinol), dosage, supplementation duration and timing relative to exercise.
-
4) Exercise testing protocols.
-
5) Primary outcomes related to exercise performance: VO₂max or VO₂peak, time to exhaustion, anaerobic power (e.g. peak or mean power), muscular strength (e.g. 1RM, bench press), muscular endurance (e.g. push-up test, reps to failure) and sport-specific performance tests (e.g. sprint time, jump height and agility tests).
-
6) Secondary outcomes: self-reported fatigue scores, including Rating of Perceived Exertion, Visual Analog Scale for fatigue and other validated fatigue questionnaires and circulating CoQ10 concentrations.
If the data of interest were not reported in the study, we sent an email to the corresponding author to request the data. For studies that did not receive a response, we used the WebPlotDigitizer program (https://apps.automeris.io/wpd/) to extract the data of interest from the original figures reported in the paper(Reference Premaratne, Newman and Hobbs36). It is worth noting that one study exhibited a slight discrepancy in the reported image data(Reference Gökbel, Gül and Belviranl37). As no response was received from the corresponding author after inquiry, the relevant data from a previous meta-analysis were adopted as a reference(Reference Talebi, Pourgharib Shahi and Zeraattalab-Motlagh21).
Quality and risk of bias assessment
The quality of the articles was assessed using the Physiotherapy Evidence Database (PEDro) scale. Given the specific features of nutritional supplementation trials, we adopted a previously recommended modification(Reference Grgic38), adding an item on the effectiveness of placebo blinding: ‘Did the study assess the effectiveness of placebo blinding?’ This addition was intended to capture risks arising when taste, smell or capsule appearance may compromise allocation masking in supplement studies. As item 1 was not scored, the total score ranged from 0 to 11. Articles with a total score of 10–11 were rated as excellent, 7–9 as good, 5–6 as fair and articles with less than five points were rated as poor methodological quality. PEDro scoring was performed at the study level, as it reflects overall methodological rigour rather than outcome-specific sources of bias.
In parallel, risk of bias was assessed using the Cochrane Collaboration Risk of Bias Tool 2 (RoB-2)(Reference Sterne, Savović and Page39), which evaluates five domains: (i) bias arising from the randomisation process; (ii) bias due to deviations from intended interventions; (iii) bias due to missing outcome data; (iv) bias in measurement of the outcome and (v) bias in selection of the reported result.
Both assessments were conducted independently by two authors (D.H.Z. and S.T.Y.), with disagreements resolved through discussion. RoB-2 was assessed separately for each outcome category (exercise performance, subjective fatigue and blood CoQ10 concentration) because multiple outcomes were often reported within the same trials and outcome-specific issues can differ. For subgroup analyses within exercise performance (e.g. by exercise type age or sex), the same RoB-2 ratings were applied across subgroups because these subgroup divisions originated from the same trials and thus shared identical study-level design and implementation features relevant to risk of bias. This approach maintains methodological consistency and prevents artificial inflation of precision that could arise from redundant re-ratings of the same studies. It also ensures that the risk-of-bias assessment can directly inform outcome-specific downgrading decisions regarding certainty of evidence.
The modified PEDro scale and RoB-2 were used complementarily: PEDro provided a quantitative index of overall methodological quality, whereas RoB-2 offered a domain-specific appraisal of internal validity at the outcome level. Inter-rater reliability was quantified at two levels. For item-level agreement, we used Cohen’s kappa(Reference Cohen40) for binary PEDro items and weighted kappa for the three-category RoB-2 ratings(Reference Landis and Koch41). Alongside kappa statistics, we calculated raw percentage agreement for all categorical items as a direct measure of consensus. A value of ≥ 80 % was considered to indicate acceptable inter-rater reliability(Reference McHugh42). For the PEDro total score, which is continuous, we used the intraclass correlation coefficient(Reference Shrout and Fleiss43). Kappa values were interpreted using conventional thresholds (< 0·20 = slight, 0·21–0·40 = fair, 0·41–0·60 = moderate, 0·61–0·80 = substantial and > 0·80 = almost perfect)(Reference Landis and Koch41), and intraclass correlation coefficient values were interpreted as < 0·50 = poor, 0·50–0·75 = moderate, 0·75–0·90 = good and > 0·90 = excellent(Reference Koo and Li44). The corresponding reliability statistics, including raw agreement percentages, are presented together with the quality assessment results.
Statistical analysis
Data extraction, synthesis and effect measures
In this study, the effects of CoQ10 supplementation on the primary outcome of exercise performance and secondary outcomes of subjective fatigue and blood CoQ10 concentrations were analysed by comparing between-group differences (CoQ10 v. placebo) or within-group pre–post changes in the CoQ10 supplementation arm. All effect size calculations followed the Cochrane Handbook for Systematic Reviews of Interventions (Version 6.5, 2024)(Reference Higgins, Thomas and Chandler45).
Given the generally small samples of included studies, effects were expressed as standardised mean differences (Hedges’ g) with small-sample correction(Reference Hedges46). When studies reported pre- and post-values, we derived g from change scores. When only post-intervention values were available, we used between-group differences for parallel trials and paired differences for crossover trials, while preserving within-subject dependency(Reference Cumpston, Li and Page47,Reference Hedges, Shymansky and Woodworth48) .
Many trials did not report the required correlations. In the primary analyses, we assumed r = 0·50 and applied this consistently to all pre–post and within-person calculations for both parallel and crossover designs to ensure comparability(Reference Cumpston, Li and Page47).
Effect sizes were interpreted using standard thresholds: trivial (< 0·20), small (0·20–0·49), medium (0·50–0·79) and large (≥ 0·80)(Reference Cohen49).
For subjective fatigue and blood CoQ10 concentrations, data extraction and synthesis followed the same approach as for performance outcomes, using between-group differences in change scores as the primary effect measure. Given the expected physiological stability of blood CoQ10 in placebo groups, within-group changes in the CoQ10 supplementation arm were also analysed as supplementary sensitivity analyses (online Supplementary Appendix S2).
Detailed computational formulas and step-by-step procedures are provided in online Supplementary Appendix S3.
Meta-analysis and heterogeneity
We conducted a three-level meta-analysis following the framework of Assink & Wibbelink (2016) methods and recommendations(Reference Assink and Wibbelink50) to account for dependent effect sizes within studies(Reference Kadlec, Sainani and Nimphius51,Reference Van den Noortgate, López-López and Marín-Martínez52) . This approach partitions total variance into sampling (level 1), within-study (level 2) and between-study (level 3) components, thereby preserving multiple correlated outcomes without double counting(Reference Cheung53). Model parameters were estimated using restricted maximum likelihood and cross-checked with maximum likelihood to ensure stability.
Because the primary aim of this meta-analysis was to evaluate the effects of CoQ10 supplementation on objective exercise performance, we only included studies that reported at least one physical performance outcome (e.g. aerobic capacity and muscular strength). Although subjective fatigue measures and blood CoQ10 concentration were extracted and analysed as secondary outcomes when available in the included studies, trials that exclusively assessed perceived fatigue and/or blood CoQ10 concentration without accompanying performance data were excluded to maintain consistency with the primary research objective.
Tests of model coefficients and corresponding CI were based on the t-distribution(Reference Jukic, Castilla and Ramos54). Prediction intervals (PI) were also computed to characterise expected variation in future studies(Reference Borg, Impellizzeri and Borg55,Reference IntHout, Ioannidis and Rovers56) . For heterogeneity, we used the most widely recommended and commonly reported metric, I2, to assess and report(Reference Assink and Wibbelink50,Reference Nakagawa, Noble and Senior57) . 0 % to 25 % (low heterogeneity), 25 % to 50 % (moderate heterogeneity), 50 % to 75 % (high heterogeneity) and 75 % to 100 % (fairly high heterogeneity)(Reference Cumpston, Li and Page47). To assess the adequacy of statistical power to detect true effects and the possibility of type II errors due to insufficient power, we performed power analyses for both primary and secondary outcomes using the metameta package(Reference Quintana58).
Moderators and subgroup analysis
To explore sources of heterogeneity, moderator and meta-regression analyses were conducted for both categorical and continuous variables(Reference Hopkins59). Typically, at least ten studies are required for each meta-regression and at least five studies are required for each subgroup to ensure adequate statistical power(Reference Deeks, Higgins, Altman, Higgins, Thomas and Chandler60,Reference Ruppar61) . The metameta package was also used to perform power analysis for each subgroup(Reference Quintana58).
To determine whether acute (single dose) v. chronic (≥ 1 week) supplementation significantly moderated the overall effect, we performed an initial subgroup analysis comparing these two protocols within the complete dataset. Given the distinct pharmacokinetic profiles of acute and chronic dosing and the predominance of chronic protocols in the available literature, all subsequent moderator and subgroup analyses were restricted to chronic studies. The moderators examined included (1) sex; (2) training status; (3) age; (4) CoQ10 type; (5) exercise category; (6) CoQ10 dosage and (7) supplementation duration.
For age-based subgroup analysis, participants were categorised as young adults (18–35 years), middle-aged adults (36–59 years) and older adults (≥ 60 years). This classification was informed by mean age ranges commonly reported in the literature and reflects physiologically distinct life stages, particularly in relation to baseline CoQ10 status, mitochondrial function and susceptibility to oxidative stress. These age-related differences may influence both the absorption and biological efficacy of CoQ10 supplementation, justifying stratified analysis across age groups (The details were discussed in section 4.4). Based on previous participant categorisation frameworks, participants were classified as untrained and trained (recreationally active, trained/developmental, well-trained/national level, elite/international level and world-class)(Reference McKay, Stellingwerff and Smith62). For consistency, studies explicitly reporting the oxidised form were classified as ubiquinone, whereas those reporting the reduced form were classified as ubiquinol. Trials that did not specify formulation were labelled as unspecified CoQ10.
To better explore the potential ergogenic effects of CoQ10 and to reduce the instability of the computational model due to the small sample size, performance outcomes were grouped into four physiological domains based on the primary potential energy system or neuromuscular mechanism(Reference McArdle, Katch and Katch63,Reference Riebe, Ehrman and Liguori64) : (1) Strength/Power: Efforts lasting ≤ 10 s, characterised by maximal intensity and primarily relying on the ATP–phosphocreatine system (e.g. vertical jump height, 1–3 RM lifts and maximal short sprints); (2) Anaerobic Performance: Continuous efforts lasting > 10 s and ≤ 60 s, predominantly dependent on anaerobic glycolysis (e.g. 30-s Wingate test and repeated sprint ability); (3) Muscular Endurance: Sustained submaximal contractions performed to volitional exhaustion or failure, typically involving repeated or continuous efforts targeting a specific muscle group, and generally lasting from ∼30 s to several minutes depending on protocol (e.g. bench press to failure at submaximal load, repeated knee extensions to exhaustion) and (4) Aerobic Endurance: Continuous efforts exceeding ∼2–3 min (typically > 10 min) where oxidative metabolism provides the predominant energy supply, even when significant anaerobic contributions occur in early phases (e.g. 3-min all-out test, VO2max ramp protocols and time to exhaustion treadmill tests).
To assess the relationship shapes of continuous variables analysis (CoQ10 dosage and supplementation duration), we attempted to fit a linear, quadratic or cubic function and compared the models, selecting the model with the lowest bias-corrected Akaike information criterion(Reference Harrell and Harrell Jr Frank65,Reference Zuur, Ieno and Walker66) . Additionally, to account for varied supplementation protocols across studies and enhance analysis precision, supplementation duration was standardised to weeks rather than days for meta-regression analysis, allowing for more meaningful dose–response relationship assessment across the included studies.
All regression models were performed using the metafor package and later visualised with the ggplot2 and orchaRd packages(Reference Wickham67).
Risk of publication bias and sensitivity analysis
The contour-enhanced funnel plot(Reference Peters, Sutton and Jones68), along with Egger’s asymmetry test(Reference Egger, Smith and Schneider69,Reference Fernández-Castilla, Declercq and Jamshidi70) , was employed to assess publication bias (tests were only conducted when k ≥ 10)(Reference Sterne, Sutton and Ioannidis71), with P > 0·05 indicating no risk of publication bias. Funnel plot symmetry was evaluated through both visual inspection and Egger’s test, allowing for a combined subjective and statistical assessment of potential small-study effects and publication bias.
As the main analyses were based on a three-level meta-analytic framework, some existing bias-correction methods (e.g. trim-and-fill, selection models and PET–PEESE) cannot be directly implemented within this structure. Nevertheless, for categories in which publication bias was detected in the three-level analyses, we additionally applied trim-and-fill method under a conventional two-level random-effects model (each study contributing one independent effect size) to conduct a sensitivity analysis(Reference Duval and Tweedie72). The adjusted pooled effect sizes were compared with the original estimates to evaluate the robustness of the findings.
Sensitivity analyses included (1) varying assumed correlation coefficients (r): a relatively low value (r = 0·2) and a relatively high value (r = 0·8)(Reference Deng, Song and Yin73); (2) leave-one-out analyses; (3) exclusion of outliers identified via Cook’s distance, hat values (exceeded three times their respective means) and studentised residuals (the absolute value exceeded (3)(Reference Atkinson, Cook and Weisberg74,Reference Viechtbauer and Cheung75) ; and (4) exclusion of digitised or borrowed values. Among these, outlier exclusion was applied not only to the overall models but also across all moderator and meta-regression analyses to ensure robustness of subgroup inferences, whereas the remaining sensitivity checks were conducted for the primary pooled effects.
Certainty of the evidence
Certainty of the evidence was evaluated using the Grading of Recommendations Assessment, Development, and Evaluation (GRADE) approach, which classifies evidence as ‘high’, ‘moderate’, ‘low’ or ‘very low’(Reference Schünemann, Higgins, Vist, Higgins, Thomas and Chandler76). Risk-of-bias ratings from the RoB-2 assessment directly informed the GRADE downgrading decisions, alongside considerations of inconsistency, indirectness, imprecision and publication bias (online Supplementary Appendix S4). GRADE assessments were independently conducted by one reviewer (D.H.Z) and verified by a second (F.X.H).
Results
Studies retrieved
The initial search yielded 2871 publications: 2821 from the primary database search and fifty from an updated search conducted 5 months later. After title/abstract and full-text screening, twenty-four studies were included in the meta-analysis, resulting in a total of 131 effect sizes (k = 131) as some studies contributed multiple outcomes. A summary of the search process is shown in Figure 1.
PRISMA flow diagram for included and excluded studies. Notes: Flow of records through identification, screening, eligibility and inclusion for the review and meta-analysis. Boxes report numbers at each stage and main reasons for exclusion at full-text screening. Searches were conducted on 1 June 2025 and updated on 12 November 2025. PRISMA, Preferred Reporting Items for Systematic Reviews and Meta-Analyses.

Figure 1 Long description
The flowchart illustrates the process of identifying, screening, assessing eligibility, and including studies for a review and meta-analysis. It begins with the identification of studies via databases and registers, with searches conducted on June 1, 2025, and updated on November 12, 2025. Records are identified from various sources including Cochrane Library, PubMed, SciELO, SportsDiscus, Web of Science, and Embase. The records are then screened, duplicates are removed, and reports are sought for retrieval. Records are excluded by title or abstract, and reports are assessed for eligibility. The flowchart details the number of records at each stage and the main reasons for exclusion at full-text screening. The final step shows the total number of studies included in the review.
Characteristics of included studies
Most of the included studies involved long-term interventions, during which participant withdrawal was reported. The effective sample size per study ranged from six to ninety-eight participants, yielding a total pooled sample of 641 individuals (n 641). Of these, 418 were male and 66 were female. However, the gender of 157 participants could not be determined due to incomplete reporting in some studies(Reference Alf, Schmidt and Siebrecht8,Reference Cooke, Iosia and Buford15,Reference Ylikoski, Piirainen and Hanninen33) . One study did not report the age of the participants(Reference Ylikoski, Piirainen and Hanninen33), and the mean age of the participants in the remaining studies ranged from 18 to 63·8. Furthermore, fourteen studies recruited trained participants, nine studies recruited untrained participants and one study recruited both trained and untrained participants(Reference Cooke, Iosia and Buford15).
Of the twenty-four studies included in the meta-analysis, twenty two investigated the effects of long-term CoQ10 supplementation, three employed acute supplementation protocols and one examined both acute and long-term administration(Reference Cooke, Iosia and Buford15). With respect to the formulation of CoQ10, seven studies utilised the reduced form (ubiquinol), five employed the oxidised form (ubiquinone), and the remaining twelve did not specify the chemical form; these were thus classified as CoQ10 of unspecified formulation.
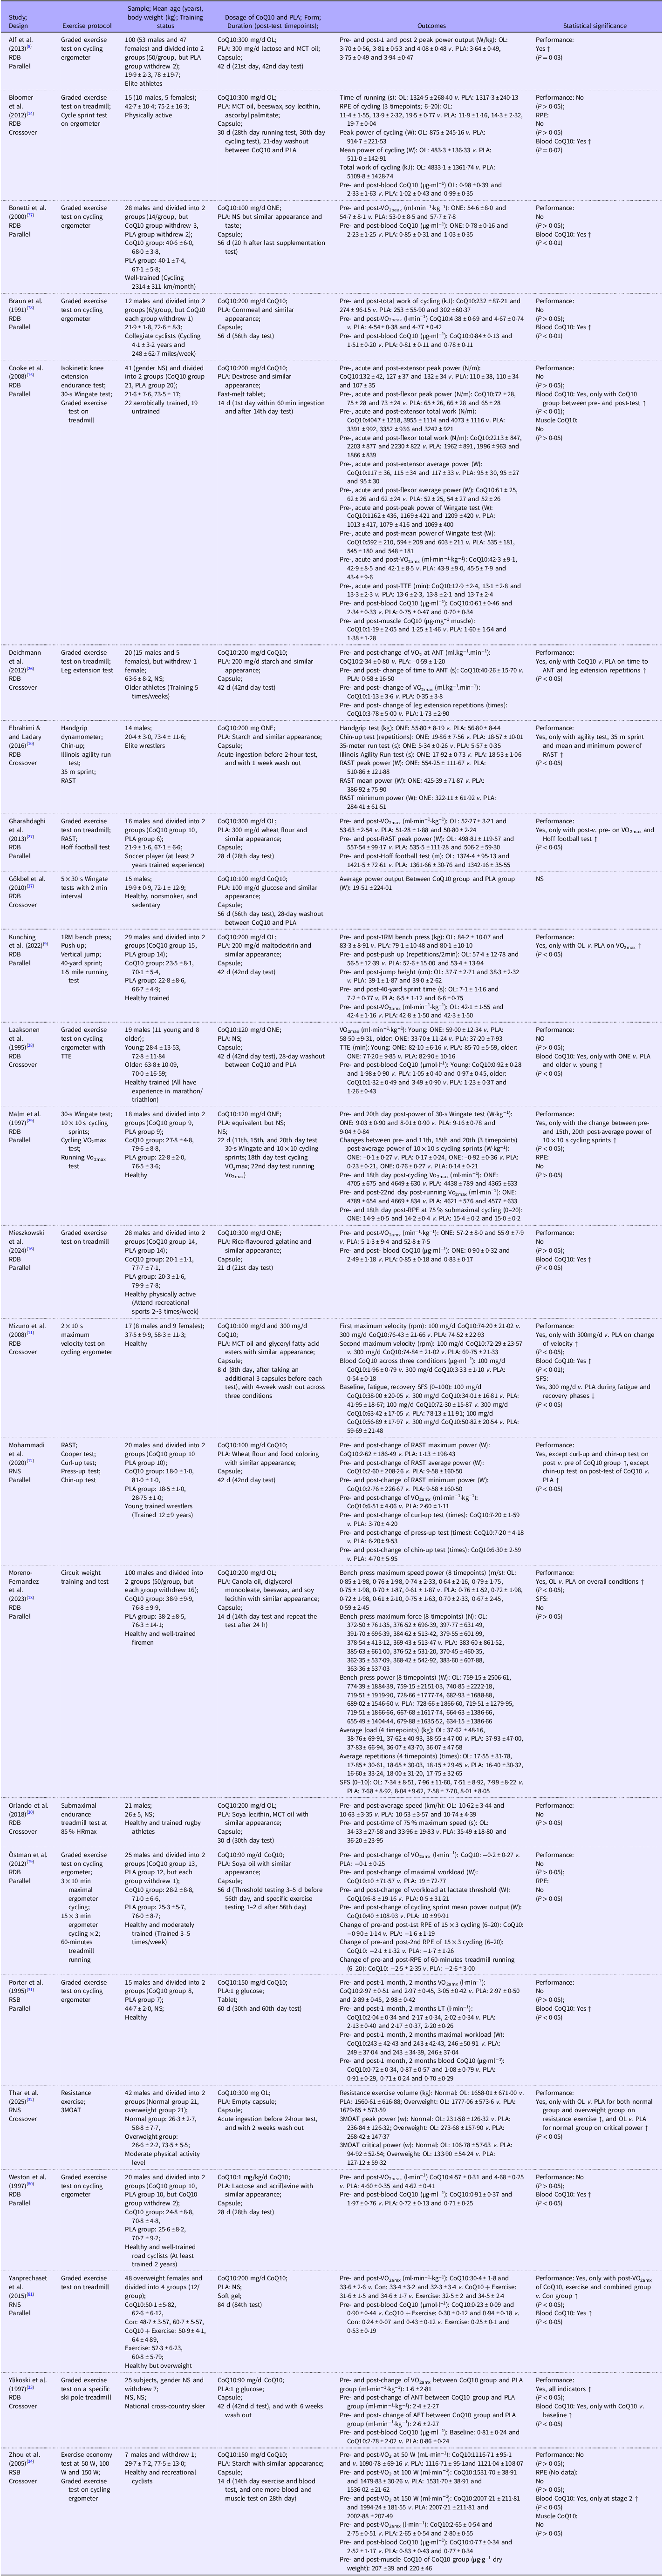
Furthermore, five studies evaluated subjective fatigue as an outcome measure, while thirteen reported changes of blood CoQ10 concentrations. A detailed summary of study characteristics is provided in Table 1.
Summary and results of the studies reviewed assessing the effect of coenzyme Q10 supplementation on exercise performance

Table 1 Long description
Table summarizing studies on coenzyme Q10 supplementation and exercise performance. The table includes 18 rows and 10 columns. Column headers are Study, Population, Sample size, Age, Intervention, Control, Outcome measures, Results, and Notes. Row 1: Study, Author A et al; Population, Athletes; Sample size, 30; Age, 25-35 years; Intervention, 300 milligrams per day CoQ10; Control, Placebo; Outcome measures, Exercise performance, Fatigue; Results, Improved performance, Reduced fatigue; Notes, Double-blind, Randomized. Row 2: Study, Author B et al; Population, Sedentary adults; Sample size, 45; Age, 40-50 years; Intervention, 200 milligrams per day CoQ10; Control, Placebo; Outcome measures, Aerobic capacity, Fatigue; Results, No significant change, Reduced fatigue; Notes, Double-blind, Randomized. Row 3: Study, Author C et al; Population, Elderly; Sample size, 25; Age, 65-75 years; Intervention, 150 milligrams per day CoQ10; Control, Placebo; Outcome measures, Muscle strength, Endurance; Results, Improved strength, Improved endurance; Notes, Double-blind, Randomized. Row 4: Study, Author D et al; Population, Heart failure patients; Sample size, 50; Age, 50-60 years; Intervention, 300 milligrams per day CoQ10; Control, Placebo; Outcome measures, Exercise capacity, Fatigue; Results, Improved capacity, Reduced fatigue; Notes, Double-blind, Randomized. Row 5: Study, Author E et al; Population, Healthy adults; Sample size, 35; Age, 30-40 years; Intervention, 200 milligrams per day CoQ10; Control, Placebo; Outcome measures, Aerobic performance, Fatigue; Results, Improved performance, Reduced fatigue; Notes, Double-blind, Randomized. Row 6: Study, Author F et al; Population, Diabetes patients; Sample size, 40; Age, 45-55 years; Intervention, 150 milligrams per day CoQ10; Control, Placebo; Outcome measures, Exercise performance, Fatigue; Results, No significant change, Reduced fatigue; Notes, Double-blind, Randomized. Row 7: Study, Author G et al; Population, Healthy adults; Sample size, 28; Age, 25-35 years; Intervention, 300 milligrams per day CoQ10; Control, Placebo; Outcome measures, Muscle strength, Endurance; Results, Improved strength, Improved endurance; Notes, Double-blind, Randomized. Row 8: Study, Author H et al; Population, Athletes; Sample size, 30; Age, 20-30 years; Intervention, 200 milligrams per day CoQ10; Control, Placebo; Outcome measures, Exercise performance, Fatigue; Results, Improved performance, Reduced fatigue; Notes, Double-blind, Randomized. Row 9: Study, Author I et al; Population, Sedentary adults; Sample size, 45; Age, 35-45 years; Intervention, 150 milligrams per day CoQ10; Control, Placebo; Outcome measures, Aerobic capacity, Fatigue; Results, No significant change, Reduced fatigue; Notes, Double-blind, Randomized. Row 10: Study, Author J et al; Population, Elderly; Sample size, 25; Age, 70-80 years; Intervention, 300 milligrams per day CoQ10; Control, Placebo; Outcome measures, Muscle strength, Endurance; Results, Improved strength, Improved endurance; Notes, Double-blind, Randomized. Row 11: Study, Author K et al; Population, Heart failure patients; Sample size, 50; Age, 55-65 years; Intervention, 200 milligrams per day CoQ10; Control, Placebo; Outcome measures, Exercise capacity, Fatigue; Results, Improved capacity, Reduced fatigue; Notes, Double-blind, Randomized. Row 12: Study, Author L et al; Population, Healthy adults; Sample size, 35; Age, 35-45 years; Intervention, 300 milligrams per day CoQ10; Control, Placebo; Outcome measures, Aerobic performance, Fatigue; Results, Improved performance, Reduced fatigue; Notes, Double-blind, Randomized. Row 13: Study, Author M et al; Population, Diabetes patients; Sample size, 40; Age, 50-60 years; Intervention, 150 milligrams per day CoQ10; Control, Placebo; Outcome measures, Exercise performance, Fatigue; Results, No significant change, Reduced fatigue; Notes, Double-blind, Randomized. Row 14: Study, Author N et al; Population, Healthy adults; Sample size, 28; Age, 25-35 years; Intervention, 200 milligrams per day CoQ10; Control, Placebo; Outcome measures, Muscle strength, Endurance; Results, Improved strength, Improved endurance; Notes, Double-blind, Randomized. Row 15: Study, Author O et al; Population, Athletes; Sample size, 30; Age, 20-30 years; Intervention, 300 milligrams per day CoQ10; Control, Placebo; Outcome measures, Exercise performance, Fatigue; Results, Improved performance, Reduced fatigue; Notes, Double-blind, Randomized. Row 16: Study, Author P et al; Population, Sedentary adults; Sample size, 45; Age, 40-50 years; Intervention, 150 milligrams per day CoQ10; Control, Placebo; Outcome measures, Aerobic capacity, Fatigue; Results, No significant change, Reduced fatigue; Notes, Double-blind, Randomized. Row 17: Study, Author Q et al; Population, Elderly; Sample size, 25; Age, 65-75 years; Intervention, 200 milligrams per day CoQ10; Control, Placebo; Outcome measures, Muscle strength, Endurance; Results, Improved strength, Improved endurance; Notes, Double-blind, Randomized. Row 18: Study, Author R et al; Population, Heart failure patients; Sample size, 50; Age, 50-60 years; Intervention, 300 milligrams per day CoQ10; Control, Placebo; Outcome measures, Exercise capacity, Fatigue; Results, Improved capacity, Reduced fatigue; Notes, Double-blind, Randomized.
AET, aerobic threshold; ANT, anaerobic threshold; CoQ10, coenzyme Q10; Con, control group; g, grams; kg, kilogram; LT, lactate threshold; L, liter; MCT: medium-chain triacylglycerol; min, minutes; NS, not specified; ONE, ubiquinone; OL, ubiquinol; PLA, placebo; RDB, randomised double-blind trial; RSB, randomised single-blind trial; RPE, rating of perceived exertion; s, seconds; SFS, subjective fatigue sensation; RAST, running-based anaerobic sprint test; TTE, time to exhaustion; h, hour; μg·ml–1, microgram/ milliliter; W, watt; 3MAOT, three-minute all-out test; ↑, represents significantly improved; ↓, represents significantly decreased.
Primary analysis
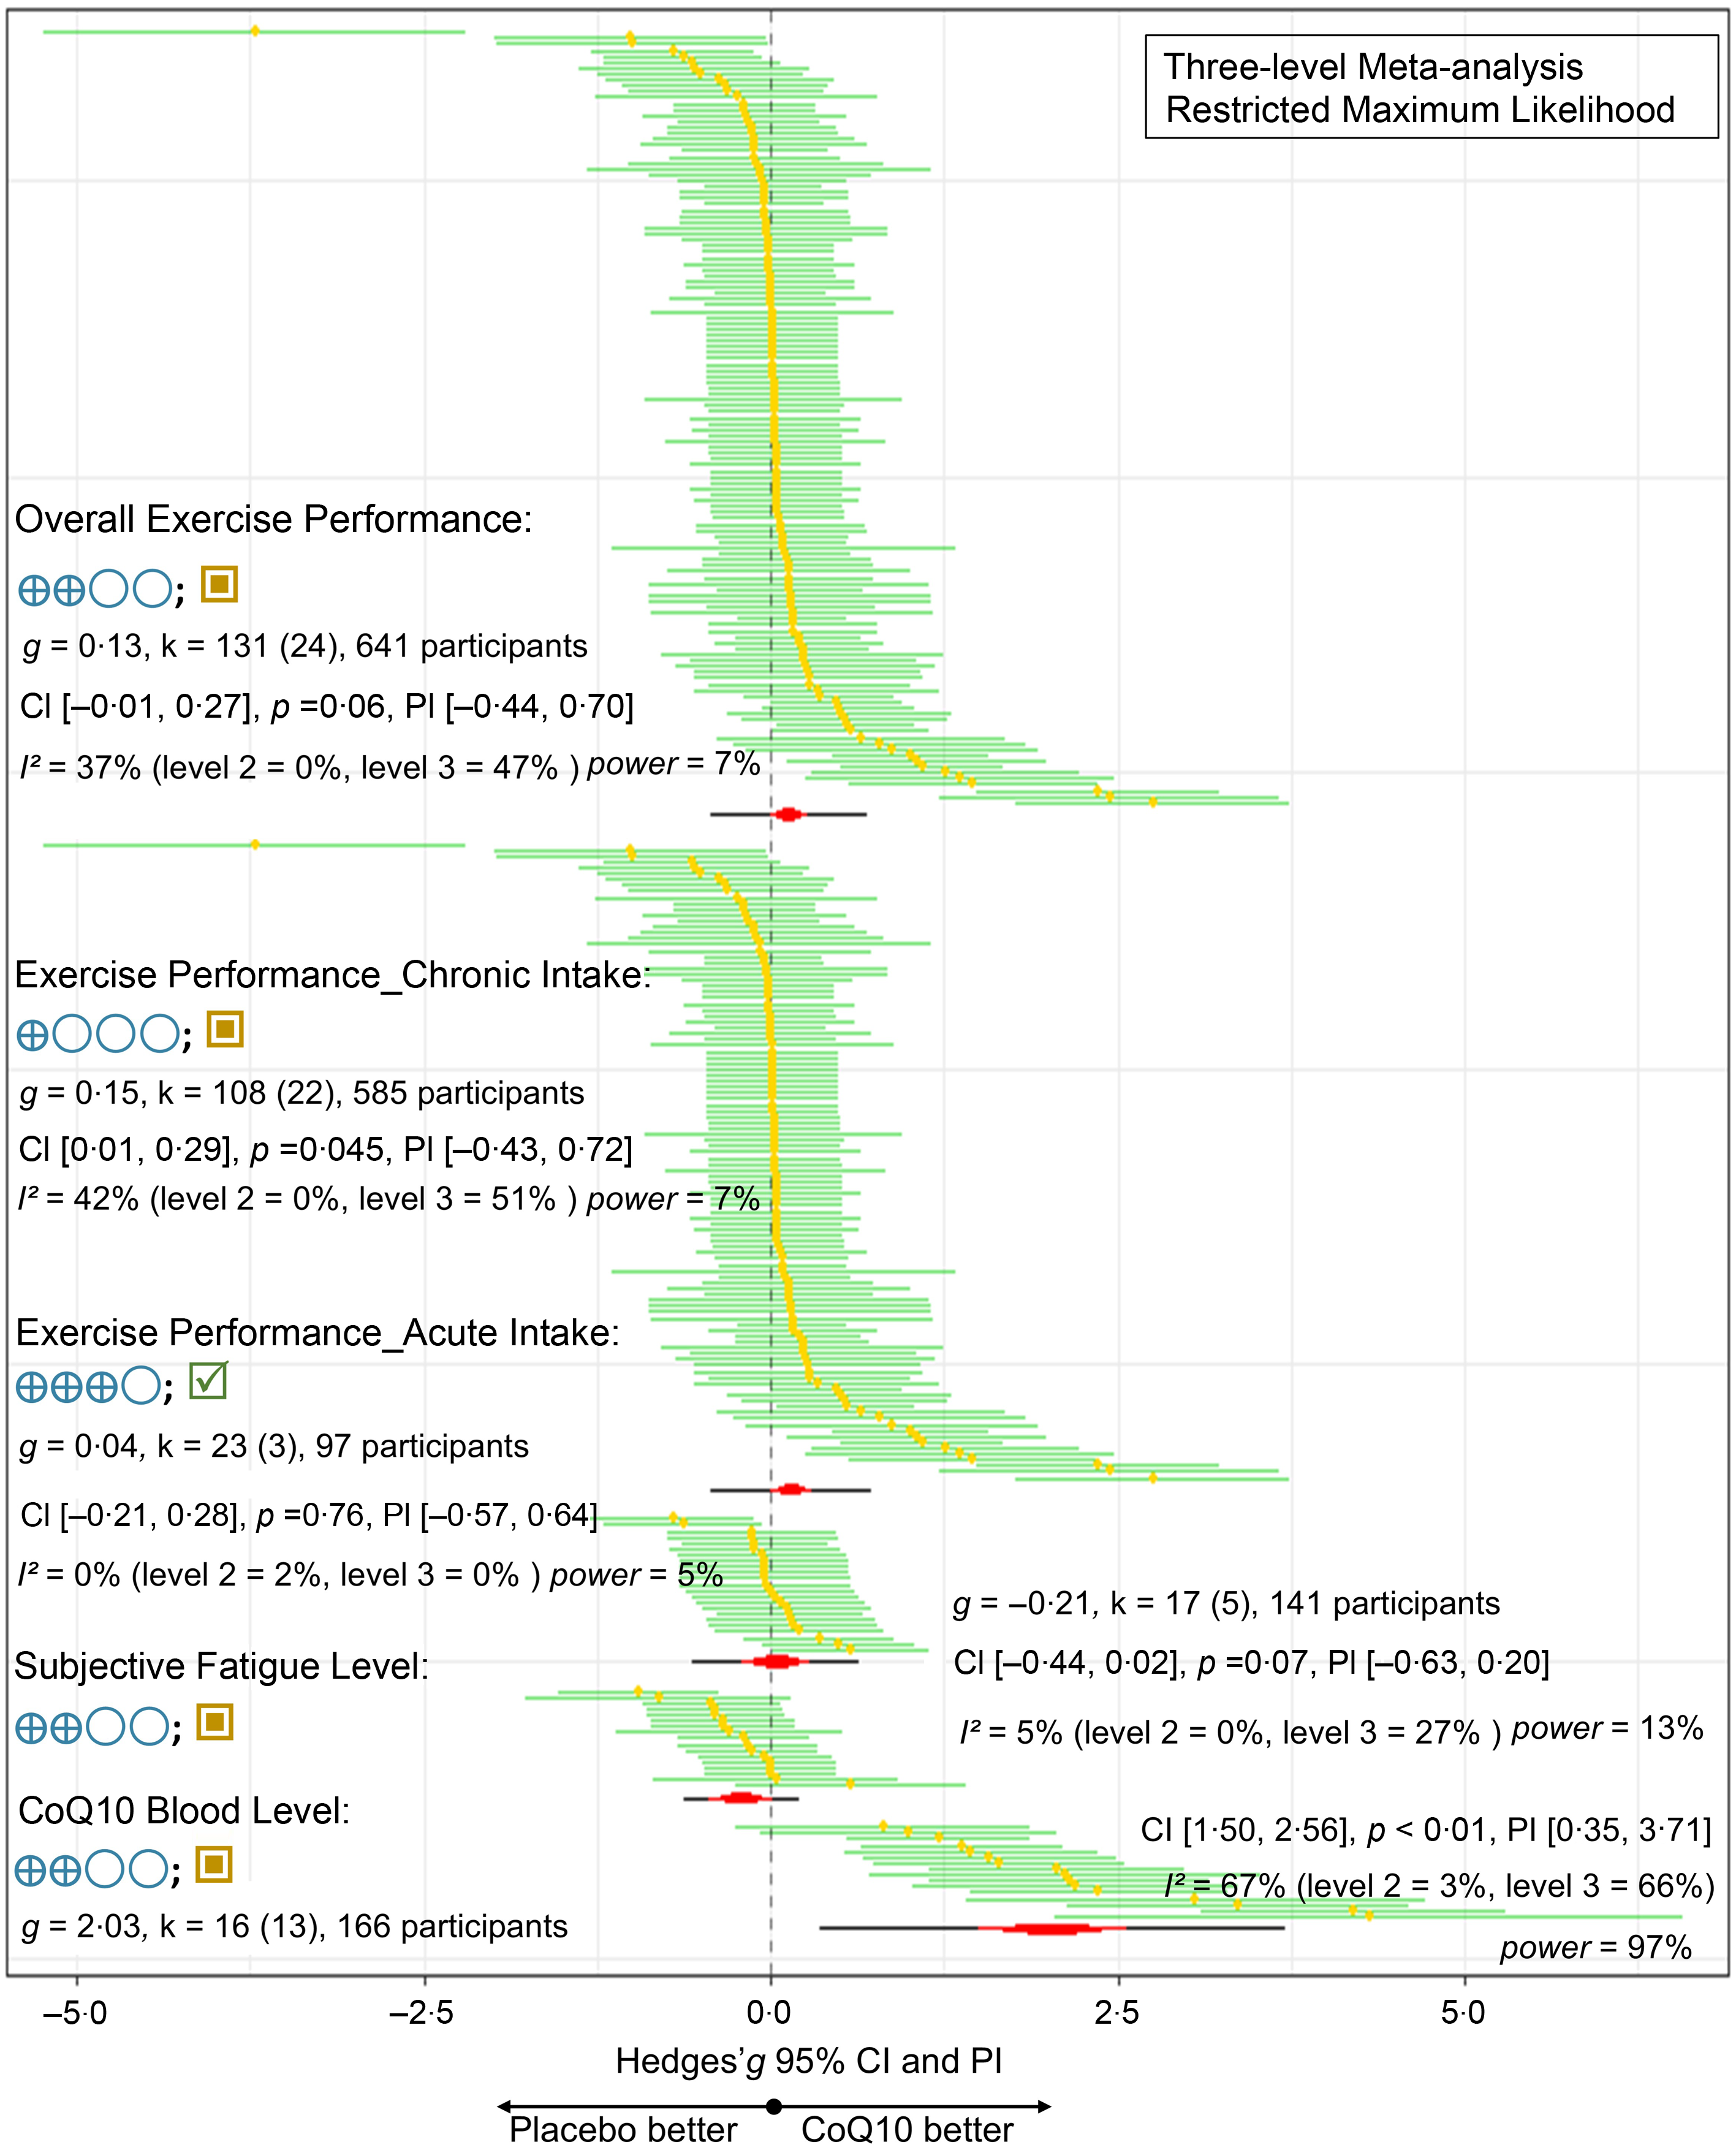
For overall exercise performance (k = 131; n 641), CoQ10 supplementation yielded a small, unstable improvement (Hedges’ g = 0·13; 95 % CI: (–0·01, 0·27); P = 0·06; low GRADE), suggesting limited practical benefit when all protocols are combined. Moderate heterogeneity (I2 = 37 %, primarily at level 3 = 47 %) and low statistical power (7 %) further indicate inconsistent effects across studies.
When stratified by intake duration, chronic supplementation (k = 108; n 585) demonstrated a statistically significant small effect (g = 0·15; 95 % CI: (0·01, 0·29); PI: (–0·43, 0·72); P = 0·045; I 2 = 42 %; Low GRADE), while acute supplementation (k = 23; n 97) produced a negligible and non-significant effect (g = 0·04; 95 % CI: (–0·21, 0·28); P = 0·76; I 2 = 0; Moderate GRADE). This suggests that CoQ10 may require sustained intake to exert measurable ergogenic effects, consistent with the time needed for tissue saturation and mitochondrial incorporation.
CoQ10 showed a trend towards reducing subjective fatigue (k = 17; n 141; g = –0·21; 95 % CI: (–0·44, 0·02); I 2 = 5 %; P = 0·07; Low GRADE), suggesting a potential subjective benefit that warrants further investigation, though the effect did not reach statistical significance. In contrast, CoQ10 significantly increased blood CoQ10 levels (k = 16; n 258; g = 2·03; 95 % CI: (1·50, 2·56); PI: (0·35, 3·71); P < 0·001; Low GRADE certainty; power = 97 %), confirming robust biochemical responsiveness. However, high heterogeneity (I 2 = 76 %) reflects variability in supplementation protocols (e.g. dose, formulation and duration). Importantly, the large biomarker response contrasts sharply with the small and inconsistent performance effects, indicating that elevated circulating CoQ10 does not necessarily translate into functional improvements in exercise capacity.
For more details, please refer Figure 2.
Primary pooled effect sizes of CoQ10 supplementation on exercise performance (Acute and Chronic), subjective fatigue, and blood CoQ10. Notes: Three-level random-effects estimates are shown as standardised mean differences (Hedges’ g) with 95 % confidence intervals, 95 % prediction intervals and P values. Positive values favour CoQ10 for performance and blood CoQ10. Negative values favour CoQ10 for subjective fatigue (lower perceived exertion). Labels report k (number of effects), n (number of participants), I2 (heterogeneity), and statistical power for each outcome. GRADE ratings (Blue Circles) indicate the certainty of evidence for each pooled estimate. RoB-2 (squares; green – low risk, yellow – some concerns and red – high risk) denotes domain-level risk-of-bias summaries for each subgroup. GRADE, Grading of Recommendations Assessment, Development, and Evaluation.

Figure 2 Long description
The image contains a combination of forest plots and meta-analysis graphs. The overall exercise performance graph shows a small positive effect with a Hedges' g of 0.13 and a confidence interval ranging from -0.01 to 0.27. The exercise performance with chronic intake graph indicates a moderate positive effect with a Hedges' g of 0.15 and a confidence interval from 0.01 to 0.29. The exercise performance with acute intake graph shows a negligible effect with a Hedges' g of 0.04 and a confidence interval from -0.21 to 0.28. The subjective fatigue level graph shows a small negative effect with a Hedges' g of -0.21 and a confidence interval from -0.44 to 0.02. The CoQ10 blood level graph shows a large positive effect with a Hedges' g of 2.03 and a confidence interval from 1.50 to 2.56. Each graph includes confidence intervals, prediction intervals, and heterogeneity values. The graphs are color-coded with green for confidence intervals and yellow for prediction intervals. The x-axis represents the standardized mean differences, and the y-axis lists the individual studies included in the meta-analysis. The overall trend suggests that CoQ10 supplementation may improve blood CoQ10 levels and has a modest effect on exercise performance and subjective fatigue. All values are approximated.
Moderator analysis
Categorical variables
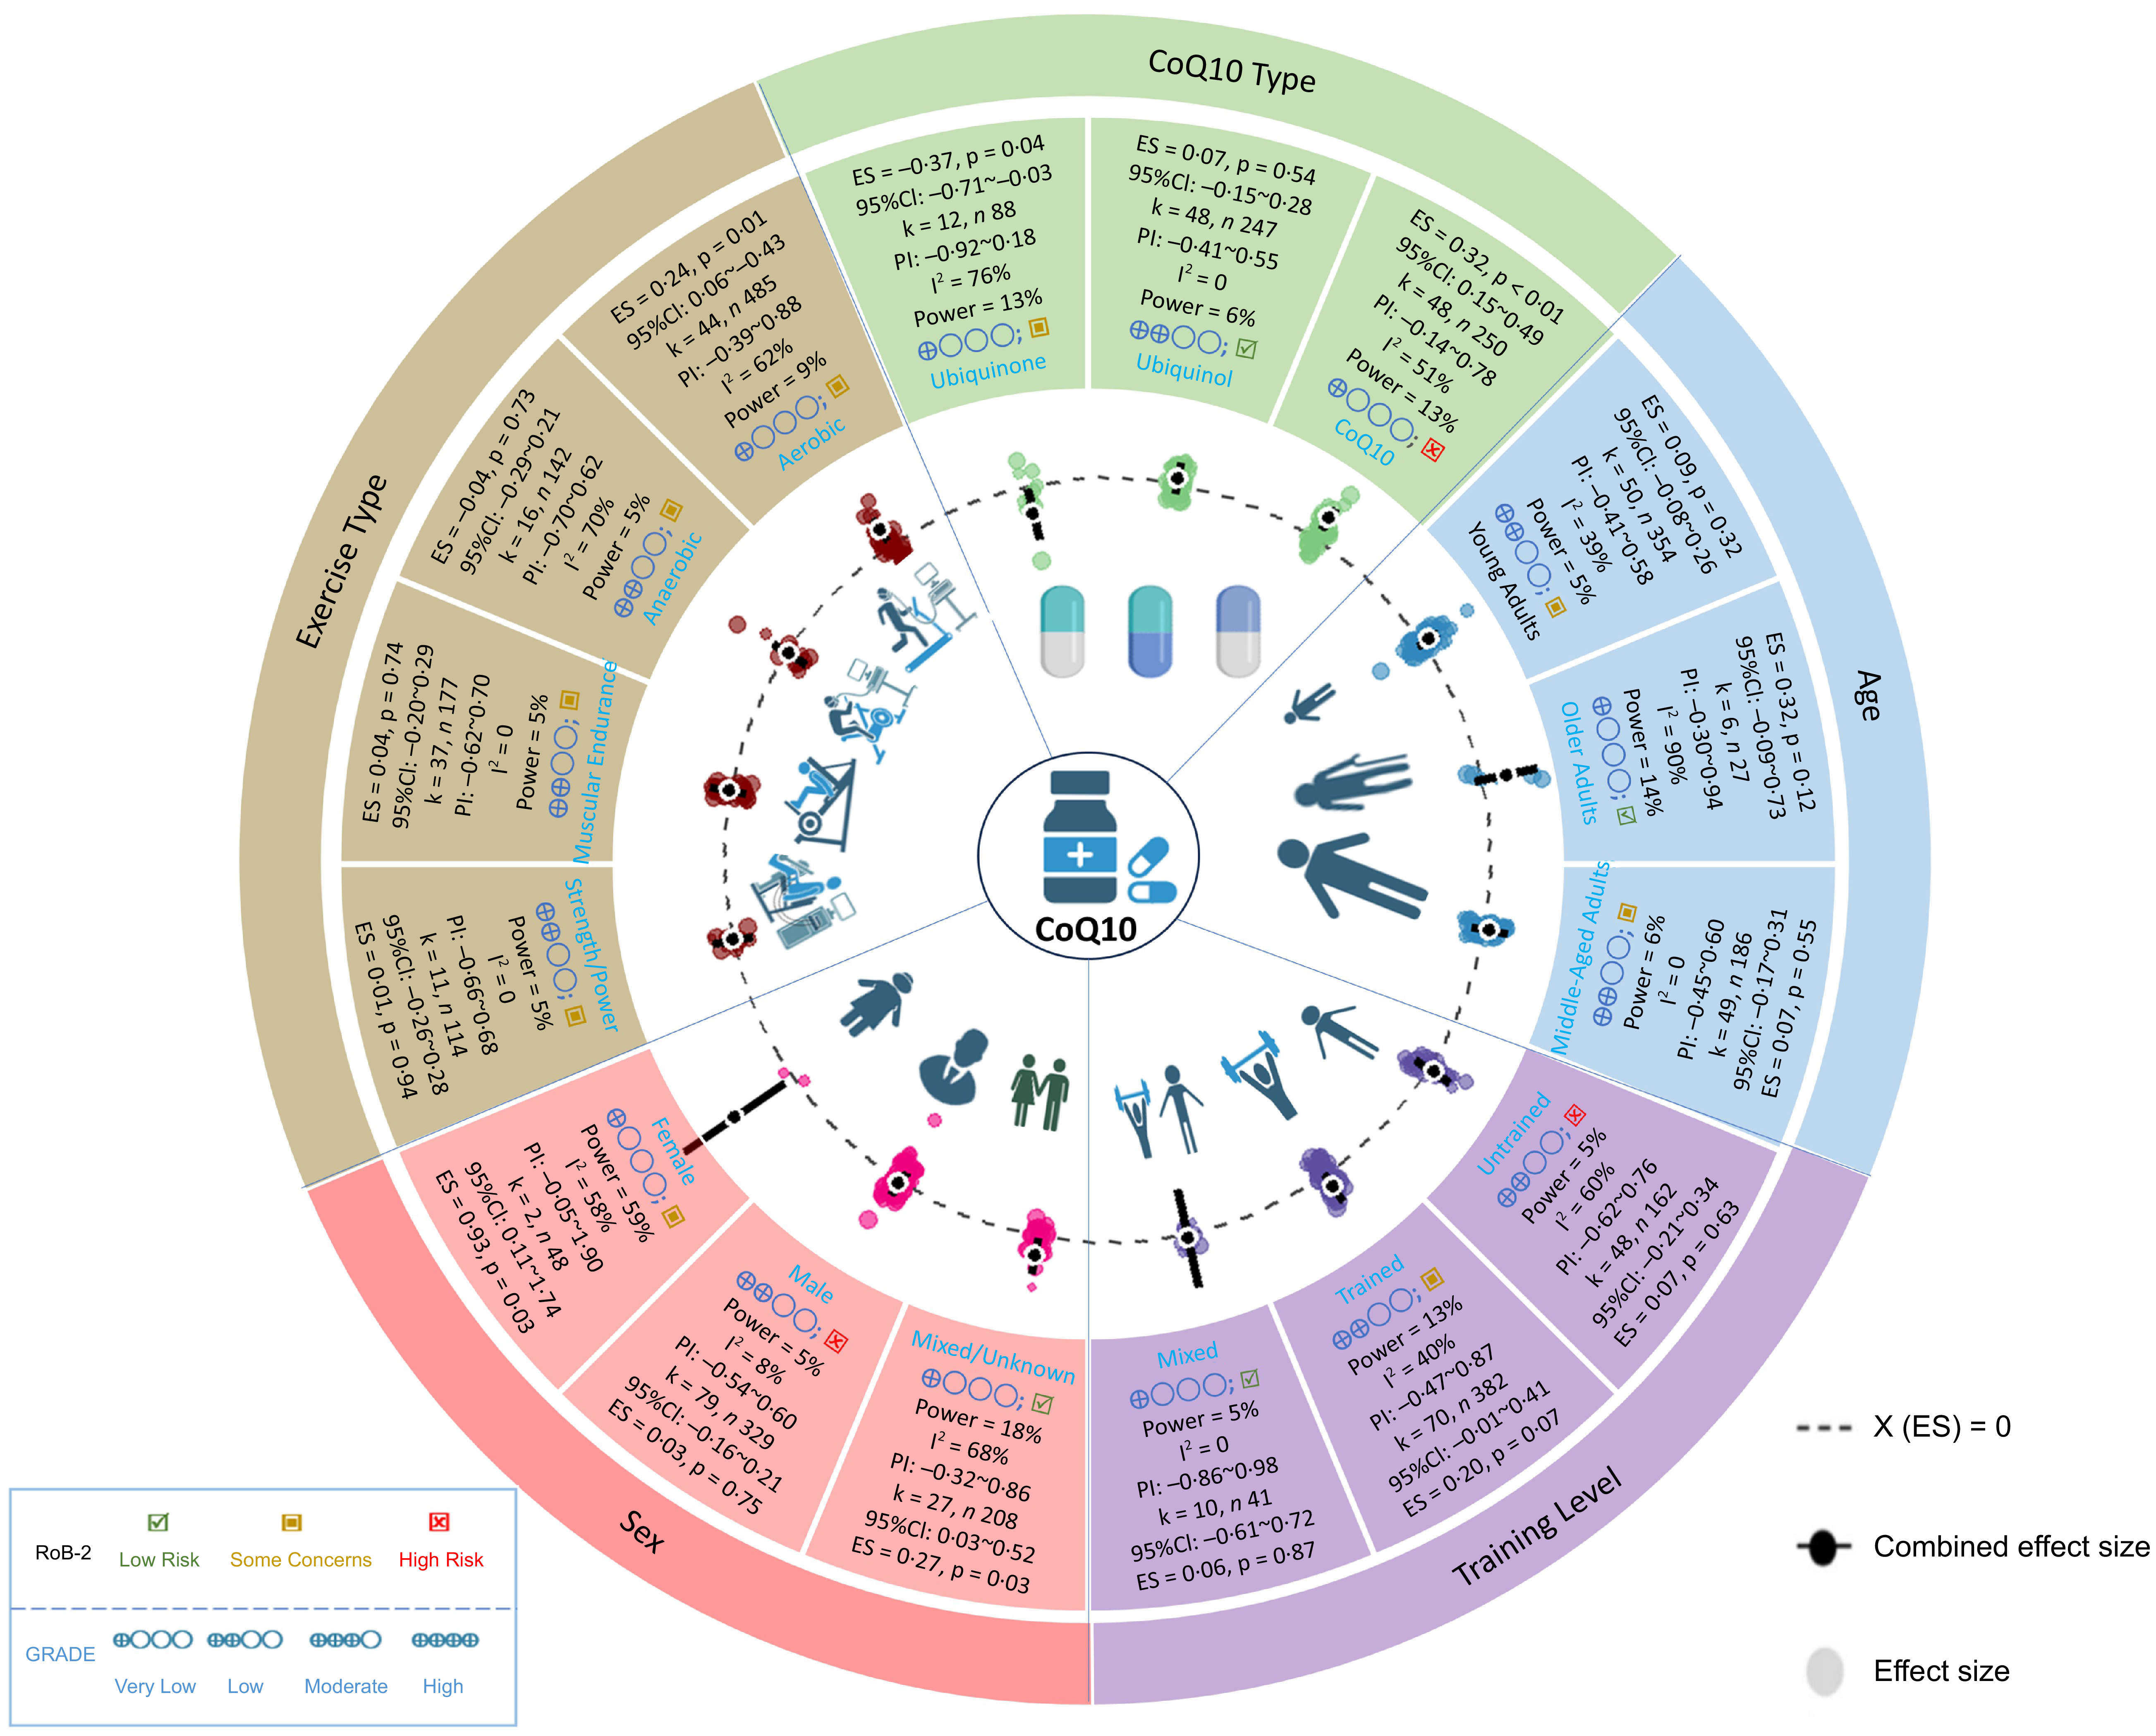
Sex-based subgroup analysis revealed a statistically significant difference (P = 0·049; I 2 = 37 %). The pooled effect size among male participants was negligible (k = 79; n 329; g = 0·03; 95 % CI: (–0·16, 0·21); P = 0·75, Low GRADE), whereas larger but imprecise effect was observed among females (k = 2; n 48; g = 0·93; 95 % CI: (0·11, 1·74); P = 0·03; PI (–0·05, 1·90); Very low GRADE). This apparent sex difference should be interpreted cautiously, as it was driven by a small number of studies with wide confidence intervals and may reflect hormonal, metabolic or sampling variability.
Regarding training status, no significant between-group difference was found (P = 0·73; I 2 = 43 %). A small, borderline-significant effect was observed in trained individuals (k = 70; n 382; g = 0·20; 95 % CI: (–0·01, 0·41); P = 0·07, Low GRADE), while effects in untrained (g = 0·07) and mixed-training samples (g = 0·06) were trivial and non-significant. This pattern may reflect greater sensitivity to marginal performance gains in trained populations or more standardised exercise protocols, though statistical power remained low.
Similarly, age group did not moderate the effects of supplementation (P = 0·54; I 2 = 31 %). A small, non-significant benefit was observed in older adults (k = 6; n 27; g = 0·32; 95 % CI: (–0·09, 0·73); P = 0·12, Very low GRADE), with lower effect sizes observed in young- and middle-aged participants.
Subgroup differences by CoQ10 formulation were statistically significant (P < 0·01; I 2 = 31 %). A moderate and statistically significant effect was observed in studies using unspecified formulations (k = 48; n 250; g = 0·32; 95 % CI: (0·15, 0·49); PI: (–0·14, 0·78); P < 0·001; I 2 = 51 %; Very low GRADE). In contrast, studies using ubiquinol reported no significant effects (g = 0·07; P = 0·54; Low GRADE), while ubiquinone was associated with a small but significant negative effect (g = –0·37; P = 0·04; Very low GRADE). Notably, unspecified formulations outperformed the more bioavailable ubiquinol, an unexpected finding that suggests potential confounding by study design or dosing protocols and warrants cautious interpretation.
For exercise types, aerobic endurance showed a small benefit (k = 44; n 485; g = 0·24; 95 % CI: (0·06, 0·43); PI: (–0·39, 0·88); P = 0·01, Very low GRADE), while anaerobic performance, muscular endurance and strength/power were minimally affected and not significant. The difference between aerobic and anaerobic performance was statistically significant (P = 0·03), indicating that CoQ10 may preferentially support oxidative metabolism over high-intensity, glycolytic activities.
For more details, please refer to Figure 3.
Moderator analyses under chronic supplementation. Notes: Subgroup effects for sex, training status, age, Coenzyme Q10 (CoQ10) type and exercise domain are displayed as Hedges’ g with 95 % CI, 95 % prediction intervals and P values. Labels report k (number of effects), n (number of participants), I2 (heterogeneity) and statistical power for each outcome. GRADE ratings (blue circles) indicate the certainty of evidence for each pooled estimate. RoB-2 (squares; green – low risk, yellow – some concerns and red – high risk) denotes domain-level risk-of-bias summaries for each subgroup. Analyses were pre-specified and restricted to chronic trials to reflect pharmacokinetic differences and the predominance of chronic protocols. GRADE, Grading of Recommendations Assessment, Development, and Evaluation.

Figure 3 Long description
The diagram presents a comprehensive analysis of the effects of Coenzyme Q10 (CoQ10) supplementation on exercise performance, recovery, and physiological stress. It is divided into sections based on different variables such as CoQ10 type, exercise type, sex, age, and training level. Each section contains data on effect sizes, confidence intervals, prediction intervals, and statistical power. The diagram uses various symbols and colors to represent different levels of risk and certainty of evidence. Arrows and icons illustrate the relationships and flows between different elements, providing a visual representation of how CoQ10 supplementation impacts various aspects of exercise physiology.
Continuous variables
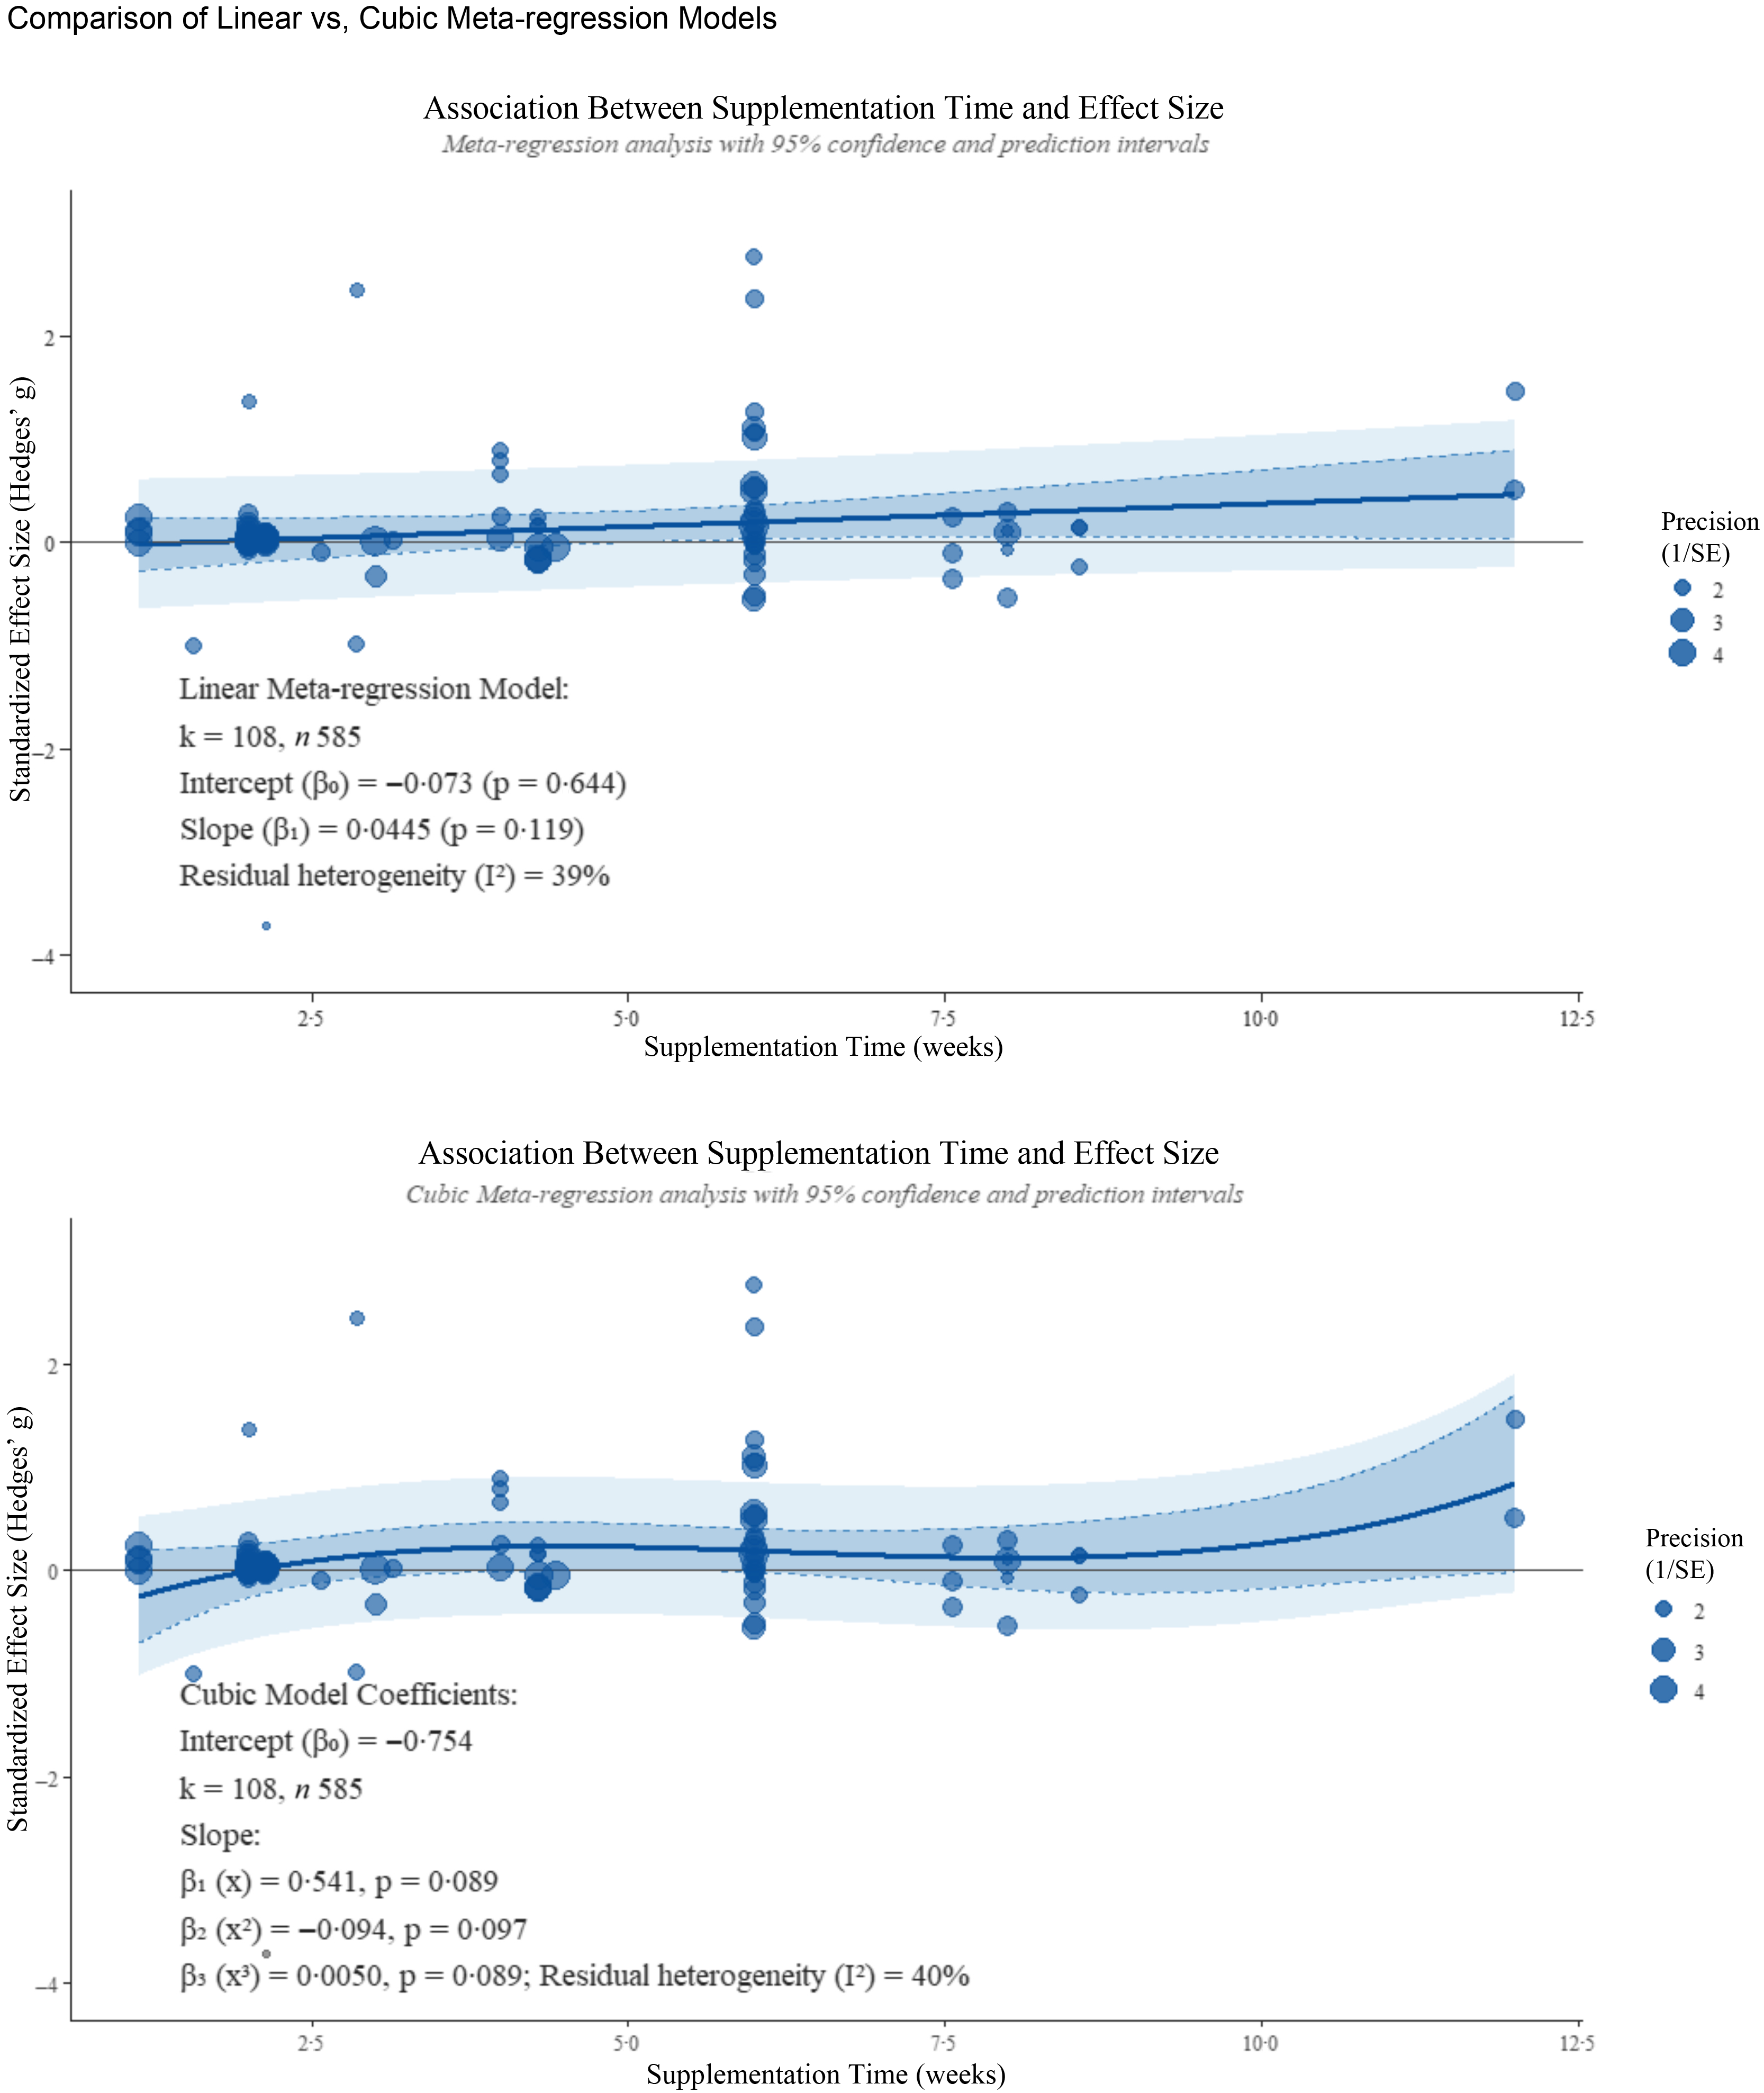
Linear meta-regression of supplementation duration (Figure 4, top) indicated a positive but non-significant slope (k = 108; n 585; β₁ = 0·04; P = 0·12; I 2 = 39 %). The cubic model (Figure 4, bottom) also showed no significant non-linear trend (all P > 0·05; I 2 = 40 %). Thus, within the studied range, longer supplementation periods did not clearly translate into greater performance benefits. Likewise, dosage showed no significant linear relationship (k = 107; n 565; β₁ = 0·0003; P = 0·76; I 2 = 43 %), and the cubic model identified no robust curvilinear association (all P > 0·05; I 2 = 40 %; online Supplementary Appendix S5).
Meta-regression of chronic supplementation duration on exercise performance. Notes: Predicted effects (Hedges’ g) across supplementation duration (weeks) under linear and cubic models, with 95 % confidence bands (light blue shaded area) and prediction intervals (outermost blue dotted lines). The solid line shows the fitted regression line. Each point represents a separate effect size (k), which size varies according to the weight. k (number of effects), n (number of participants), β₀ (intercept) and slopes (β₁, β₂ and β₃), I2 (heterogeneity). P values refer to the statistical significance of the association between supplementation duration and effect size. No statistically significant dose–duration relationship was detected.

Figure 4 Long description
The image contains two scatter plots comparing linear and cubic meta-regression models of supplementation time and effect size. The top plot shows the linear meta-regression model with data points representing standardized effect sizes (Hedges g) plotted against supplementation time in weeks. The linear regression line is displayed with a 95 percent confidence interval shaded in light blue and prediction intervals marked by outermost blue dotted lines. The bottom plot shows the cubic meta-regression model with similar data points and a cubic regression line, also with 95 percent confidence and prediction intervals. Each point represents a separate effect size, with size varying according to the weight. The linear model shows an intercept of negative 0.073 with a slope of 0.0445, while the cubic model shows an intercept of negative 0.754 with slopes for linear, quadratic, and cubic terms. Both models indicate no statistically significant dose-duration relationship. The plots include precision levels indicated by the size of the data points.
Finally, to explore potential synergistic effects, an interactive dosage × duration model was examined. Data of dosage and duration showed weak-to-moderate negative correlation (r = –0·31 to –0·45), and neither main effects nor the interaction term reached significance (all P > 0·05; online Supplementary Appendix S6), providing no conclusive evidence of synergistic dose–time effects.
Risk of bias and quality of methods
RoB-2 assessments were conducted separately for overall exercise performance, subjective fatigue and blood CoQ10 concentration.
For overall exercise performance, most trials were judged at some concerns or high risk, primarily due to inadequate reporting of the randomisation process and, to a lesser extent, selective reporting. In contrast, risk was generally low for deviations from intended interventions, missing outcome data and outcome measurement. Inter-rater reliability between assessors was high across all outcomes (Kappa (k) = 0·79–1·00; raw agreement 83–100 %), exceeding the predefined threshold of 80 % and confirming consistency in the evaluation process.
For subjective fatigue, among the four trials assessed, two were rated high risk overall and two showed some concerns. The principal weaknesses were selective reporting (frequently high risk) and incomplete reporting of randomisation (often some concerns). Deviations from intended interventions, missing data and outcome measurement were largely low risk. Inter-rater agreement for this outcome was variable due to the small sample size (raw agreement 75–100 %; Kappa (k) varied widely across domains), with lower agreement observed in the randomisation and deviations domains.
For blood CoQ10 concentration, overall risk was moderate to high, similar to exercise performance. The most frequent issues were inadequate reporting of the randomisation process (limited detail on sequence generation and allocation concealment) and selective reporting. Domains relating to outcome measurement and missing data were predominantly low risk, though some pockets of high risk were present. Inter-rater reliability for this outcome was strong (Kappa (k) = 0·83–1·00; raw agreement 92–100 %), supporting the stability of ratings.
In summary, while measurement and follow-up procedures were generally sound, weaknesses in trial design and reporting (particularly randomisation and outcome selection) limit confidence in the body of evidence and should be considered when interpreting pooled effects. For further details, including the assessment results of chronic supplementation subgroup for exercise performance, please see online Supplementary Appendix S7.
Funnel plots and Egger’s test indicated potential publication bias for several categories, including overall exercise performance, chronic CoQ10 supplementation, changes in blood CoQ10 levels, studies involving mixed/unknown sex, trained participants, unspecified CoQ10 formulations and aerobic endurance outcomes. In contrast, no evidence of publication bias was observed for the remaining categories (P > 0·05) An exploratory trim-and-fill analysis using a conventional two-level random-effects model produced bias-adjusted pooled effects that were consistent with the corresponding primary estimates, suggesting that publication bias is unlikely to have materially influenced the overall conclusions. For more details, please refer to online Supplementary Appendix S8 and S9.
The mean PEDro score for all studies was 6·91, indicating overall fair-to-good methodological quality. Inter-rater reliability for the total PEDro score was moderate (intraclass correlation coefficient = 0·56; 95 % CI 0·22, 0·78). Item-level agreement exceeded 80 % for all PEDro items, denoting acceptable consensus despite some low kappa values attributable to category prevalence effects. For more information including per-item agreement statistics, please refer to online Supplementary Appendix S10.
The complete evaluation process, raw data and detailed rationale for RoB-2 and PEDro can be found at osf.io/f4y3j.
Sensitivity analysis
For exercise performance, results were generally robust across sensitivity checks, including variation of the assumed correlation coefficient (r = 0·2 and 0·8), refitting with maximum likelihood model rather than restricted maximum likelihood model and exclusion of statistical outliers. Within the overall subgroup framework, excluding statistical outliers and removing digitised or borrowed values rendered the apparent benefit of long-term supplementation non-significant. Consistently, when restricting the dataset to long-term supplementation, the pooled effect was attenuated to borderline non-significance (g = 0·14; 95 % CI (–0·01, 0·30); P = 0·07), likely due to reduced sample size and consequently lower statistical power(Reference Sun, Briel and Walter82,Reference Wang, Lagakos and Ware83) (online Supplementary Appendix S2). In the leave-one-out analysis limited to long-term studies, no single study unduly influenced the findings, with pooled effects ranging from 0·09 to 0·18 and corresponding P values from 0·06 to 0·22 (online Supplementary Appendix S11). After exclusion of outliers, between-study heterogeneity for this outcome was eliminated (I 2 = 0 %; online Supplementary Appendix S2).
Regarding subjective fatigue, the findings are quite sensitive to model selection. Although subjective fatigue was not significant under the default specification (r = 0·5; restricted maximum likelihood), statistical significance emerged when r was set to 0·8 or when models were estimated by maximum likelihood (P = 0·04; online Supplementary Appendix S2). Following outlier exclusion, CoQ10 was associated with a reduction in subjective fatigue (g = –0·19; 95 % CI (–0·39, –0·01); P = 0·048) and heterogeneity decreased to I 2 = 0 % (online Supplementary Appendix S2).
For blood CoQ10 concentration, outlier exclusion did not resolve residual heterogeneity for this outcome (I 2 = 48 %), and the remaining sensitivity checks did not materially alter the direction of the pooled effect (online Supplementary Appendix S2).
In moderator analyses, outlier removal yielded notable changes: (1) In the sex subgroup, the effect for mixed/unknown sex became non-significant (g = 0·21; 95 % CI: (–0·02, 0·44); P = 0·07), and the female subgroup was entirely excluded; (2) among training levels, the effect in trained participants became significant (g = 0·19; 95 % CI: (0·01, 0·38); P = 0·049), while the mixed group was excluded; (3) in the age subgroup, no statistical changes were observed, except that the older adult group was fully excluded due to outlier influence; (4) in terms of CoQ10 formulation, oxidised CoQ10 (ubiquinone) no longer showed a significant negative effect on performance (g = –0·51; 95 % CI: (–1·34, 0·33); P = 0·23) and (5) finally, within exercise modality, the effect on aerobic endurance was attenuated and became borderline significant (g = 0·17; 95 % CI: (–0·01, 0·35); P = 0·05) (online Supplementary Appendix S12).
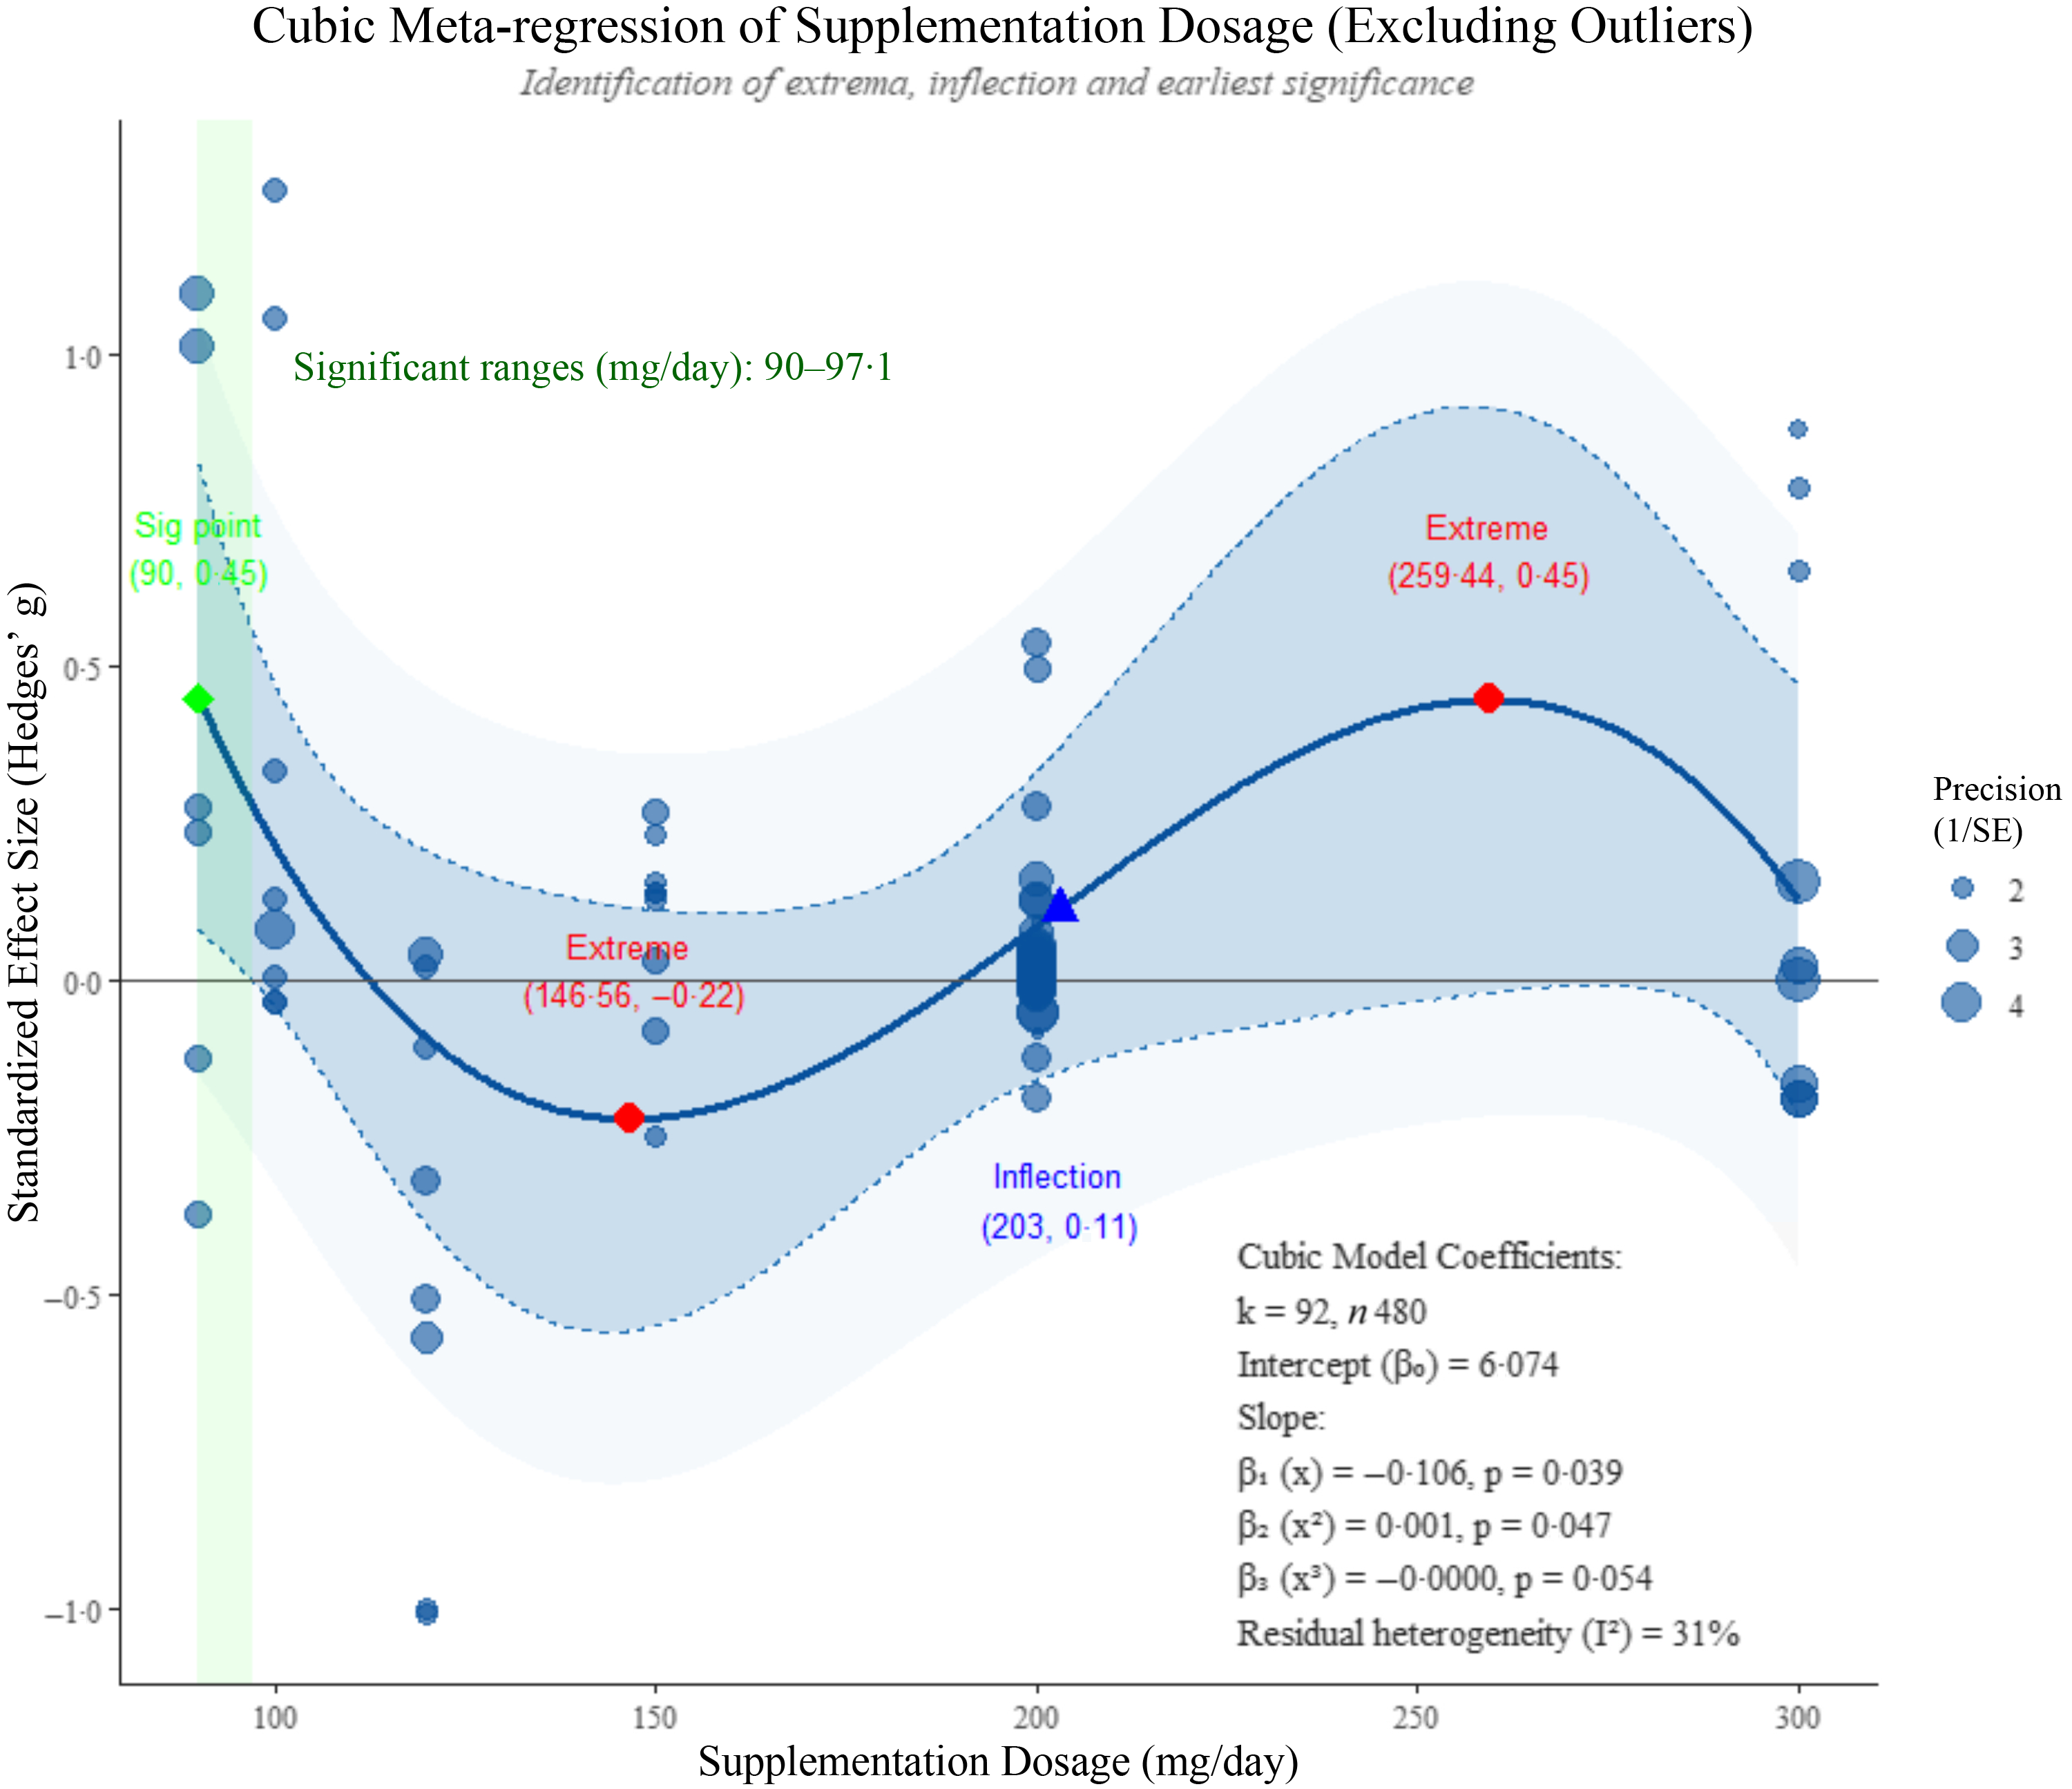
In the meta-regression analysis, removal of outliers did not substantially alter the linear or cubic non-linear associations for supplementation duration, nor the linear association for the dose × duration interaction. No significant trends were observed in any of these models (online Supplementary Appendix S6 and S13). However, after excluding outliers (k = 15), a significant non-linear relationship emerged between dosage and effect size (Figure 5; β2 = 0·001, P = 0·047; I 2 = 31 %). The model identified two local extrema at 146·56 mg/d (g = –0·22) and 259·44 mg/d (g = 0·45), with an inflection point at 203 mg/d (g = 0·11). Importantly, the only dosage range demonstrating statistically robust effects (95 % CI lower bound consistently > 0) was 90–97·1 mg/d (green shaded region), suggesting this as a potential evidence-based therapeutic window. Higher dosages, including the theoretical peak at 259 mg/d, showed insufficient statistical stability for reliable recommendations.
Cubic meta-regression of chronic supplementation dosage on exercise performance after outlier exclusion. Notes: After excluding outliers, predicted effects (Hedges’ g) across daily dose (mg/d) under cubic models, with 95 % confidence bands (light blue shaded area) and prediction intervals (outermost blue dotted lines). The solid line shows the fitted regression line. Each point represents a separate effect size (k), which size varies according to the weight. k (number of effects), n (number of participants), β₀ (intercept), slopes (β₁, β₂ and β₃), I2 (heterogeneity). The first significant point (Sig point), the maximum and minimum values within the model range (Extreme), dose efficiency inflection point (Inflection point). P values refer to the statistical significance of the association between supplementation dose and effect size. Green shaded regions mark dose ranges that reached nominal significance in the primary model (90–97·1 mg/d). Results are exploratory and should be interpreted cautiously.

Figure 5 Long description
A scatter plot illustrates the relationship between supplementation dosage in milligrams per day and standardized effect size measured in Hedges' g. The plot includes dozens of data points, each representing a separate effect size, with varying sizes indicating precision. The x-axis represents supplementation dosage ranging from 0 to 300 milligrams per day, while the y-axis represents standardized effect size ranging from -1.0 to 1.0. The plot features a fitted regression line with a cubic model, highlighted by a solid blue line, and 95% confidence bands shaded in light blue, with prediction intervals marked by outermost blue dotted lines. Key points are labeled, including significant ranges, extrema, and an inflection point. Data points are color-coded by precision levels, with different shades of blue indicating varying degrees of precision. The plot also includes annotations for significant points, extrema, and inflection points, providing detailed insights into the model's predictions. All values are approximated.
Discussion
This meta-analysis provides a comprehensive quantitative synthesis of the effects of CoQ10 supplementation on exercise performance, subjective fatigue and circulating CoQ10 levels. Overall, CoQ10 supplementation produced a small and inconsistent improvement in performance, a modest reduction in subjective fatigue and a large, robust increase in blood CoQ10 concentrations. Collectively, these findings suggest that while CoQ10 supplementation effectively elevates systemic levels, the translation of these biochemical changes into functional performance benefits remains limited and context-dependent. Below, we interpret these findings in light of plausible biological mechanisms and existing evidence.
Effects of CoQ10 on overall exercise performance: acute v. chronic supplementation
The observation that chronic rather than acute supplementation is associated with small performance gains aligns with the known pharmacokinetics of CoQ10. Sustained intake is typically required to replenish tissue stores, particularly within skeletal muscle mitochondria, where CoQ10 supports ATP production via the electron transport chain(Reference Crane3). With oral supplementation, plasma concentrations rise gradually and generally reach steady state after about 2 to 3 weeks of continuous use(Reference Bhagavan and Chopra84). By contrast, a single dose is often insufficient to overcome limited absorption and distribution to metabolically active tissues, especially in the absence of co-ingested fats or sustained-release formulations.
Moreover, longer-term intake allows CoQ10 to exert its antioxidant effects, reduce exercise-induced oxidative stress and improve mitochondrial efficiency, mechanisms that require time to induce meaningful physiological adaptations(Reference Littarru and Tiano85). These changes are unlikely to occur following an acute or short-term dose. Nevertheless, the small effect size and wide prediction interval underscore substantial variability among studies, suggesting that the ergogenic response to CoQ10 is influenced by multiple contextual factors such as exercise type, training status and baseline CoQ10 levels. These findings reinforce the view that chronic supplementation is a prerequisite for any measurable effect but that its practical significance remains uncertain.
Chronic supplementation
Sex-specific effects of long-term CoQ10 supplementation on exercise performance
Female participants exhibited larger but less precise performance effects compared with males, consistent with possible differences in baseline CoQ10 status(Reference Gutierrez-Mariscal, Yubero-Serrano and Villalba86,Reference Miles, Horn and Morrison87) or hormonal modulation of mitochondrial function(Reference Ventura-Clapier, Moulin and Piquereau88). However, this interpretation remains tentative, as only one women-only study was included(Reference Yanprechaset, Kanungsukkasem and Kaimuk81), and the female subgroup was removed after outlier exclusion due to insufficient data. The limited sample size and wide confidence intervals preclude firm conclusions, highlighting the need for adequately powered, sex-stratified trials to better elucidate whether and to what extent biological sex moderates the effects of CoQ10 supplementation on exercise performance.
Influence of training status on the effects of CoQ10 supplementation
Training status appeared to moderate the ergogenic effects of CoQ10 supplementation. Trained individuals typically exhibit greater mitochondrial density, oxidative enzyme activity and metabolic turnover during exercise, conditions under which CoQ10’s role in electron transport and ATP resynthesis becomes more physiologically relevant(Reference Littarru and Tiano85,Reference Holloszy and Coyle89) . Consequently, CoQ10 supplementation may offer greater benefits when mitochondrial demand and oxidative stress are elevated(Reference Niklowitz, Sonnenschein and Janetzky90).
In contrast, untrained individuals likely experience lower oxidative stress and possess a larger adaptive reserve(Reference Niklowitz, Sonnenschein and Janetzky90), which diminishes the physiological need for additional CoQ10. Moreover, greater variability in physical capacity and motivation among untrained participants may introduce higher between-study heterogeneity, potentially obscuring subtle ergogenic effects(Reference Braakhuis and Hopkins91). Overall, these differences in responsiveness underscore the importance of considering participants’ training status when evaluating the efficacy of mitochondrial-targeted nutritional interventions.
Influence of age on the efficacy of CoQ10 supplementation
Although comprehensive data on age-related changes in CoQ10 concentrations across different human tissues remain limited, existing evidence suggests that endogenous CoQ10 biosynthesis peaks around the age of 25 and declines progressively thereafter(Reference Hernández-Camacho, Bernier and López-Lluch92,Reference Kalén, Appelkvist and Dallner93) . Additionally, brain ageing, which typically begins around the age of 40, has been associated with mitochondrial dysfunction, including impaired ATP production and increased generation of ROS, both of which may affect CoQ10 turnover and utilisation efficiency(Reference Mantle, Heaton and Hargreaves94,Reference Peters95) . According to the WHO, individuals aged 60 years and older are classified as older adults, a stage at which endogenous CoQ10 synthesis is often markedly reduced(Reference Ravaglia, Forti and Maioli96). Notably, some studies have reported elevated plasma concentrations of oxidised CoQ10 in older adults; however, this may reflect reduced cellular uptake or impaired redox cycling, rather than improved functional CoQ10 status(Reference Del Pozo-Cruz, Rodríguez-Bies and Ballesteros-Simarro97,Reference Wada, Goto and Hagiwara98) . These physiological and biochemical factors underscore the importance of evaluating age-specific responses to CoQ10 supplementation and form the rationale for the age stratification used in this analysis.
Subgroup analyses stratified by age revealed very small effect sizes in young and middle-aged adults that did not reach statistical significance, whereas effect estimates in older adults were slightly higher, but the results were inconsistent and imprecise. These age-related variations can be explained by several physiological mechanisms. First, ageing is associated with mitochondrial dysfunction, including reduced electron transport chain efficiency and lower endogenous CoQ10 synthesis in tissues such as skeletal muscle and cardiac muscle(Reference Bhagavan and Chopra84,Reference Littarru and Tiano85) . As a result, older individuals may benefit more from exogenous CoQ10 supplementation due to their greater baseline deficiency. This could partially explain the relatively larger effect size observed prior to outlier removal. However, the limited number of studies in older populations (only six effect sizes) severely restricts statistical power and undermines the stability of this subgroup’s estimate.
Second, young- and middle-aged adults generally have higher baseline mitochondrial function and antioxidant capacity(Reference Cenini, Lloret and Cascella99,Reference Short, Bigelow and Kahl100) , which may make additional CoQ10 supplementation less impactful unless these individuals are exposed to significant oxidative stress or have low CoQ10 status due to training demands or dietary insufficiency. Moreover, because metabolic demand and redox balance during exercise vary with age, the extent to which CoQ10 can affect performance may differ accordingly.
Influence of CoQ10 formulation on exercise performance
Although ubiquinol, the reduced and more bioavailable form of CoQ10, achieves higher plasma concentrations than ubiquinone when administered at equivalent doses(Reference Langsjoen and Langsjoen101), this advantage did not translate into superior performance effects. The inconsistency may be attributed to heterogeneity in study design, dosing duration or participant characteristics(Reference Zhang, Liu and Chen102).
The apparent advantage of ‘unspecified’ formulations likely reflects reporting ambiguity rather than genuine efficacy differences. Similarly, the unexpected negative association observed for ubiquinone prior to outlier exclusion is difficult to reconcile biologically and may be explained by methodological heterogeneity or small-study effects rather than a true detrimental effect. Given the limited number of trials explicitly reporting the formulation type, these findings highlight the need for transparent reporting and standardisation of CoQ10 products in future research.
Influence of exercise type on the effects of CoQ10 supplementation
CoQ10 may offer greater benefits for aerobic endurance training than for anaerobic performance or strength training outcomes. This pattern is physiologically plausible given CoQ10 primary role in mitochondrial oxidative phosphorylation, which is more critical for sustained aerobic energy production than for short-duration, high-intensity efforts that rely predominantly on glycolytic and phosphagen pathways(Reference Crane3). During prolonged endurance exercise, CoQ10 facilitates electron transfer in the mitochondrial respiratory chain, supports ATP resynthesis and helps mitigate exercise-induced oxidative stress(Reference Littarru and Tiano85). This mechanistic rationale is supported by previous trials reporting improvements in aerobic capacity, reduced lactate accumulation and increased time-to-exhaustion following CoQ10 supplementation(Reference Alf, Schmidt and Siebrecht8,Reference Kunching, Nararatwanchai and Chalermchai9) .
In contrast, the negligible effects observed in anaerobic and strength/power outcomes likely reflect the lower dependence of these performance domains on mitochondrial ATP production and the limited capacity of CoQ10 to influence short-term energy systems or neuromuscular force generation. This finding aligns with prior evidence showing no significant ergogenic effects of CoQ10 on maximal power output or sprint performance in resistance-trained individuals(Reference Cooke, Iosia and Buford15,Reference Östman, Sjödin and Michaëlsson79) .
Influence of supplementation duration and dosage
Across models, supplementation duration did not show a consistent time–response gradient. This is compatible with a scenario in which tissue availability plateaus once basic stores are replenished(Reference Bhagavan and Chopra84), such that longer exposure does not necessarily yield proportional performance gains. Heterogeneity in adherence, baseline CoQ10 status and training load likely further blunts any monotonic temporal signal.
For dosage, a non-linear pattern emerged following influence diagnostics, suggesting that ergogenic responses may depend on thresholds and potential saturation rather than increase proportionally with dose. This is biologically plausible because CoQ10 absorption depends on formulation and lipid co-ingestion, involves lymphatic transport and appears subject to limited by solubility and saturable uptake(Reference López-Lluch, Del Pozo-Cruz and Sánchez-Cuesta103,Reference Mantle and Dybring104) . Additional factors such as differences in redox state (ubiquinone v. ubiquinol), carrier matrices (for example, emulsified or solubilised forms) and interindividual variability in gastrointestinal absorption and mitochondrial incorporation may also contribute to nonmonotonic dose–effect patterns even when circulating CoQ10 concentrations rise(Reference Littarru and Tiano85,Reference Pravst, Rodríguez Aguilera and Cortes Rodriguez105) .
In the two-dimensional meta-regression model, no significant main effects or interaction between duration and dose were observed either before or after outlier removal, which is consistent with the absence of a simple monotonic gradient. Nevertheless, the non-linear signal for dose was dependent on outlier handling and was derived from a relatively small number of effect sizes. Study dose ranges may also covary with other methodological features such as exercise modality, intervention duration or product type. Therefore, these findings should be regarded exploratory, and future trials with standardised dosage ranges and formulations are needed to determine whether a reproducible therapeutic dose window exists.
Effects of CoQ10 supplementation on subjective fatigue
The overall pattern of findings suggests that CoQ10 supplementation may help reduce subjective fatigue during exercise, although the strength of this effect remains uncertain. Mechanistically, CoQ10’s role as a mitochondrial electron carrier supports ATP resynthesis and promotes more efficient oxidative phosphorylation, which can help attenuate peripheral fatigue signals and lower subjective effort(Reference Littarru and Tiano85). Additionally, its antioxidant properties may reduce exercise-induced oxidative stress in muscle fibres, helping preserve contractile function and delay the onset of exertion-related discomfort(Reference Mizuno, Tanaka and Nozaki11,Reference Sarmiento, Diaz-Castro and Pulido-Moran25) . Notably, despite differences in statistical significance thresholds, the consistent direction of the effect supports a biologically plausible anti-fatigue benefit of CoQ10 supplementation. However, the magnitude of the observed effect is small and heterogeneous across exercise types and participant characteristics. Given that subjective fatigue is influenced by multiple physiological and psychological factors, CoQ10’s impact should be regarded as supportive rather than determinative.
Effects of CoQ10 supplementation on blood CoQ10 concentrations
The present analysis confirmed that oral CoQ10 supplementation substantially elevates circulating CoQ10 levels. This finding aligns with its known pharmacokinetics, whereby ingested CoQ10 is incorporated into chylomicrons and transported into the bloodstream, resulting in marked increases in plasma concentrations within hours of ingestion(Reference Bhagavan and Chopra84,Reference Miles, Horn and Morrison87) .
However, the physiological relevance of these increases remains uncertain. Although elevated plasma CoQ10 is commonly interpreted as a marker of compliance and systemic availability, evidence suggests that tissue uptake, particularly into skeletal muscle mitochondria, is much more limited. For example, Cooke et al. (2008)(Reference Cooke, Iosia and Buford15) and Zhou et al. (2005)(Reference Zhou, Zhang and Davie34) both reported no appreciable increases in intramuscular CoQ10 despite significant rises in circulating levels. This dissociation may reflect regulatory mechanisms that limit tissue accumulation even when plasma concentrations are elevated.
Moreover, although the large effect size confirms the bioavailability of supplementation, the high between-study heterogeneity highlights variability in formulation characteristics, dosing regimens, and analytical methods. These factors complicate interpretation of the relationship between biochemical and functional outcomes. Taken together, while increased blood CoQ10 demonstrates effective absorption, it should not be assumed to directly translate to higher mitochondrial content or improved exercise performance. Clarifying these distinctions is essential to understanding the true ergogenic potential of CoQ10.
Practical applications
Collectively, our findings indicate that CoQ10 supplementation may hold particular promise for endurance-type athletes or individuals with elevated oxidative demands or low baseline CoQ10 status, whereas its benefits for strength, power or high-intensity anaerobic performance appear negligible. Given the modest but consistent increases in circulating CoQ10 and the observed small performance gains in aerobic conditions, an approximate dose of 90–100 mg per day may be considered a practical starting point for long-term supplementation, pending further high-quality dose-ranging studies.
However, practitioners should remain mindful that: (1) the evidence for a clear dose–response is currently lacking and tissue uptake remains uncertain; (2) elevated plasma CoQ10 does not guarantee functional improvements in muscle mitochondria; (3) athlete-specific factors such as training status, sex, exercise type and baseline nutritional or CoQ10 status modulate responsiveness and (4) cost–benefit and formulation quality (absorption, bioavailability) must be weighed before routine use in athletic populations. If cost and supply allow, the reduced form ubiquinol may be a preferable choice, given its higher bioavailability and more favourable absorption characteristics compared with ubiquinone.
In practice, endurance coaches or sports nutrition practitioners may choose to implement CoQ10 supplementation over a sustained period (for example, four weeks or longer), monitor subjective fatigue and performance trends and reassess its continued use in the context of individual response, economy and training phase.
Future directions
Future research should prioritise large, rigorously designed randomised controlled trials that stratify participants by sex, age and training level to clarify population-specific effects. Standardising supplementation protocols, including dose, formulation, duration and co-ingestion strategies, is essential to reduce heterogeneity and improve comparability across studies. In addition, future trials should incorporate direct measures of skeletal muscle CoQ10 content, mitochondrial function and oxidative stress biomarkers to better elucidate mechanistic pathways linking supplementation to performance outcomes. Finally, given the current uncertainty surrounding optimal dosing regimens, well-designed dose-ranging trials are needed to determine whether threshold or saturation effects account for the inconsistent ergogenic benefits observed to date.
Strengths and limitations
A key strength of this meta-analysis is its comprehensive and quantitative integration of existing evidence using rigorous multi-level models, moderator analyses and sensitivity analyses. Unlike prior reviews(Reference Bian and Wei22–Reference Fernandes, Fidelis and Aidar24), which provided exclusively narrative syntheses or qualitative summaries, our study offers the first detailed meta-analytic estimates of CoQ10’s effects across multiple domains, including performance outcomes, subjective fatigue and circulating biomarkers. By accounting for methodological heterogeneity and potential moderators such as sex, age, training status, supplementation duration, dosage and formulation type, our findings highlight that the ergogenic potential of CoQ10 is likely context-dependent rather than universally beneficial. This provides a more nuanced perspective than earlier reports, which often presented overly general conclusions regarding its efficacy.
Moreover, while Talebi et al. (2024) conducted a meta-analysis(Reference Talebi, Pourgharib Shahi and Zeraattalab-Motlagh21), their focus was limited to a single outcome (mean power), preventing broader conclusions about endurance, fatigue perception or biochemical adaptations. In contrast, our multi-dimensional approach integrates a wider array of performance indices, enhancing ecological validity and practical relevance. Extensive sensitivity analyses, including leave-one-out, estimator variation and outlier exclusion, further strengthen the robustness and transparency of our conclusions.
Nevertheless, several limitations merit consideration. At the study level, although twenty-four trials were included, many subgroups had small sample sizes, and protocols varied considerably in dosage, duration and outcome measurement. The limited reporting of muscle tissue CoQ10 levels further restricts mechanistic interpretation. Moreover, the included trials exhibited moderate-to-high risk of bias, particularly in randomisation and selective reporting domains, which may affect the reliability of individual study estimates. At the meta-analysis level, high between-study variability and the absence of consistent dose–response relationships suggest that unmeasured confounders or methodological heterogeneity may have influenced pooled effects. Furthermore, this review was restricted to peer-reviewed, English-language sources and did not search trial registries, grey literature or preprints to reduce duplicate records and ensure data quality. However, publication bias and language bias may persist, as null or negative findings are often underrepresented in published literature. While small-study effects were assessed using contour-enhanced funnel plots and Egger’s tests, the overall certainty should be interpreted considering these potential limitations.
Overall, this meta-analysis advances the field by providing a comprehensive and critical evaluation of CoQ10 supplementation in exercise contexts, while highlighting key methodological and conceptual gaps that should inform the design of future high-quality trials.
Conclusion
In conclusion, this meta-analysis confirms that CoQ10 supplementation reliably elevates blood concentrations but yields only modest, context-dependent ergogenic effects. Potential benefits seem greatest with chronic use in aerobic endurance settings, yet the instability of the findings and the absence of a clear dose–response relationship mean that its role as a consistent performance enhancer remains uncertain and warrants further rigorous investigation.
Acknowledgements
The authors wish to express their highest respect to the editors and reviewers for their insightful suggestions. We also sincerely appreciate all researchers whose studies were included in this meta-analysis.
No financial assistance was received in support of this study by any of the authors.
H. D. conceptualised the study, designed the methodology, performed the statistical analysis and completed the draft of the manuscript; T. S. and X. F. conducted article screening and formatting; M. Y., K. X., Y. Z. and N. B. M. contributed to article screening and data collection; M. N. B. N., A. Y. and X. F. reviewed and proofread the manuscript. All authors contributed to the interpretation of the results, revised the manuscript and approved the final version.
All authors declare no conflict of interest.
Supplementary material
For supplementary material/s referred to in this article, please visit https://doi.org/10.1017/S0007114525106211