

DISCUSSION POINTS
-
• High-voltage and high capacity electrodes are indispensable for high-energy-density lithium-ion batteries for electric vehicle applications
-
• What are the stumbling blocks for utilizations of these electrodes in practical batteries?
-
• What are the implications of structural changes in those electrodes on lithium-ion batteries performances?
-
• What are the sources of structural degradation that lead to unusual phenomena and how materials diagnostics play an important tool to unravel those structural changes?
Lithium-ion battery (LIB) technology for environmentally friendly transportation
The world's overall consumption of energy has greatly increased over the past 25 years, 1,2 and energy use now poses the greatest technological challenges that we face today. The crucial challenge is to make the best use of limited energy resources (primarily fossil fuels) until viable alternatives can be developed to support or replace them. Thanks to Thomas Young, who in 1807 developed the quantitative definition of “energy” that is in use today Reference Young3 (“the product of the mass of a body into the square of its velocity”), both energy consumption and energy efficiency can be measured and compared.
In 2011, US energy use was 97.5 quadrillion Btu or 1.05505585 × 10¹⁸ J (1 quadrillion Btu is equivalent to 172 million barrels of oil, 50 million tons of coal, or about 1 trillion cubic feet of natural gas). Reference Lewis4 The largest current energy source in the US is petroleum. Reference Lewis5 A study has shown that 72% of total energy consumption is by transportation systems, 97% of which are “oil dependent.” 1
With widespread use of petroleum products in internal combustion (IC) engines come increased concentrations of greenhouse gases (carbon dioxide, methane, and nitrous oxide) in the earth's atmosphere. Reference Lewis4,Reference Baskin6 Calculations based on model parameters such as population growth and of primary energy sources indicate that the earth's temperature is expected to rise by as much as 4.0 °C in the coming 100 years. Reference Lewis4 Climate change is already having a direct impact on earth's surface (e.g., increased in melting of polar ice caps). As the level of CO2 in the earth's atmosphere continues to increase, it will continue to have an increasingly adverse effect on the earth's ecosystems. Unfortunately, the amount of CO2 in the atmosphere cannot be reduced by any means; however, its further increase can be controlled by following some vital steps. In this respect, today's world needs much cleaner and carbon-free energy for the coming decades. Reference Chu and Majumdar7
Much of the petroleum that the United States relies on to meet its energy needs is imported. The dependence on foreign oil can lead to shortages of petroleum products and increases in cost. Reference Chu and Majumdar7 Since most petroleum products are consumed by our transportation systems, we need to develop vehicles that are powered by clean and renewable energy sources. Reference Zhang8
To realize this transformation, we are replacing vehicles powered by IC engines with electric vehicles (EVs) and hybrid-electric vehicles (HEVs), which are powered by advanced energy storage and conversion systems (hence, the invention of all-EVs). Reference Danielson9 Since its invention in 1991, the rechargeable LiBs have proven to be the leading candidate to power consumer electronics, cell phones, and laptops because of their high efficiency, light weight, safe operation, low maintenance, and long service life. Reference Whittingham10 It has also been the power source of choice for EVs and HEVs. Reference Danielson9,Reference Howell11 However, for a complete electrification of road transportation to be realized, the performance of LiBs has to be improved while reducing the cost and maintaining maximum calendar life and safety. According to the US Advanced Battery Consortium LLC, 12 requirements for PHEV LiBs are as follows: an energy window of 165 W h with 90% efficiency, more than 300,000 cycle life (for PHEV-20 Mile), 15 years of calendar life (operating at 30 °C), and a survival temperature range of −46 to +66 °C. In addition, the plug-in battery cost should be reduced from $485/kW h (in 2012) to $125/kW h, and the power density should be increased from 400 to 2000 W/L by 2022. These goals can be met only by advancing the fundamental and applied LiB chemistry in coming years. For example, one needs to develop new materials-processing and nondestructive evaluation methods Reference Mohanty, Li, Born, Maxey, Dinwiddie, Daniel and Wood13 or manipulate today's LiB processing technologies to reduce the processing cost Reference Wood, Li and Daniel14 of LiB manufacturing and to advance the manufacturing science for “high-performance” LiBs. Reference Mohanty, Li, Born, Maxey, Dinwiddie, Daniel and Wood13,Reference Li, Daniel and Wood15 From a fundamental standpoint, new and improved and yet cheaper raw materials have to be developed. One route to develop new electrode chemistries is to obtain better understanding of the failure mechanisms of current state-of-the-art electrode materials. However, we must assess the need for high-energy-density LiBs and determine the potential cathode material for high-energy-density LiBs.
The demand for high-voltage (HV) cathodes for high-energy-density LiBs
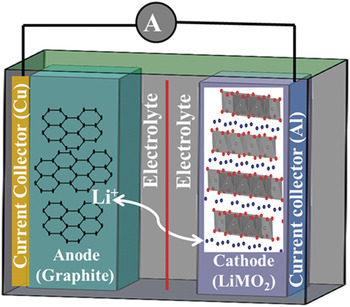
A typical LiB consists of a cathode or positive electrode (e.g., lithium-metal oxide such as layered LiMO2; M = Co, Mn, Ni), an anode or negative electrode (e.g., graphite), and a separator filled with electrolyte (LiPF6 in ethylene carbonate/diethyl carbonate). Reference Tarascon and Armand16 The electrodes typically contain active materials mixed with a binder and conductive additives. The electrodes are connected to the current collectors. During charging (delithiation), due to the external applied current, lithium ions are extracted from the solid matrix structure of the cathode oxide, travel through the separator and electrolyte, and are inserted into the anode, where they are stored. During discharging (lithiation), due to the lithium concentration gradient between cathode and anode, lithium ions travel back to the host cathode from anode, releasing electrons, which flow through the external circuit to power the device (Fig. 1). 17,Reference Daniel, Mohanty, Li and Wood18 One of the most important requirements for better performance and long cycle life is that the host cathode structure has to be maintained during lithiation and delithiation reactions to easily facilitate lithium diffusion. Therefore, the performance, cell potential, energy density, lifetime, power, and safety are directly related to the properties of the materials that are used in the electrodes. Cathode material is a vital component in LiBs with regard to both energy density and battery cost. The gravimetric capacity of common cathode materials is one-half that of anode materials (e.g., graphite). While it is still meaningful to develop new anode materials with higher capacity, such as silicon, the significance in improvement of energy density at the cell level will be limited until novel cathode materials and/or novel cathode architectures are developed to give cathodes the dramatic energy density improvement needed to match that of the anodes. Reference Kraytsberg and Eli19
Schematic of a LiB with a LiMO2 cathode and a graphite anode. Both electrodes are coated on current collectors and are separated by a separator (red line). The electrolyte in the cells acts as a medium for Li ion diffusion. Reference Daniel, Mohanty, Li and Wood18 Reprinted with permission from AIP Conference Proceedings. 1597, Vol. 26, Freiberg, Germany, 2014; p. 26. Copyright [2014], AIP Publishing LLC.

The concept of rechargeable LiBs was first illustrated in the 1970s with TiS2 as the cathode, metallic Li as the anode, and a nonaqueous electrolyte. Reference Whittingham20 One problem with the sulfide and chalcogenide cathode materials is low cell voltage (<2.5 V) due to the overlap of the higher-valent transition metal (TM): d band with the top of the nonmetal: p band. Reference Manthiram, Muraliganth, Daniel and Besenhard21 Metallic Li anodes offer higher voltage, but their inherent safety problems and dendrite formation during cycling exclude them from practical use in LiBs. During the 1980s, Goodenough's group developed layered oxide cathodes, such as LiCoO2, which could provide a voltage of ∼4 V. Reference Mizushima, Jones, Wiesman and Goodenough22,Reference Goodenough, Mizushima and Takeda23 That innovation plus the introduction of intercalation compounds (graphite) by Dr. Rachid Yazami 24 as the anodes enabled Sony in 1990 to commercialize LiBs with LiCoO2 cathodes and graphite anodes.
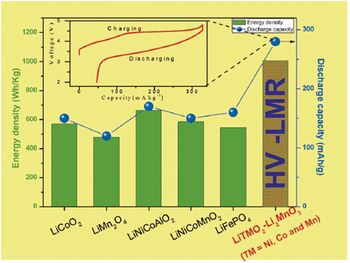
The intrinsic properties of crystalline oxide materials are always dependent on the atomic rearrangement of atoms in the unit cell of the crystals. Reference Julien, Mauger, Zaghi and Groult25,Reference Mohanty, Huq, Andrew Payzant, Sefat, Li, Abraham, Wood and Daniel26 TM oxides with layered structures (e.g., LiMO2, where M = Co, Mn, Ni), spinel (e.g., LiMn2O4), and olivine (e.g., LiFePO4) are so far the most attractive and widely used cathode materials in LiBs. Reference Julien, Mauger, Zaghi and Groult25,Reference Manthiram27 LiBs in an EV should have the ability to deliver high power and maintain high energy density throughout the operation condition. High-energy-density LiBs are indispensable for propelling the electric motor in an EV. Certain limitations in the oxide cathodes, such as higher cost and safety concerns in LiCoO2, Reference Huang, Jang, Chiang and Sadoway28 manganese ion dissolution in LiMn2O4, Reference Wang, Ou, Striebel and Chenc29 and the low voltage of LiFePO4, Reference Padhi, Nanjundaswamy and Goodenough30 prohibit them from being considered in LiBs for EV applications. Most importantly, the practical capacities and operating voltage (energy density) of the cathodes are not adequate for use in high-energy-density LiBs for EVs. For example, LiNi1/3Co1/3Mn1/3O2 delivers 150 mA h/g cycled between 2.5 and 4.2 V and close to 200 mA h/g when charged to 4.6 V. Due to limited capacity at high potential (voltage), the above lithium stoichiometric oxides cannot deliver a rechargeable capacity of ∼250 mA h/g (Fig. 2), a condition, which is more appropriate for high-energy-density LiBs. Reference Yu, Shikawa, So, Shibata, Kudo, Zhou and Ikuhara31 However, research on these oxides reveals that tetravalent manganese ions in the structure usually play an important role in stabilizing the structure, and the lithium ions present in the structure are directly related to discharge capacity. One approach was to produce material with an excess of lithium-based manganese oxide systems to obtain the higher discharge capacity while maintaining the structural stability at high voltage. Reference Lu, MacNeil and Dahn32 In that regard, structurally integrated Li2MnO3-stabilized composite structures [i.e., “layered–layered” xLi2MnO3·(1 − x)LiMO2 (M = Mn, Ni, Co)] provides hope for fabricating high-energy-density LiBs. Reference Thackeray, Johnson, Vaughey, Li and Hackney33 In a simple way, these materials can also be represented as lithium-rich Li1+y M1−y O2 (M = Co, Mn, Ni) oxides or High-Voltage Lithium-Manganese-Rich oxides (HV-LMR, see “The importance of materials diagnosis in the development of HV-LMR oxides”) oxides. These structures are promising and deliver reversible discharge capacities between 200 and 250 mA h/g within the voltage window of 2.0–4.6 V (versus Li+), which makes them excellent cathode candidates for high-energy-density LiBs. Reference Yu, Shikawa, So, Shibata, Kudo, Zhou and Ikuhara31,Reference Sathiya, Rousse, Ramesha, Laisa, Vezin, Sougrati, Doublet, Foix, Gonbeau, Walker, Prakash, Ben Hassine, Dupont and Tarascon34 However, these oxides are not practically feasible because of several serious issues, as explained in section “HV-LMR oxides: Structure, function, and issues.”
Energy density of different layered, spinel, and olivine type cathode structures. HV-LMR shows the highest reversible discharge capacity. Inset shows the first cycle charge–discharge curves and the activation of Li2MnO3 phase beyond 4.5 V charging of HV-LMR oxide. Reproduced from H. Yu, R. Shikawa, Y-G. So, N. Shibata, T. Kudo, H. Zhou, Y. Ikuhara: Direct atomic-resolution observation of two phases in the Li1.2Mn0.567Ni0.166Co0.067O2 cathode material for lithium-ion batteries. Angew. Chem. 52, 5969 (2013). Copyright © 2013 [copyright owner as Angewandte Chemie], http://onlinelibrary.wiley.com/doi/10.1002/anie.201301236/abstract.

The importance of materials diagnosis in the development of HV-LMR oxides
Materials diagnostics are essential to understanding and solving the problems that occur in lithium-based cathode oxides. Figure 3 shows an example of road map of the evolution of cathode structures (specifically for “layered” structures) and composition that has occurred in last decades. It is valid to argue that progress from the first commercially available lithium-based layered cathode material (LiCoO2) to the latest HV-LMR oxide [Li1+x M1–y O2 (M = Co, Mn, Ni)] was not a single-step discovery; it involved multiple steps where issues were identified and solved based on the requirements. LiCoO2 presents a number of problems: (i) it has a limited practical capacity (≤150 mA h/g); (ii) the cobalt is toxic and expensive; and (iii) the material undergoes a phase transformation after 50% of the lithium is removed from the structure during charging, which decreases the performance in later charge–discharge cycles. Reference Xu, Qian, Wang and Meng35 To solve the problem of toxicity, nickel was used in place of Co to produce LiNiO2. Reference Ohzuku, Ueda and Nagayama36 However, synthesizing pure LiNiO2 proved to be a difficult task, and it was difficult to avoid the formation of additional phases such as NiO2 in the structure during synthesis. Reference Besenhard37,Reference Hirano, Kanno, Kawamoto, Yamaura, Takano, Ohyama, Ohashi and Yamaguchi38 Therefore, researchers replaced 50% of Ni in LiNiO2 with Mn to produce LiNi0.5Mn0.5O2. Reference Ohzuku and Msakimura39 However, performance became poor after a certain number of cycles due to “Li/Ni disorder” in the structure. Reference Yabuuchi, Kumar, Li, Kim and Shao-Horn40 The Li/Ni disorder was stabilized by the addition of Co to the structure, forming LiNi0.33Mn0.33Co0.33O2 (NMC-type), which is currently one of the state-of-the-art oxide cathodes for LiBs. NMC delivers relatively low discharge capacity [∼160 mA h/g at 4.2 V as upper cutoff voltage (UCV)] and cannot be operated at high operating voltages (∼4.7 V). Reference Ohzuku and Makimura41,Reference Kang, Shirley Meng, Bréger, Grey and Ceder42 Thanks to intensive materials diagnostics (see Fig. 3), the scientific community uncovered these underlying problems in the Li-based oxide cathode materials and thus could propose routes to their improvement (Ref. Reference Nazri and Pistoia43 and references therein). The energy density of an LiB can be increased by increasing the specific capacity and the average voltage (energy density = specific capacity × average voltage). In 2001, Dahn Reference Lu, MacNeil and Dahn32 and in 2005, Thackeray and co-workers synthesized HV-LMR NMC [Li1+x M1−x O2 (M = Co, Mn, Ni)], a unique composition that has excess Li and Mn in the layered NMC structure, that shows a remarkably high capacity (∼250 mA h/g), and that can be operated at ∼4.7 V (with Li0/Li+). Reference Thackeray, Johnson, Vaughey, Li and Hackney33,Reference Johnson, Li, Lefief, Vaughey and Thackeray44–Reference Jiang, Key, Meng and Grey46
The road map from layered LiCoO2 to layered NMC and layered–layered composite HV-LMR oxides showing how different materials diagnostics techniques could help understanding the problems in cathode oxides. Note: this is an example for demonstration purpose.

HV-LMR oxides: Structure, function, and issues
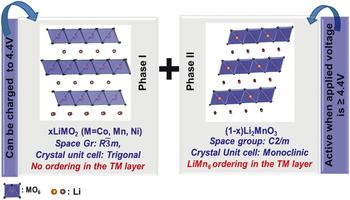
The structure of HV-LMR compounds is quite complex as compared to the structure of lithium stoichiometric oxide (NMC) systems. The parent HV-LMR structure can be derived from the layered LiMO2 with α-NaFeO2 structure having a trigonal lattice or rhombohedral symmetry (O3 phase); the excess lithium ions present in the structure occupy the transition metal (TM) layer, filling all the octahedral sites of cubic close-packed (ccp) oxygen arrays. The presence of lithium ions in the TM layer generates the cation ordering of Li+ with the Mn4+ ions that leads to formation of a second Li2MnO3 phase Reference Meng, Ceder, Grey, Yoon, Jiang, Bréger and Shao-Horn47 (see Fig. 4).
Composite structure of HV-LMR oxide: Phase 1, layered LiMO2 trigonal phase and phase II, layered Li2MnO3 monoclinic phase.

LiMO2 and Li2MnO3 structures have similar closed-packed layers having interlayer spacing of ∼4.7 Å [(001) for layered monoclinic and (003) for layered trigonal], which allows perfect integration of these structures at an atomic level to form a Li1+y M1−y O2 (M = Co, Mn, Ni) “layered–layered” integrated structure represented as xLiMO2·(1 − x)Li2MnO3. Reference Thackeray, Johnson, Vaughey, Li and Hackney33 During charging up to ∼4.5 V, the lithium ions are extracted from the lithium layers of the parent structure without excessively destroying the LiMn6-type ordering in the TM layers of Li2MnO3 phase. When charged beyond 4.5 V, the Li2MnO3 becomes active, and lithium ions are extracted from the TM layers, destroying the LiMn6-type ordering, increasing overall capacity. Reference Lu, Wu and Dees48
There is no doubt about these HV-LMR oxides being potential cathode candidates in the high-energy-density LiBs for EV applications. However, certain stumbling blocks prohibit their practical use: (i) depreciation of the energy density: after certain number of charge–discharge cycles, the discharge voltage profile shifts to a lower voltage profile, causing “voltage fade” in the LiB, which reduces the energy density of the systems Reference Gallagher, Croy, Balasubramanian, Bettge, Abraham, Burrell and Thackeray49,Reference Bettge, Li, Gallagher, Zhu, Wua, Lu, Bloom and Abraham50 ; (ii) low columbic efficiency: during first-cycle charging, an observed loss of ∼50–70 mA h/g capacity reduces the columbic efficiency to ∼80% (Ref. Reference Deng and Manthiram51); and (3) impedance rise during HV hold: during HV hold (∼4.5 V), the impedance rises, which shows the instability of oxides during HV hold. Reference Mohanty, Sefat, Kalnaus, Li, Meisner, Abraham, Payzant, Wood and Daniel52
These adverse effects may be caused by two possible mechanisms by which the pristine structure is altered: (i) as lithium ions shuttle across the electrodes during charge–discharge cycle, they might not come back to the original crystallographic sites and might occupy some foreign available sites, and (ii) TM ions might migrate from the original sites to the available vacancies. Reference Armstrong, Holzapfel, Novak, Johnson, Kang, Thackeray and Bruce53 Alterations made by these processes to the structure in the host HV-LMR lattice might block the Li diffusion pathways, increase the cell resistance, and eventually cause the adverse effects. To identify the changes that modify and degrade structure and to obtain insights into these structural changes, it is necessary to understand the structure and structural degradation mechanism and to address the adverse effects that they cause.
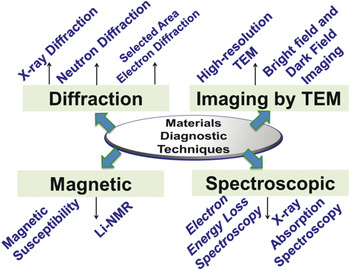
In recent literature, there are excellent reviews on HV–LiB “layered” cathode structures and structure-electrochemical property correlation along with the technological reviews. Reference Yu and Zhou54–Reference Hu, Pang and Zhou58 The goal of this review is to provide understanding of the structure and structural degradation mechanisms in context of material diagnostics toward elucidating the reasons preventing LMR oxides from being usable in high-energy-density LiBs. In sections “Understanding the structure and structural degradation in HV-LMR oxides” and “Other advanced diagnostic techniques,” we show how a number of techniques, including advanced in situ techniques, were important to revealing the structure and structural degradation mechanisms of HV-LMR oxides (see Fig. 5). They include a variety of diffraction techniques, transmission electron microscopy (TEM), scanning transmission electron microscopy (STEM), spectroscopy, and magnetic methods. In section “Mechanisms of structural degradation in HV-LMR oxides,” we summarize the structural and structural-degradation mechanisms based on these studies. In section “Challenges and outlook,” we provide the prospects for establishing methods that enhance the performance of HV-LMR oxides.
Different materials diagnostic techniques that are discussed in this review to understand the structure and structural degradation mechanisms in HV-LMR oxides.

Understanding the structure and structural degradation in HV-LMR oxides
Diffraction
Diffraction is one of the most important techniques used to understand the structure and structural degradation mechanisms for the oxides in LiB electrodes. Diffraction from an oxide may refer to x-ray, electron, or neutron diffraction (ND), depending on the source. X-ray powder diffraction (XRD) has remained most facile technique and is an outstanding tool for gathering structural information on oxides. Three attributes of XRD lines make it possible to derive several types of information Reference Zolotoyabko59 about LiB oxides:
-
• the angular position provides information about the geometry and the arrangement (crystal structure) of the unit cells;
-
• the intensity provides information about the atom types, the particle orientation, and/or the crystallinity of the sample; and
-
• the shape indicates the instrument broadening or particle size of the crystals.
Like XRD, ND has made important contributions to what is known about a wide range of oxide materials that are technologically important for LiB applications. Reference Shioya60 ND is more useful for studying the lithium vacancies, interlayer or intralayer cation exchange, phase percentage, and oxygen vacancies of the oxides that are used in the LiB chemistry. Reference Whitfield, Davidson, Stephens, Cranswick and Swainson61 Similar information can be gathered by both; however, because ND scatters from the nucleus of an atom and x-ray scatters from the electron cloud, ND is useful for studying the structure and dynamics of a material simultaneously. Neutrons have a high penetration depth and are particularly sensitive to lower z elements (e.g., Li and O), which have large neutron scatting cross sections. Thus it is useful for locating lighter atoms in the presence of heavier atoms, and in the case of LiB oxides, makes it possible to get more accurate structural information about lithium in a TM ion environment. Reference Bennigton62
Selected-area electron diffraction (SAED) is very helpful to understanding crystallographic orientation and planes to obtain the details of crystal structure. Like XRD and ND, SAED can distinguish between single-crystalline and polycrystalline samples. Unlike XRD or ND, which obtain bulk (averaged) structural information, SAED can obtain phase/structural information from an individual particle having an area as low as 1–2 μm. Reference Williams and Carter63
In the next paragraphs in this section we will present how these diffraction techniques were used to understand the structure and structural degradation mechanisms in HV-LMR oxides during charge/discharge cycles.
In early 1990s XRD was first utilized to differentiate between the structures of LiCoO2 compounds (the first commercially available oxide cathode for LiB, introduced by Sony Corporation). Depending on the synthetic conditions, LiCoO2 is crystallized in a layered trigonal (space group:
 $R\bar 3m$
) phase called “high-temperature” (HT) LiCoO2, or a layered spinel (space group:
 $Fd\bar 3m$
) compound called “low-temperature” (LT) LiCoO2.
Reference Gracia, Farcy and Pereira-Ramos64
The major difference in XRD patterns between HT and LT LiCoO2 is the splitting of (108) and (110) peaks in the HT phase, which is not observed for the LT compound.
Reference Gummow, Thackeray, David and Hull65,Reference Rossen, Reimers and Dahn66
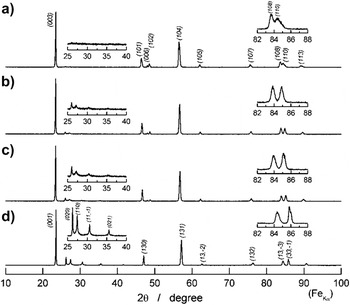
XRD is an important tool for obtaining the structure of HV-LMR oxides. Cation ordering between lithium and TM ions (e.g., LiMn6) is examined by the observation of low-intensity peaks at lower 2-theta regions in the XRD patterns of HV-LMR oxides. Reference Koga, Croguennec, Mannessiez, Menetrier, Weill, Bourgeois, Duttine, Suard and Delmas67–Reference Bregera, Jianga, Dupre, Meng, Horn, Cederc and Grey70 Those lattice lines are an indication of the presence of a second monoclinic LiMn2O3 phase in the HV-LMR oxides. Several researchers have correlated the intensity of the ordering peaks with the Li2MnO3 phase percentage Reference Ohzuku, Nagayama, Tsuji and Ariyoshi71 (i.e., a higher percentage of the Li2MnO3 phase correlates with greater intensity of the ordering peaks (Fig. 6).
X-ray diffraction of HV-LMR oxide with composition (1 − x)LiMO2·xLi2MnO3 where x= 0 (a), 1/2 (b), 1/3 (c), 1 (d). The cation ordering peaks become more pronounced with an increase in the Li2MnO3 component. Reference Ohzuku, Nagayama, Tsuji and Ariyoshi71 Reproduced from J. Mater. Chem. 21, 10179 (2011) with permission from The Royal Society of Chemistry.

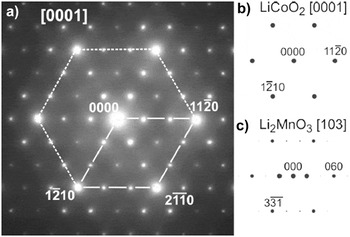
Researchers also reported detecting the presence of LiMn6 cationic ordering (i.e., the presence of a monoclinic phase) by employing the SAED method. Reference Wen, Bareno, Lei, Kang, Balasubramanian, Petrov and Abraham72 Generally, the result of SAED applied to an HV-LMR oxide particle contains two sets of reflections when collected along the [0001] zone axis (Fig. 7). Reference Bareño, Balasubramanian, Kang, Wen, Lei, Pol, Petrov and Abraham73 The bright fundamental reflections that represent the layer trigonal phase constitute the first set; the second set comprises the faint reflections that are sometimes observed half-way between two fundamental reflections (referred as “superlattice reflections” or “triplets”). These faint reflections indicate the presence of the LiMn6 cationic ordering that arises from the second monoclinic phase. Some authors also pointed out a third set of reflections (termed “forbidden reflections”) in the SAED pattern obtained from HV-LMR oxide particles. The third set indicates interlayer mixing and/or a stacking fault in the crystal. Reference Mohanty, Kalnaus, Meisner, Rhodes, Li, Payzant, Wood and Daniel74
SAED from HV-LMR oxide showing the overlapping of diffraction spots from layered LiMO2 trigonal and layered Li2MnO3 monoclinic phase (a). (b) and (c) show the simulated pattern from LiMO2 and Li2MnO3 that matches with the experimental pattern. Reference Bareño, Balasubramanian, Kang, Wen, Lei, Pol, Petrov and Abraham73 Reprinted with permission from Chem. Mater. 23, 2039 (2011). Copyright (2011) American Chemical Society.

Recently, based on the results obtained by using SAED and STEM, Yu et al. reported the presence of two phases in HV-LMR oxide (see section “Other advanced diagnostic techniques” for STEM results). The authors noted that the SAED from the examined particle consisted of reflections from [100]rh from the trigonal phase and [010]mon from the monoclinic phase. The observed patterns are in agreement with simulated SAED patterns. In agreement with other reports, the authors also observed “streaks” along c*-axis, which they attribute to the presence of cation ordering and the high density of the stacking fault in the platelet.
SAED clearly indicates the presence of two phases (monoclinic, and trigonal); however, Jarvis et al. recently utilized a novel diffraction technique, diffraction scanning transmission electron microscopy (D-STEM) to prove that, on the nanoscale, there is no separation between the two phases; however, a solid solution exists. Reference Jarvis, Deng, Allard, Manthiram and Ferreira68 The D-STEM images collected at different regions of a single crystal show diffraction spots that resemble a monoclinic phase with significant planar defects along (001) planes.
While XRD and SAED provided the structure of the HV-LMR oxides, ND was utilized to obtain detailed information about the crystallographic structure.
Reference Whitfield, Davidson, Cranswick, Swainson and Stephens75,Reference Liu, Fell, An, Cai and Meng76
Evidence obtained by ND analysis of interlayer mixing of Li and Ni in HV-LMR oxides was reported recently.
Reference Mohanty, Huq, Andrew Payzant, Sefat, Li, Abraham, Wood and Daniel26
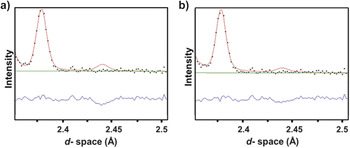
The Rietveld refinement of the experimental diffraction pattern showed that (3 ± 1)% of the Li ions replace the Ni in the TM layer, and vice versa. By adding 3% of cation mixing in the model, the authors could see the significant agreement between the experimental and calculated pattern (Fig. 8), which was in agreement with results reported by Liu et al.
Reference Liu, Fell, An, Cai and Meng76
In this work,
Reference Mohanty, Huq, Andrew Payzant, Sefat, Li, Abraham, Wood and Daniel26
a two-phase model was used to refine the final structure. Liu et al.
Reference Liu, Fell, An, Cai and Meng76
used single phase model (
 $R\bar 3m$
trigonal phase) to solve the HV-LMR oxide structure.
ND shows the model without Li/Ni interchange in phase I in the HV-LMR oxide structure (a) and with 3% Li/Ni interchange in the HV-LMR oxide structure (b). (b) shows the good agreement with the calculated model (red line) and the experimental pattern (black dots). Reference Mohanty, Huq, Andrew Payzant, Sefat, Li, Abraham, Wood and Daniel26 Reprinted with permission from Chem. Mater. 25, 4064–4070 (2013). Copyright (2013) American Chemical Society.

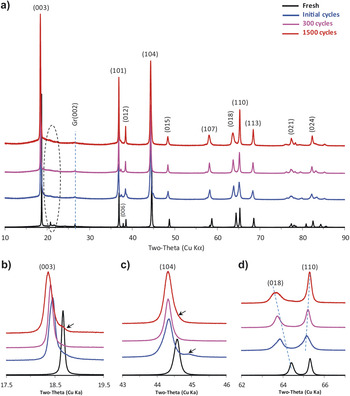
Diffraction is also an important tool for obtaining the structural changes in the HV-LMR oxides after charge–discharge cycles. Many researchers who have used XRD to track the existence and/or disappearance of the cationic ordering peaks after cycling have found out that when the LiB is charged to a high cutoff voltage (≥4.5 V), Reference Mohanty, Sefat, Li, Meisner, Rondinone, Payzant, Abraham, Wood and Daniel77–Reference Koga, Croguennec, Menetrier, Douhil, Belin, Bourgeois, Suard and Weill79 the cationic ordering peaks disappear and indicate the “activation” of the monoclinic Li2MnO3 phase. Li et al. Reference Li, Bettge, Polzin, Zhu, Balasubramanian and Abraham80 collected XRD patterns after 1500 cycles (Fig. 9) and observed the disappearance of cationic ordering. The activation process destroys the cationic ordering in the structure and provides the routes for structural rearrangement. In the literature, the changes in the lattice parameters were tracked to understand the structure after several cycles. Li et al. Reference Li, Bettge, Polzin, Zhu, Balasubramanian and Abraham80 (Fig. 9) observed the shifting of (003) peak positions toward lower d-spacing, which indicates the lattice expansion along c*-axis after charge–discharge cycles. They also reported the separation of (110) and (108) after cell cycling. The shifting of the peaks toward lower 2-theta indicates the presence of vacancies; shifting toward high 2-theta indicates the presence of ions having smaller effective ionic radii, such as Ni3+ (0.56 Å) and/or Ni4+ (0.48 Å), that are smaller than the Ni2+ (0.69 Å).
X-ray diffraction data from pristine (fresh) HV-LMR oxide electrodes and electrodes harvested from cells after initial cycles, 300 cycles, and 1500 cycles (a). (b), (c), and (d) are expanded views of (a). Locations of the Li2MnO3-like (phase II) peaks are indicated by the dashed areas in (a). Reference Li, Bettge, Polzin, Zhu, Balasubramanian and Abraham80 Minor peaks, arising from an unidentified species, are marked by arrows in (b) and (c). Reproduced with permission from J. Electrochem. Soc. 160, A3006 (2013). Copyright 2013, The Electrochemical Society.

SAED has provided the clear indication of structural rearrangement/transformation (Fig. 10). Ito et al.
Reference Ito, Shoda, Sato, Hatano, Horie and Ohsawa81
monitored the change in diffraction spot patterns in the SAED collected from HV-LMR oxide particles as function of different state of charges. They observed a “three-times-periodicity” (cation ordering in the TM layer) along the
 $\left[ {10\bar 10} \right]$
zone axis in the SAED pattern at the 4.5 V charged state. That eventually disappeared at 4.8 V and again reappeared at the 2.0 V discharged state. Ito et al. also observed new spots, which they called “two-times periodicity” at the 4.5 V charged state. The intensity of the spots increases at the 4.8 V charged state, and the spots remain at the 2.0 V discharged state. The appearance of two-times periodicity is an indication of a spinel-phase framework structure. Therefore, the study by Ito et al.
Reference Ito, Shoda, Sato, Hatano, Horie and Ohsawa81
was able to show that a “layered-spinel” phase structural rearrangement happens in the domains of several crystals after the first charge–discharge cycle.
SAED patterns taken from along the
 $\left[ {10\bar 10} \right]$
zone axis of HV-LMR oxide during the first cycle charging plateau region at 4.5 V (a), the fully charged state at 4.8 V (b), and the fully discharged state at 2.0 V (c). The upward and downward arrows in (a), (b), and (c) indicate the two-times periodicity and the three-times-periodicity, respectively.
Reference Ito, Shoda, Sato, Hatano, Horie and Ohsawa81
Reprinted from Ito et al.: Direct observation of the partial formation of a framework structure for Li-rich layered cathode material Li[Ni0.17Li0.2Co0.07Mn0.56]O2 upon the first charge and discharge. J. Power Sources
196. 4785, Copyright (2011), with permission from Elsevier.

SAED was also used to track the structural changes after several (∼125) cycles, where the loss of cation ordering peaks and the appearance of “spinel” peaks were found after several charge–discharge cycles. Reference Mohanty, Sefat, Li, Meisner, Rondinone, Payzant, Abraham, Wood and Daniel77
There are very few reports of ND being applied to HV-LMR oxides after charge–discharge cycles. Reference Mohanty, Li, Abraham, Huq, Andrew Payzant, Wood and Daniel82 ND was very important for studying oxygen loss (from the surface) during charging. Armstrong et al. Reference Armstrong, Holzapfel, Novak, Johnson, Kang, Thackeray and Bruce53 discovered the oxygen loss from the HVLMR oxide after charging it to a certain voltage. ND diffraction results (combined with results of in situ differential electrochemical mass spectrometry), by Armstrong et al. Reference Armstrong, Holzapfel, Novak, Johnson, Kang, Thackeray and Bruce53 showed the detailed mechanism of structural rearrangement during the first HV (∼4.8 V) charging cycle. Armstrong et al. demonstrated a mechanism that involves simultaneous removal of lithium and oxygen from the surface, in the form of Li2O, when being charged across 4.5 V. The removal of oxygen is accompanied by the migration/diffusion of TM ions from the surface into the bulk material and their occupation of octahedral sites in the lithium layer. Beyond the normal intercalation limit (∼4.5 V), the Fermi level is situated in the oxygen valence band and triggers the electron removal from O2− species. Based on results obtained by employing ND, we recently proposed a cation migration mechanism that is responsible for the transformation of a layered phase to a spinel phase in HV-LMR oxides. Reference Mohanty, Li, Abraham, Huq, Andrew Payzant, Wood and Daniel82
Imaging by transmission electron microscope
“Imaging” by TEM refers to either bright field (BF) or dark field (DF) imaging by high-resolution TEM (HR-TEM) or by STEM. In this section, we highlight some of the prominent applications of BF/DF and HR-TEM to obtain insights into the structure and structural degradation mechanisms in HV-LMR oxides (see section “Other advanced diagnostic technique” for a discussion of STEM as an advanced diagnostic technique).
In a TEM, electrons that come from the condenser system are scattered by the sample, which is situated in the object plane of an objective lens. Electrons scattered in the same direction are focused in the back focal plane, and, as a result, a diffraction pattern is formed. Electrons coming from the same point of the object are focused in the image plane. In the BF mode of a TEM (an aperture placed in the back focal plane of the objective lens) allows only the direct beam to pass. In this case, the image results from a weakening of the direct beam by its interaction with the sample. Therefore, mass thickness and diffraction contrast contribute to image formation. Thick areas, areas in which heavy atoms are enriched, and crystalline areas appear with dark contrast. Reference Heimendahl83
In DF images, the direct beam is blocked by the aperture while one or more diffracted beams are allowed to pass the objective aperture. Since the diffracted beams have strongly interacted with the specimen, very useful information is present in DF images (e.g., information about planar defects, stacking faults, or particle size). Lattice images require the selection of a large objective aperture that allows many beams, including the direct beam, to pass. The image is formed by the interference of the diffracted beams with the direct beam (phase contrast). If the point resolution of the microscope is sufficiently high and a suitable crystalline sample is oriented along a zone axis, then HR-TEM images are obtained. In many cases, the atomic structure of a specimen can directly be investigated by HR-TEM. Reference Williams and Carter63
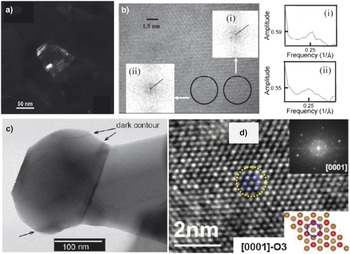
The HV-LMR oxide is a composite of layered trigonal and layered monoclinic phases. Amalraj et al. Reference Amalraj, Talianker, Markovsky, Sharon, Burlaka, Shafir, Zinigrad, Haik, Aurbach, Lampert, Schulz-Dobrick and Garsuchc84 showed a typical BF image of an HV-LMR oxide, demonstrating the polycrystalline nature of the xLi2MnO3 (1 − x)Li[Mn y Ni z Co w ]O2 material, which consists of primary nanoparticles in the 50–100 nm range agglomerated to secondary, spherical particles with D50 of about 15 μm. Amalraj et al. Reference Amalraj, Talianker, Markovsky, Sharon, Burlaka, Shafir, Zinigrad, Haik, Aurbach, Lampert, Schulz-Dobrick and Garsuchc84 collected a corresponding DF (Fig. 11a) image that was taken from the monoclinic reflection (3.17 Å) associated with the streak (in SAED pattern) Reference Soo Kim, Johnson, Vaughey, Thackeray, Hackney, Yoon and Grey85 and proved that presence of streaks in selected area diffraction patterns indicates that the particles are apparently built of very thin (40–50 Å) plates of monocrystalline components, presumably monoclinic, and rhombohedral phases. The lattice fringes between these two phases cannot be distinguished in an HR-TEM micrograph of a representative HV-LMR oxide particle, the reason being that the distance between two lattice fringes is ∼4.7 Å, which is attributed to either the presence of (003) planes from the trigonal phase or (001) planes from the monoclinic phase. Kim et al. Reference Soo Kim, Johnson, Vaughey, Thackeray, Hackney, Yoon and Grey85 analyzed local fast Fourier transformation (FFT) from different regions (Fig. 11b) and determined the ratio of structure factor of region (i) to region (ii) to be 1.09 ± 0.01, which provided the evidence of structural inhomogeneity at the nanometer scale.
(a) DF image taken from a HV-LMR oxide particle, having taken into consideration the monoclinic reflection (3.17 Å) associated with the streak. Reference Amalraj, Talianker, Markovsky, Sharon, Burlaka, Shafir, Zinigrad, Haik, Aurbach, Lampert, Schulz-Dobrick and Garsuchc84 Reproduced with permission from J. Electrochem. Soc. 160, A324 (2013). Copyright 2013, The Electrochemical Society. (b) HR-TEM image of HV-LMR oxide formed using phase contrast from superlattice peaks and fast Fourier transforms (inset) from adjacent areas (i) and (ii) to emphasize the spatial variation in the superlattice order parameter. Reference Soo Kim, Johnson, Vaughey, Thackeray, Hackney, Yoon and Grey85 Reprinted with permission from Chem. Mater. 16, 1996 (2004). Copyright (2004) American Chemical Society. (c) Bright-field image of a HV-LMR nanoparticle showing a “dark counter,” indicating a compositional variation. Reference Gu, Genc, Belharouak, Wang, Amine, Thevuthasan, Baer, Zhang, Browning, Liu and Wang86 Reprinted with permission from Chem. Mater. 25, 2319 (2013). Copyright (2013) American Chemical Society. (d) HR-TEM showing hexagonal arrangement of atoms in a trigonal host unit cell. Reference Mohanty, Sefat, Li, Meisner, Rondinone, Payzant, Abraham, Wood and Daniel77 Physical Chemistry Chemical Physics 2013, 15, 19496, Reproduced by permission of the PCCP Royal Society of Chemistry.

Recently, Gu et al. Reference Gu, Genc, Belharouak, Wang, Amine, Thevuthasan, Baer, Zhang, Browning, Liu and Wang86 reported a BF image of HV-LMR oxide and found “dark contours” caused by the diffraction contrast due to possible small orientational or compositional differences in the HV-LMR oxides (Fig. 11c). Song et al. Reference Song, Liu, On Lai and Lu87 reported HR-TEM on this class of materials. The authors identified typical (111) crystal planes of the Li2MnO3 phase, which was in agreement with the FFT and the lattice schematic. In our own work, Reference Mohanty, Sefat, Li, Meisner, Rondinone, Payzant, Abraham, Wood and Daniel77 we reported the O3 type lattice when a HV-LMR oxide particle was oriented in [0001] zone axis, which was in agreement with the presence of the host trigonal lattice (Fig. 11d).
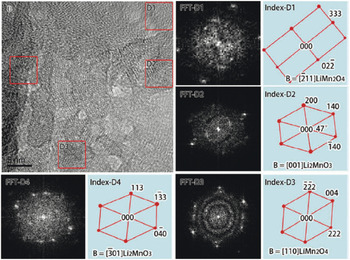
TEM imaging has also been utilized to obtain structural degradation information on HV-LMR oxides. In fact, Song et al. Reference Song, Liu, On Lai and Lu87 showed that after long-term cycling, an amorphous layer of about 1–2 nm thickness is built up on the HV-LMR oxide particles (Fig. 12). As compared to the surface microstructure, the microstructure in the inner region is inherently complex and short-range ordered. In that work, FFT was also applied to different regions of the HR-TEM and two structures of the Li–Mn–O ternary phase were found. Based on the FFT results, the authors concluded that, after cycling, the HV-LMR oxides transform to spinel-like LiMn2O4 in the nanodomains and that, together with the Li2MnO3 matrix, the spinel-like phase is integrated into a complex structure (Fig. 12). The HV-LMR oxides to which Ru was added showed the formation of a mixed spinel phase (i.e., cubic LiMn2O4 and tetragonal Li2Mn2O4, where the distorted tetragonal spinel nanodomain is integrated with the transformed LiMn2O4 spinel).
HR-TEM showing a short-ordered transformed spinel-like phase with the untransformed nanodomains of the bulk region in the same particle of HV-LMR oxide. FFT was applied to the marked areas (indexed). Reference Song, Liu, On Lai and Lu87 Phys. Chem. Chem. Phys. 14, 12875 (2012), Reproduced by permission of the PCCP, Royal Society of Chemistry.

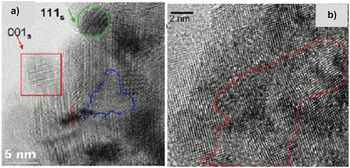
Evidence of an LiMn2O4 cubic spinel phase formation after long-term cycling of HV-LMR oxides was also reported in HR-TEM used by several authors. Gu et al. Reference Gu, Belharouak, Zheng, Wu, Xiao, Genc, Amine, Thevuthasan, Baer, Zhang, Browning, Liu and Wang88 (see Fig. 13) reported that, after a 300 charge–discharge cycles, LiMn2O4 spinels having facets appeared on the surface regions. Their micrograph in the bulk region also revealed the presence of a cubic spinel phase. To track the formation of the cubic spinel phase during charge–discharge cycles, the authors collected HR-TEM images after 60 and 100 cycles. After 60 cycles, spinel domains oriented along [111] and [001] zone axes were separated by a distorted-lattice or amorphous phase along with dislocations.
(a) HR-TEM image of HV-LMR oxide after 60 cycles shows several nucleated spinel phase domains in different crystal orientations: [111] zone spinel (in the green circle) and [001] zone spinel (in the red square). The area outlined in blue is amorphous; the dashed lines indicate a dislocation in the particle. (b) HR-TEM image of HV-LMR oxide after 100 cycle shows lattice distortion (marked as red area). Reference Gu, Belharouak, Zheng, Wu, Xiao, Genc, Amine, Thevuthasan, Baer, Zhang, Browning, Liu and Wang88 Reprinted with permission from ACS Nano 7, 760 (2013). Copyright (2013) American Chemical Society.

Gu et al. Reference Gu, Belharouak, Zheng, Wu, Xiao, Genc, Amine, Thevuthasan, Baer, Zhang, Browning, Liu and Wang88 attributed the amorphous phase to the strains associated with cation migration during the charge–discharge cycle. This indicates that the original crystalline matrix breaks up into polycrystalline and amorphous regions during repeated (∼60) charge–discharge cycles. After 100 cycles, the spinel domains oriented along different zone axes, and there was a high degree of distortion in the phase boundaries of crystals with different orientations.
Based on a study of the HR-TEM data, it has also been speculated that a layered-to-spinel phase structural rearrangement could also take place in HV-LMR oxide during a HV (4.5 V) hold of several hours. In fact, the conclusion of that work showed that the structural transformation is also possible in a LiB half-cell if it is held at a constant voltage of 4.5 V. The structural evolution occurs even when there is no net current between the cathode and anode and no net lithium ions are shuttling between the electrodes. Reference Mohanty, Sefat, Kalnaus, Li, Meisner, Abraham, Payzant, Wood and Daniel52
Spectroscopic techniques (x-ray absorption and electron energy loss spectroscopy)
X-ray absorption
X-ray absorption spectroscopy (XAS) is a technique for measuring the linear absorption coefficient of a substance as function of incident photon energy in the x-ray regime. XAS includes the techniques of x-ray absorption fine structure (XAFS), which in turn includes both x-ray absorption near-edge spectroscopy (XANES) and extended x-ray absorption fine structure (EXAFS). XAFS is the modulation of x-ray absorption coefficient at the energies near and above the x-ray absorption coefficient. Details of the theory and mechanism of this technique can be found elsewhere. Reference Croy, Balasubramanian, Kim, Kang and Thackeray89 Here we note the kind of information that can be extracted from both XAFS techniques before presenting the results from XAFS when used on HV-LMR oxides. XANES data provide the information on the oxidation states and site symmetry whereas EXAFS data provide the information on the local coordination and near-neighbor atomic species. XAFS is carried out on HV-LMR oxides to get TM K-edge information. This technique can provide the information on a very localized scale (<1 nm). XAFS reveals element-specific characteristics that provide chemical, structural, and electronic information. These experiments are performed in synchrotron radiation sources with tunable and intense x-ray beams. Reference Croy, Balasubramanian, Kim, Kang and Thackeray89,Reference Koga, Croguennec, Ménétrier, Mannessiez, Weill, Delmas and Belin90
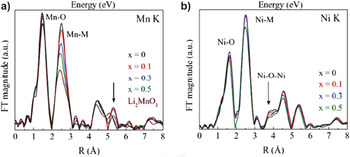
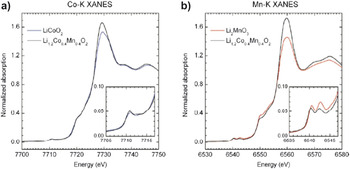
Croy et al. Reference Croy, Gallagher, Balasubramanian, Long and Thackeray91 reported XANES data obtained from reference samples Li2Mn4+O3 and Ni2+O from which they determined that the oxidation states of Mn is 4+ and Ni is 2+ in HV-LMR oxides (their HV-LMR oxides contained no Co) (Fig. 14). In another XANES study, which involved samples containing Co (LiCo3+ O2 as reference), Bareno et al. reported that the Co in the HV-LMR oxides attains a 3+ state (see Fig. 15). Reference Bareño, Balasubramanian, Kang, Wen, Lei, Pol, Petrov and Abraham73
Fourier transformed magnitudes of the Mn and Ni K-edge EXAFS of a HV-LMR oxide with a composition xLi2MnO3·(1 − x)LiMn0.5Ni0.5O2. Reference Croy, Gallagher, Balasubramanian, Long and Thackeray91 Reproduced with permission from J. Electrochem. Soc. 161, A318 (2014). Copyright 2014, The Electrochemical Society.

Normalized XANES spectra at the (a) Co K-edge and (b) Mn K-edge of HV-LMR oxide (black), LiMO2 (M = Co) (blue), and Li2MnO3 (red) samples. The insets contain a magnified view of the corresponding prepeak region. Reference Bareño, Balasubramanian, Kang, Wen, Lei, Pol, Petrov and Abraham73 Reprinted with permission from Chem. Mater. 23, 2039 (2011). Copyright (2011) American Chemical Society.

Several authors have reported the results of XANES experiments that were conducted to obtain the oxidation state of TM ions in pristine HV-LMR oxides. Reference Yu, Lyu, Gu, Wu, Bak, Zhou, Amine, Ehrlich, Li, Nam and Yang92,Reference Nurullah Ates, Mukerjee and Abraham93 They concluded that Mn, Co, and Ni are in the 4+, 3+, and 2+ state, respectively. Using EXAFS data, the authors showed that there is very little Ni in the lithium layer. Li et al. Reference Li, Bettge, Polzin, Zhu, Balasubramanian and Abraham80 found a pronounced peak at R ∼ 1.6 Å, corresponding to an M–O coordination and R ∼ 2.5 Å, which shows that the M is in second coordination shell. Most importantly, a peak at about 3.75 Å, which would indicate a 180° Ni–O–Ni correlation, was not distinct. That finding led the authors speculate that very little or no lithium–nickel interchange takes place in pristine HV-LMR oxides.
The presence of LiMn6-type ordering was also evidenced by EXAFS spectra. Reference Yu, Lyu, Gu, Wu, Bak, Zhou, Amine, Ehrlich, Li, Nam and Yang92 The magnitude of the Fourier-transformed manganese K-edge EXAFS data indicates major changes in the first-shell Mn–M (M = Mn, Ni) correlations at ∼2.5 Å (uncorrected for phase shift). This finding is consistent with decreasing Mn–M coordination as the Li2MnO3 content increases and reveals the preferential ordering of lithium and manganese (e.g., LiMn6, LiMn5Ni) in the TM layers, which drives the nearest-neighbor metal coordination number down. In Li2MnO3, these correlations arise from the scattering between manganese atoms of the hexagonal LiMn6 units within the TM layers.
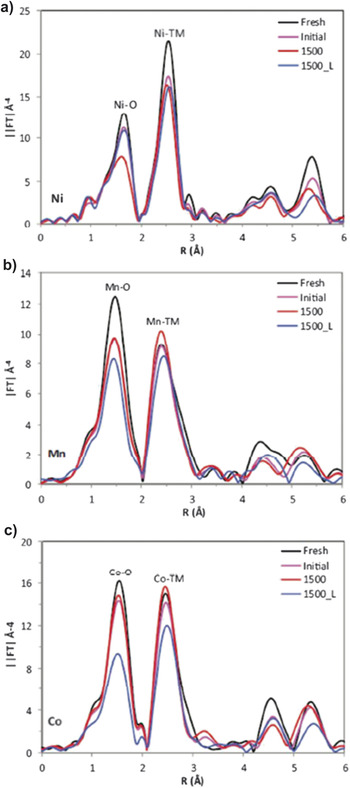
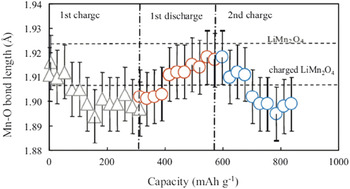
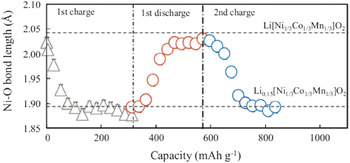
XAFS has been extensively used to understand the change in electronic structure and the local metal ion coordination after charge–discharge cycles. Li et al. Reference Li, Bettge, Polzin, Zhu, Balasubramanian and Abraham80 (Fig. 16) found that shifting of Ni K-edge in the XANES spectra after 1500 cycles indicates the presence of Ni3+/4+ in the structure (ideally, it should be Ni2+ for facile lithium ion transport). The increase in Ni oxidation states indicates the presence of lithium vacancies that are not filled up during lithiation (discharging). In the same work, the authors also found a change in electronic state by which the charge of Mn is reduced from 4+ to 3+ or 2+. The EXAFS data from Croy et al. Reference Croy, Gallagher, Balasubramanian, Long and Thackeray91 demonstrate that the Mn–O correlations at 1.5 Å decrease significantly due to the loss of oxygen and disorder in the structure after lithium intercalation and deintercalation. Their results also reveal a stable Ni ion environment and a decrease in Ni in the lithium layer (a slight decrease in the ∼3.5 Å peak) for a 50 charge–discharge cycle. Ito et al. Reference Ito, Sato, Sanada, Hatano, Horie and Ohsawa94 reported no change in Mn valence state during the first charge cycle; the Mn oxidation states were retained as 4+. To obtain deeper insight, the authors obtained the Mn K pre-edge absorption, which is a direct measurement of the valence state of the Mn ion. The authors concluded that Mn does not oxidize during charging because of the applied voltage window. However, during discharging, Mn is reduced from 4+ to 3.6+. The authors reported a striking observation that was made during the second charging cycle: Mn oxidized to 4+, indicating that Mn oxidation is reversible. The in situ EXAFS (Fig. 17) results also revealed a change in Mn–O bond length. During charging, the Mn–O and Ni–O bond lengths decrease and then increase during discharging, which indicates an Mn–O and Ni–O interaction in the lattice (Fig. 18).
XANES and EXAFS data at the Ni K-edge (a), Mn K-edge (b), and Co Kedge (c) for a fresh HV-LNR electrode (black) and for electrodes harvested from cells after initial cycles (magenta), and after 1500 cycles (red). The 1500_L data (blue) is from a “relithiated” 1500-cycle electrode. Reference Li, Bettge, Polzin, Zhu, Balasubramanian and Abraham80 Reproduced with permission from J. Electrochem. Soc. 160, A3006 (2013). Copyright 2013, The Electrochemical Society.

Mn–O bond length change estimated from in situ EXAFS measurements for an HV-LMR oxide during the first charge, the first discharge, and the second charge. Reference Ito, Sato, Sanada, Hatano, Horie and Ohsawa94 Reprinted from Ito et al.: In situ x-ray absorption spectroscopic study of Li-rich layered cathode material Li[Ni0.17Li0.2Co0.07Mn0.56]O2. J. Power Sources 196, 6828, Copyright (2011), with permission from Elsevier.

Ni–O bond length change in an HV-LMR oxide during first charge–discharge and second charge. The dotted lines show the Ni–O bond lengths reported in Ref. Reference Howell11 in the original article. Reference Ito, Sato, Sanada, Hatano, Horie and Ohsawa94 Reprinted from Ito et al.: In situ X-ray absorption spectroscopic study of Li-rich layered cathode material Li[Ni0.17Li0.2Co0.07Mn0.56]O2. J. Power Sources 196, 6828, Copyright (2011), with permission from Elsevier.

By using XAFS data, Ates et al. Reference Nurullah Ates, Mukerjee and Abraham93 reported that Mn produced from MnO2 after a charge is participating in a redox reaction. Both Mn from the LiMO2 and Li2MnO3 segments in 0.3Li2MnO30.7LiMn0.33Ni0.33Co0.33O2 have similar redox behavior during the first charge and discharge.
Electron energy loss spectroscopy
Electron energy-loss spectroscopy (EELS), a powerful technique for materials characterization at a nanometer spatial resolution, has been used in chemical microanalysis to deduce the oxidation states of TM ions. In EELS, the L-shell ionization edges of TM ions usually display sharp peaks at the near-edge region, which are known as “white lines.” For TMs with unoccupied 3d states, the transition of an electron from 2p state to 3d levels leads to the formation of white lines. The L 3 lines indicate the transitions from 2p 3/2 to 3d 3/2 and 3d 5/2; the L 2 lines indicate the transition from 2p 1/2 to 3d 3/2. Their intensities are related to the unoccupied states in the 3d bands. Therefore, the white line intensity ratio, L 3/L 2, provides information on the valence state of an individual TM ion. Reference Wang, Yin and Jiang95
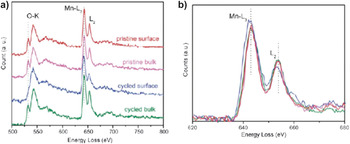
Xu et al. Reference Xu, Fell, Chi and Meng96 (see Fig. 19) reported that energy positions of Mn-L edges are almost identical on the spectra for the pristine surface, pristine bulk, and the first charge-discharge–cycled bulk. However, their results revealed that the Mn-L edge peak in the cycled surface area slightly shifts to a lower energy loss, indicating a decreased oxidation state of Mn after the first cycle, which is in agreement with the relatively higher L 3/L 2 white line ratio. Their results also showed the fine-structure modifications of O–K edges on the EELS spectrum from the cycled surface compared to the cycled bulk. They observed the vanishing of the first peak at an energy loss of ∼532 eV (attributed to the transition of the 1s core state to the unoccupied O-2p states hybridized with metal-3d states) on the spectrum from the cycled particle surface. The decreased intensity of this peak on the cycled surface likely indicates the modification of unoccupied states of TM-3d and TM–TM bonding lengths. In the same work, authors also obtained the EELS Li-K edge spectra where the lithium signal drops in the surface of the particle. Based on those results, together with the results of applying another technique (z-contract STEM), the authors speculated that TM ions migrated to the lithium layers on the surface of the particle. Reference Xu, Fell, Chi and Meng96
EELS spectra of the (a) O K-edge and (a and b) Mn L-edge from the surface and bulk of HV-LMR oxides in the pristine state and after the first cycle. Reference Xu, Fell, Chi and Meng96 Reproduced from Energy Environ. Sci. 4, 2223 (2011) with permission of The Royal Society of Chemistry.

In other work, Reference Mohanty, Sefat, Li, Meisner, Rondinone, Payzant, Abraham, Wood and Daniel77 it was shown that Mn is in the 4+ state in pristine HV-LMR oxides. A change in the oxidation state of Mn was not observed for samples cycled at 4.2 V (after 125 cycles); however, when cycled at 4.8 V, the value of L 3/L 2 increased, indicating that Mn is in the 3+ state after one cycle. That speculation, which was in agreement with the findings of the other authors, was based on the fact that the Fermi level is reconstructed after oxygen-ion removal in the HV charging process.
Magnetic techniques
Magnetic methods applied to the analysis of HV-LMR oxides are reviewed in this section. Magnetic methods are important tools for understanding the structure and structural degradation in HV-LMR oxides. Historically, three types of magnetic methods have been applied to the HV-LMR oxides: Li-nuclear magnetic resonance (Li-NMR), Reference Grey and Dupré97 magnetic susceptibility, Reference Chernova, Nolis, Omenya, Zhou, Lia and Whittingham98 and electron paramagnetic resonance. Temperature-dependent magnetization studies in field cooling (FC) and zero field cooling (ZFC) provide a detection limit of 10−6 electromagnetic units for the short-range magnetic amorphous and nanocrystalline phases that are expected to be found in structurally degraded cathode oxides, which are untraceable in diffraction data. Magnetization data, being sensitive to unpaired electrons from 3d TMs can detect the defects, formation of impure clusters, site interchange disorder, cation ordering, and oxidation-state changes after lithiation and delithiation processes. The magnetic ordering from the oxide cathode material is also dependent upon the nature of the crystallographic phase as well as the magnetic exchange coupling among the TM ions, which helps in determining the presence of any TM ions in the lithium layer and the location of dopants in the crystal unit cell. As an example, in the layered structure of [Li]3b [M]3a [O2]6c (M = Ni, Co, Mn), the presence of an Ni2+ in the 3b (lithium site) crystal site can be detected by the strong ferromagnetic (FM) exchange that occurs due to 180° FM coupling among [Ni2+]3b –O–[Mn4+]3a , whereas the 90° coupling among [Ni2+]3a –O–[Mn4+]3a is paramagnetic.
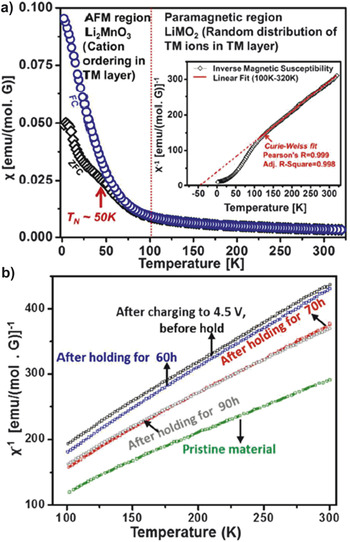
Recently, magnetic susceptibility has been used to resolve the composite structure of an HV-LMR oxide cathode. Reference Mohanty, Huq, Andrew Payzant, Sefat, Li, Abraham, Wood and Daniel26 The temperature-dependent magnetic susceptibility in FC and ZFC modes given on Fig. 20 can be divided into two regions. In the first region, the paramagnetic region (T ≥ 100 K), (Z) FC follows Curie–Weiss paramagnetic behavior. This paramagnetic interaction is due to the presence of randomly distributed M ions and confirms the presence of the LiMO2 phase in the composite structure of HV-LMR oxides. In the second region, (T ≤ 100 K), the magnetic susceptibility value increases, and eventually a bifurcation of FC and ZFC curves occurs at transition temperature (T N) ∼50 K, confirming a magnetic ordering in the structure that most likely originated from the Li2MnO3 phase.
(a) Temperature-dependent magnetic susceptibility of a pristine HV-LMR oxide showing two regions; paramagnetic, indicating the LiMO2 phase and AFM, indicating the Li2MnO3 phase. The inset shows the Curie–Weiss fit to the inverse magnetic susceptibility data to obtain the average oxidation states of M ions. Reference Mohanty, Huq, Andrew Payzant, Sefat, Li, Abraham, Wood and Daniel26 Reprinted with permission from Chem. Mater. 25, 4064–4070 (2013). Copyright (2013) American Chemical Society. (b) Plots of inverse magnetic susceptibility versus temperature show the different slopes during HV hold, indicating the change in redox centers of M ions during the holding process. Reference Mohanty, Sefat, Kalnaus, Li, Meisner, Abraham, Payzant, Wood and Daniel52 [J. Mater. Chem. A 1, 6249–6261 (2013)]—Reproduced by permission of The Royal Society of Chemistry.

In the Li2MnO3 phase, Li–Mn ordering creates an antiferromagnetic (AFM) ordering and causes the bifurcation of the FC and ZFC curves. Such a magnetic ordering is not possible in the case of only a layered trigonal phase (e.g., LiMO2), where Co, Mn, and Ni ions are randomly distributed in the M layer and FC and ZFC curves follows the same path in the experimental temperature range. The magnetic ordering in HV-LMR oxides confirms the presence of clusters of an additional phase, which was determined to be a Li2MnO3-like compound. To obtain additional evidence, one can calculate the Curie–Weiss temperature, θc, which was calculated as −41 K in this case. The negative value is an indication of the AFM nature of the material. Therefore the hypothesis was made that, in an Li2MnO3 phase, octahedral Mn4+ (d 3) shares edges and that a 90° Mn4+ (d 3)–O–Mn4+ (d 3) interaction is possible, which is strongly AFM.
The oxidation states of TM ions in pristine HV-LMR oxides can be determined from a comparison of the experimentally measured effective magnetic moments with the calculated theoretical magnetic moments by considering the magnetic moments of Ni2+, Mn4+/Mn3+, Co3+/Co4+ with high-spin (HS) and low-spin (LS) configurations in an octahedral (MO6) environment. Recently, the effective magnetic moments were calculated from the plot of inverse molar magnetic susceptibility versus temperature between 100 and 300 K [see inset in Fig. 20(a)] using the equation χm = C m/(T − θ), where χm is the molar magnetic susceptibility, C m is the Curie constant, and θ is the Weiss temperature. Reference Mohanty, Sefat, Kalnaus, Li, Meisner, Abraham, Payzant, Wood and Daniel52 The experimental effective magnetic moment was found to be 3.06µB for a pristine HV-LMR oxide that is a combination of 0.15 mol of Ni2+ (HS; S = 1), 0.55 mol of Mn4+ (HS; S = 3/2), and 0.1 mol of Co3+ (HS; S = 0) (which corresponds to a theoretical effective magnetic moment of 3.07 μB). Hence the composition of the pristine material can be written as Li1.2Ni2+(HS/LS)0.15 Mn4+(HS/LS)0.55Co3+(LS)0.1O2. Reference Mohanty, Sefat, Li, Meisner, Rondinone, Payzant, Abraham, Wood and Daniel77
Magnetic susceptibility was also used to understand the structural degradation in HV-LMR oxides. Based on magnetic susceptibility data, it was predicted that, after HV holding, oxygen is released together with a reduction of Ni4+ to Ni2+ for charge compensation. Reference Mohanty, Sefat, Kalnaus, Li, Meisner, Abraham, Payzant, Wood and Daniel52 Evidence to support the prediction includes the increase in average effective magnetic moment values in delithiated samples after long-term holding (90 h) compared with the effective magnetic moment of the delithiated material before long-term holding. Analysis shows that migration of Ni2+ into the lithium layer takes place and may decrease the electrostatic repulsion among ccp oxygen layers and shrink the lattice along the c-axis. In another study, magnetic susceptibility was used to probe cation ordering in the lattice during cycling. Reference Mohanty, Sefat, Li, Meisner, Rondinone, Payzant, Abraham, Wood and Daniel77 The magnetic susceptibility of samples cycled at 4.8 V showed a decrease in the magnetic ordering after one cycle and the eventual disappearance of magnetic ordering after 125 cycles whereas samples cycled at 4.2 V showed the presence of cation ordering after 125 cycles. In addition, the authors found out that increase in effective magnetic moment after 10 (or 125) cycles suggests the presence of Mn3+ in HS states, which may arise from a Li2Mn2O4/LiMn2O4 spinel-type lattice.
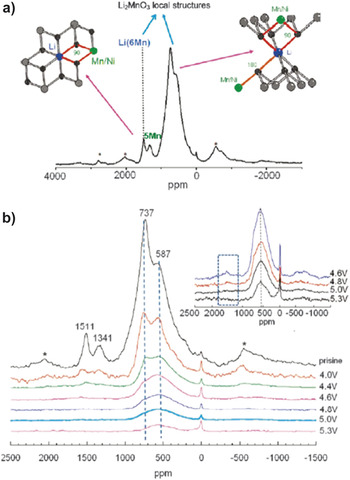
Solid-state Li-NMR has been applied to investigate the detailed structure of HV-LMR oxides. Jiang et al. Reference Jiang, Key, Meng and Grey46 (Fig. 21) reported two groups of resonance features in the 6Li NMR spectrum assigned to the presence Li ions in lithium and in the TM layers. This technique also provided additional details on large variety of different local environments for Li ions in the Li layers, which result from the presence of varying numbers of Ni2+, Mn4+, and Li+ in the first and second cation coordination shells of Li. Authors observed a broad peak at 737 ppm, indicating Li ions in the lithium layers of Li2MnO3, but the resonance at 1511 ppm is at the shift position for Li in the predominantly manganese layers of Li2MnO3. The latter peak was assigned to Li+ in the M layers, surrounded by six Mn4+ ions toward the [Li(OMn)6] cation ordering. Other resonance at 1341 ppm is assigned to Li+ surrounded by 5 Mn4+ and 1 Ni2+ ion.
(a) 6LiMAS NMR spectrum of pristine HV-LMR oxide shows two main classes of Li local environments expected for Ni2+-substitution in a Li2MnO3-type local environment are shown. (b) 6LiMAS NMR spectra of the charged HV-LMR oxide samples. The inset shows an enlargement of the spectra of the HV samples. The dashed blue box in this inset shows the location of the resonances due to Li in the predominantly TM layers. Sidebands due to magic angle spinning are marked with asterisks. Reference Jiang, Key, Meng and Grey46 Reprinted with permission from Chem. Mater. 21, 2733 (2009). Copyright (2009) American Chemical Society.

The 6Li NMR technique was also used to determine which sites are vacated by the removal of Li+ ions (charging) and the sequence of extraction during the charge process. Reference Jiang, Key, Meng and Grey46,Reference Key99 It was found that charging from an open circuit voltage of 3.5–4.6 V, two-thirds of the Li+ ions are removed through via charge compensation of the oxidation of Ni2+ to Ni4+. Interestingly, these ions are extracted from both lithium layers and M layers, as evidenced by almost complete disappearance of the 1500 ppm peak in the 6Li NMR spectra at 4.6 V charged state. At 4.6 V, the intensity of the 737 ppm peak (Li environments in the Li layers resembling those in Li2MnO3) has decreased noticeably and appears to be enshrouded under a broader peak centered at 500–600 ppm. The latter peak likely contains Li environments in the Li layer where the Li is nearby Ni4+ (diamagnetic) ions and/or Li in the tetrahedral sites, adjacent to the Li vacancies in the TM layers. In contrast, the Li ions in the TM layers are still not completely removed at that voltage. From 4.6 to 5.3 V, the intensity of the peaks around 600 ppm gradually decreases, which is consistent with the removal of lithium from the structure and thus with the compound still being electrochemically active at these voltages. The authors did not observe any peaks around 1500 ppm, when LIB was charged to 5.3V (however, one broad peak was observed at 600 ppm). These results indicated that all the Li ions in M layers have been removed when LIB is charged to 5.3V. In the same work, by using 6Li NMR, the authors also discovered Li-ions in a diamagnetic environment. The results were attributed to the the electrolyte decomposition that could occur during high voltage (5.3V) charging. Reference Jiang, Key, Meng and Grey46
Other advanced diagnostic techniques
In situ methods are required to understand the dynamic structural changes in the HV-LMR oxides, which are generally obscured by ex situ techniques. To track the changes in the HV-LMR oxide during a charge–discharge cycle with respect to the charging/discharging voltage, in situ methods are essential. Although in situ techniques have been used in many different oxides that are used for cathode materials for LiBs, here we will highlight only those related to HV-LMR oxides. Reference Fell, Chi, Meng and Jones100 Based on the results of in situ XRD, Dahn et al. Reference Lu and Dahn101 first proposed the simultaneous release of O and Li from HV-LMR oxide when charging above the 4.5 V during first charge. Using the same approach, Shen et al. investigated whether the relationships between kinetics and structural variations could be obtained simultaneously. In situ XRD results showed that the c parameter decreased from 3.70 to 4.30 V and increased from 4.30 to 4.70 V, whereas the a parameter underwent a decrease above 4.30 V during the first charge process. Below 3.90 V during the first discharge process, a slight decrease in the c parameter was found along with an increase in the a parameter. During the first charge process, the value of the coefficient of diffusion for lithium ions (DLi+) decreased to its minimum at 4.55 V, which might be associated with Ni2+ migration, as indicated by both Ni occupancy in 3b sites (Ni3b %) in the Li+ layers and complicated chemical reactions. Remarkably, a lattice distortion might occur within the local domain in the host structure during the first discharge process, indicated by a slight splitting of the (003) diffraction peak at 3.20 V. Recently, we have also used in situ XRD to show a spinel-type reflections that appear during the low-voltage discharging process (∼3.5 V) and indicated the cause of voltage fade in those oxides is due to the formation of this spinel phase. Reference Mohanty, Kalnaus, Meisner, Rhodes, Li, Payzant, Wood and Daniel74 The constant a-lattice parameter during HV discharging in our study indicates the release of oxygen from the structure for charge compensation.
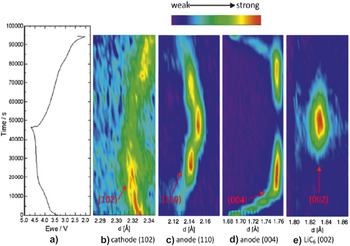
Meng et al. Reference Liu, Fell, An, Cai and Meng76 utilized in situ ND on a full LiB cell to show an irreversible structural change in the first cycle. That study also revealed the volume expansion after the first cycle. The authors could find a change in the graphite during the electrochemical reaction. At the end of a charge, they also observed a change in the anode side. The Li x C6 (004) peak becomes weak while LiC6 (002) peak starts to appear, indicating a phase transformation process. The phase transformation is also indicated by an Li x C6 (110) peak at the middle stage of charge; an LiC12 phase formed and then gradually transforms to an LiC6 phase as more Li inserted into the anode (Fig. 22). In another work from same group, Reference Fell, Chi, Meng and Jones100 in situ XRD was also used to understand the structural changes and lithium intercalation mechanism of the first cycle. The data provide evidence that the structure undergoes irreversible changes in lattice parameters and strain during the first electrochemical cycle. Rietveld refinement of the XRD data of the electrochemically cycled electrode materials shows dynamically changing lattice parameters. The in situ electrochemical measurement shows dynamically changing strain during the first electrochemical cycle that is explained by known lithium and TM migration mechanisms.
First cycle charge/discharge curve of HV-LMR oxide (a) and surface contour plots of (b) Li[Li0.2Ni0.18Mn0.53Co0.1]O2 (102); (c) Li x C6 (110); (d) Li x C6 (004); (e) LiC6 (002) NDs. Reference Liu, Fell, An, Cai and Meng76 Reprinted from H.D. Liu, C.R. Fell, K. An, L. Cai, and Y.S. Meng: In-situ ND study of the xLi2MnO3·(1 − x)LiMO2. J. Power Sources 240, 772, Copyright (2013), with permission from Elsevier.

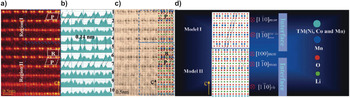
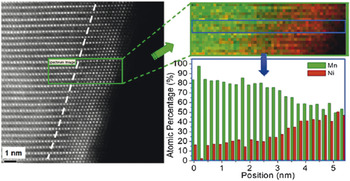
High-angle annular dark-field (HAADF) STEM imaging is a powerful technique for obtaining the atomic structure of oxides. Recently, several authors have adopted HAADF STEM to unlock the structure and structural changes on the surface of HV-LMR oxide particles on the nanoscale. Reference Jarvis, Deng, Allard, Manthiram and Ferreira68,Reference Boulineau, Simonin, Colin, Bourbon and Patoux102,Reference Dixit, Zhou, Idrobo, Nanda and Cooper103 By using this technique, a solid solution and/or a heterointerface between the layered trigonal and layered monoclinic phases in HV-LMR oxide was discovered. Reference Yu, Shikawa, So, Shibata, Kudo, Zhou and Ikuhara31 The heterointerfaces between the two phases are observed in regions 1 and 2 in Fig. 23. Region 1 contains four bright bands: bands 1, 2, and 4 correspond to the presence of Li in the Mn layer (LiMn2-like layers) from LiMn2O3; band 3 is associated with the 0.14 nm lattice fringes, as from a trigonal phase. In region II, the fifth, sixth, and seventh rows are associated with the local monoclinic ordering of the LiMn2-like layer present in the TM planes. The eighth, ninth, and tenth rows are consistent with local rhombohedral ordering of the M–M atom arrangement in the M planes. Based on the experimental data, the authors Reference Jarvis, Deng, Allard, Manthiram and Ferreira68 showed the model of the heterointerface (Fig. 23). In another report, Reference Boulineau, Simonin, Colin, Bourbon and Patoux102 the aberration corrected STEM HAADF imaging technique and the chemical modifications are probed (Fig. 24). For the first time, segregation between nickel and manganese close to the particle surface was observed after cycling. It was also found that Mn progressively occupies the vacant Li sites of the slabs and that the material evolves toward a “classical” (i.e., a nonoverlithiated) layered oxide. Surprisingly, the authors did not see a spinel and/or defect-spinel phase being formed at the surface of the particles (about 2–3 nm thick) during the first cycle and more extended after 50 cycles, which might be due to the low cycling rate.
(a) HAADF and (c) ABF-STEM images of the intergrowth two-phase and hetero-interface in the same local region along the [001]rh zone axis direction from pristine HV-LMR oxide. (b) Intensity profiles of each bright band (1–10) inside the two regions in (a) along horizontal direction. (d) Two proposed interface models based on (c). The inserted parallelogram and rectangle in (a) show the different parallelogram and rectangular symmetry of the monoclinic Li2MnO3-like structure. The image inserted in (c) shows the whole intergrowth two-phase and hetero-interface atomic arrangements inside the LMR particle. Reference Yu, Shikawa, So, Shibata, Kudo, Zhou and Ikuhara31 H. Yu, R. Shikawa, Y-G. So, N. Shibata, T. Kudo, H. Zhou, and Y. Ikuhara: Direct atomic-resolution observation of two phases in the Li1.2Mn0.567Ni0.166Co0.067O2 cathode material for lithium-ion batteries. Angew. Chem. 52, 5969 (2013). Copyright (c) [2013] [copyright owner as Angewandte Chemie], http://onlinelibrary.wiley.com/doi/10.1002/anie.201301236/abstract.

High-resolution STEM-HAADF images, chemical maps, and plot of the evolution of the Mn and Ni atomic concentration obtained from STEM-EELS experiments after 50 charge–discharge cycles. Concentrations are obtained by averaging the composition over the width of the box, which corresponds to one cell (a slab and an interslab). Reference Boulineau, Simonin, Colin, Bourbon and Patoux102 Reprinted with permission from Nano Lett. 13, 3857 (2013). Copyright (2013) American Chemical Society.

Mechanisms of structural degradation in HV-LMR oxides
The various mechanisms of structural changes in HV-LMR oxides that have been proposed are based on the observations made by employing several diagnostic techniques. 12,Reference Gallagher, Croy, Balasubramanian, Bettge, Abraham, Burrell and Thackeray49,Reference Mohanty, Sefat, Kalnaus, Li, Meisner, Abraham, Payzant, Wood and Daniel52,Reference Mohanty, Sefat, Li, Meisner, Rondinone, Payzant, Abraham, Wood and Daniel77,Reference Yu, Yoon, Mun, Park, Kang, Park, Oh and Sung78,Reference Ito, Shoda, Sato, Hatano, Horie and Ohsawa81,Reference Song, Liu, On Lai and Lu87,Reference Gu, Belharouak, Zheng, Wu, Xiao, Genc, Amine, Thevuthasan, Baer, Zhang, Browning, Liu and Wang88,Reference Koga, Croguennec, Ménétrier, Mannessiez, Weill, Delmas and Belin90,Reference Grey and Dupré97,Reference Fell, Chi, Meng and Jones100,Reference Fell, Qian, Carroll, Chi, Jones and Meng104–Reference Zheng, Gu, Xiao, Zuo, Wang and Zhang113 The important mechanism based on these work is depicted below. The structural transformations are also related to issues inherent (such as voltage fade, impedance rise, and lower columbic first cycle efficiency in HV-LMRs presented an earlier section). At this stage, it is hard to relate specific structural changes to specific issues; however, it appears likely that the overall structural changes lead to these issues. The structural changes in HV-LMR oxides may be initiated on the surface and could then grow into the bulk of the electrode material. Observations have revealed that irreversible oxygen-loss and M-migration mechanisms during the first cycle of HV charging are important phenomena because they contribute to the lower efficiency in the first cycle. The irreversible processes play a vital role in the oxide structure rearrangements that cause the permanent structural changes that result in capacity/voltage fade in later cycles (after several charge–discharge cycles). In this section, we summarize the structure and the structural degradation mechanisms that relate to the performance decay of HV-LMR oxides based on oxygen loss and M migration.
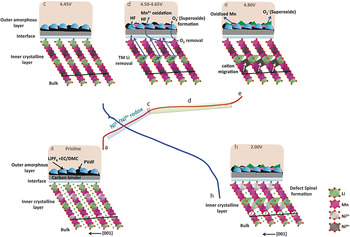
During charging of a LiB to ∼4.4 V, lithium ions are extracted from the octahedral sites of the lithium layer in the trigonal phase (Phase I), and the charge compensation mechanism is the oxidation of Ni and Co (in Co-based HV-LMR oxides). During this process, lithium migrates from octahedral sites to the tetrahedral sites to form a “Li–Li dumbbell” in the structure. Reference Xu, Fell, Chi and Meng96 Migration of Ni2+ into the octahedral vacancy sites of the Li layer at the ∼4.4 V voltage range was also proposed. Reference Heng Shen, Huang, Lin, Shen, Wang, Su, Fu and Zheng109 Charging up to ∼4.55 V causes an ease of lithium diffusion due to electrostatic repulsion among ccp oxygen layers. At that voltage, Li2MnO3 (Phase II) activates, and lithium ions are extracted from the octahedral sites of the M layer. The Ni2+ now migrates from octahedral sites of the Li layer to the vacant octahedral sites of TM layer (due to oxidation of Ni2+ to Ni4+). During the plateau region (4.45–4.8 V), lithium ion extractions and the loss of oxygen Reference Qian, Xu, Chi and Meng114 from the surface cause the reduction of Mn ions on the surface of the oxide. The oxygen removed from the structure reacts with the electrolyte to form a “superoxide” Reference Carroll, Qian, Fell, Calvin, Veith, Chi, Baggetto and Meng105 (see Fig. 25). The oxygen loss leaves the TM octahedra as 5 O-coordinated, and therefore the TM ions become unstable. The unstable TM ions in the defective octahedra migrate to the fully coordinated polyhedral octahedral sites in the Li layer.
Schematic showing the proposed mechanism for the formation and change in the electrode/electrolyte interface region during electrochemical cycling. Reference Carroll, Qian, Fell, Calvin, Veith, Chi, Baggetto and Meng105 Reproduced from Phys. Chem. Chem. Phys. 15, 11128–11138 (2013) with permission of the PCCP Owner Societies.

During first cycle discharge, lithium ions travel back to the oxide structure, but the oxide does not retain its original pristine structure because substantial irreversible modifications occur in the first charging cycle. The irreversible modifications may cause low columbic efficiency in the first cycle. The presence of Li–Li dumbbells and TM ions in the octahedral sites of the lithium layer gives rise to a new “defective spinel” phase during the discharging process that causes structural degradation in HV-LMR oxides. During repeated charge–discharge cycles, the structure degrades from a layered to a spinel configuration. Such degradation might cause voltage fade during long-term cycling and impedance rise during the HV hold process.
The transformation in HV-LMR structural occurs when it is cycled at the UCV (∼4.8 V), not when it is cycled at the lower cutoff voltage (∼4.2 V). To obtain high capacity, LMR oxides must be charged to a higher cutoff voltage. Therefore, the process that causes the structural changes in the first cycle when LMR oxides are charged to a higher cutoff voltage is the most important process and needs to be understood properly.
Challenges and outlook
This review provides a comprehensive look at advanced diagnostic tools for oxide cathode materials for high-energy-density LiBs, and how they are used to obtain structural information for HV-LMR oxides. The structure of HV-LMR is complex compared with the structures of other layered oxide materials used in LiBs, and employing the advanced tools for HV-LMR is a challenging task. Extensive research has been conducted on HV-LMR oxides to understand the structure and structural transformation mechanisms; however, as described in this article, some conflicting reports exist on O-loss, solid solution versus composite, spinel formation versus “spinel-like” phases, and the irreversible capacity losses that occur in the first cycle. These discrepancies may be due to the different approaches taken to characterize and analyze the oxide materials, or they may be because the compositions of the oxides were different between the laboratories and/or research groups. Because the structures of HV-LMR oxides are complex, it is hard to follow a single experimental characterization protocol, and caution must be taken during electrochemical experiments and during interpretation of the data. For example, it is well known that the structure of HV-LMR oxide is altered significantly when it is cycled if the UCV is ≥4.6 V; however, the structure might also change if the UCV is below 4.6 V and the LiB is cycled for an extended period of time. A “layered-to-spinel”-type structural transformation might not occur, but a “structural reconstruction” in the host cathode structure can happen. Also, the structural changes in HV-LMR oxide cathodes in a full-cell LiB where graphite acts as anode might be different from the changes in a half-cell where Li metal acts as anode because in the latter, a solid electrolyte interface is formed at the early stage of cycling, and that might contribute to the structural transformation by altering the lithium diffusion kinetics.
Prospects and conclusions
Currently, HV-LMR layered oxides are candidates for use as high-energy-density LiBs cathodes. These oxides can tolerate up to 4.8 V, and they have a capacity of ∼250 mA h/g. They contain very low concentrations of Co ions or no Co ions at all, making them nontoxic, less expensive, and safer than other layered oxides. However, these oxides undergo unconventional structural rearrangements during charge–discharge cycling that prohibit their use in practical LiBs. These structural rearrangements and degradation cause low first-cycle columbic efficiency, voltage/capacity fade with high UCV cycling, and impedance rise during HV holding. This review highlights some of the pioneering ex situ and in situ materials diagnostic studies that have been conducted in the last several years to obtain deeper insights into the relationships between structural changes and these undesired phenomena.
The above section highlights the important mechanisms based on a variety of materials diagnostics tools. However, before HV-LMR oxides can be fully implemented, several fundamental and practical issues need to be resolved to improve their long-term performance and to mitigate undesired characteristics. Thus, several questions remain unanswered:
-
• What is the composition of the spinel phase that is formed after several charge–discharge cycles?
-
• Which M ions migrate from the M layer to the Li layer during the first cycle?
-
• What are the phase-transformation products from oxygen loss during the first cycle charging, and what is the mechanism?
-
• What are the composition and phase of the products formed in the electrode-electrolyte interface?
Several efforts have been initiated to answer these questions; however, innovative experiments and utilization of proper in situ and ex situ materials diagnostics with electrochemical experimental protocols have proven to be indispensable in uncovering answers to these queries. On the other hand, thanks to the lithium-ion research community, efforts have already been started to suppress voltage fade and low first-cycle columbic efficiency. Reference Sathiya, Abakumov, Foix, Rousse, Ramesha, Saubanère, Doublet, Vezin, Laisa, Prakash, Gonbeau, VanTendeloo and Tarascon106,Reference Verde, Liu, Carroll, Baggetto, Veith and Meng115–Reference Lee and Manthiram120
This review describes how the different advanced materials diagnostic techniques are important to unravel the structure and structural degradation mechanisms in HV, lithium-manganese–rich oxide cathodes for high-energy-density LiBs. The materials characterization tools that have been discussed here can also be applied to other HV and/or high-capacity cathodes for LiBs. For example, these techniques can be used to investigate the change in the (crystal) structures of new HV mixed polyanionic materials Reference Hautier, Jain, Chen, Moore, Ping Ong and Ceder121 during the lithium (de)intercalation process. The advanced characterization techniques described here can provide insights into the fundamental mechanisms of low diffusivity and low conductivity for sluggish ionic and/or electronic transport.
The techniques presented in this review can be implemented in storage technologies that are “beyond Li-ion” technology, Reference Thackeray, Wolverton and Isaacs122 such as lithium-air, lithium-sulfur, and Na batteries to address the fundamental problems that remain stumbling blocks for their practical use in EVs. For example, the advanced materials diagnostics have the potential to determine the correlations between cathode structure and the reaction kinetics of Li–O2 battery systems by providing information on oxygen-reduction and oxygen-evolution reaction mechanisms for cathodes of different metal oxide catalysts. The structural information on discharged products formed during Li–O2 battery operations will help to develop methods to increase the efficiency (reduce the hysteresis between charge and discharge curves) of the Li–O2 cell.
Broader aspect
With excessive utilization of petroleum products in transportation-based internal combustion engines, the world has witnessed a severe impact on global ecosystems. In this regard, there is now a growing demand for clean and renewable terrestrial energy and reduced dependence on imported oil, with the advent of all-EVs. The near-term fate (5–10 years) of EVs lies in utilizing viable HV, high-energy-density LiBs. This manuscript unravels a complex, critical limitation of current HV LiBs that may allow them to soon be used in everyday transportation applications It provides insight into the fundamental failure mechanism of critical HV cathode (HVC) materials (lithium-manganese–rich mixed-transition-metal oxide ceramics) for high-energy-density lithium ion batteries (LiBs), which could substantially increase driving range of current EVs by 50% or more. Despite high-energy-density properties during initial cycling, these cathodes undergo structural degradation and phase transformation after only a few charge–discharge cycles. The results discussed here deal with a diverse range of state-of-the-art chemical and microstructural measurement methods that could be similarly applied in other fields. Furthermore, the discussion deals generally with key mechanistic features of LiB capacity and voltage fading (performance degradation) in high-energy-density devices, which are of broad interest to the energy storage community.
Acknowledgments
This work at Oak Ridge National Laboratory, managed by UT Battelle, LLC, for the U.S. Department of Energy (DOE) under contract DE-AC05-00OR22725, was sponsored by the Energy Efficiency and Renewable Energy (EERE) Vehicle Technologies Office (VTO) Applied Battery Research (ABR) Program (Program Managers: Peter Faguy and David Howell).