INTRODUCTION
Improvement of nitrogen (N) use efficiency is needed urgently since excessive application of N fertilizer has been widespread in small-scale fields such as in China, causing great losses of N and environmental pollution (Yang et al. Reference Yang, Zhang, Zeng, Zhou, Chen and Zhou2007). In Northern China, excessive N application has increased nitrate leaching greatly (Ju et al. Reference Ju, Kou, Zhang and Christie2006). The nitrate content of the groundwater in half of the investigated wells exceeded the EU drinking water standard of 50 mg NO3 −/l (Zhang et al. Reference Zhang, Tian, Zhang and Li1996) and the groundwater in shallow wells (<15 m depth) was heavily contaminated in greenhouse vegetable production areas (Ju et al. Reference Ju, Kou, Zhang and Christie2006). In Southern China, overfertilization has also accelerated water eutrophication in Taihu Lake, Dianchi Lake and other water bodies (Duan & Zhang Reference Duan and Zhang2003). In irrigated soils in Asia or the humid tropics, the potential risk of nitrate pollution also exists in groundwater, especially under conditions of inefficiently managed fertilizer-N (Bijay-Singh et al. Reference Singh, Singh and Sekhon1995). To solve these problems, management options for determining the optimal fertilizer N rate are required urgently.
Traditional N recommendation approaches are based on the response of crop yield to soil mineral N, i.e. the Nmin method, or the pre-plant nitrate test (PPNT) for optimal N application rates and the pre-side dress nitrate test (PSNT) for determining mid-season N requirements (Wehrmann & Scharpf Reference Wehrmann and Scharpf1986; Olfs et al. Reference Olfs, Blankenau, Brentrup, Jasper, Link and Lammel2005). However, high soil testing costs make these methods difficult to apply in small-scale fields in China, where the field size is typically<0·4 ha per household and the income from growing cereals is very low (NDRC 2007).
In recent years, various plant diagnosis technologies have been developed. Plant N, foliar chlorophyll content and stem sap nitrate content (Olfs et al. Reference Olfs, Blankenau, Brentrup, Jasper, Link and Lammel2005; Arregui et al. Reference Arregui, Lasa, Lafarga, Irañeta, Baroja and Quemada2006) have been used for estimating topdressing N rates. Portable chlorophyll meters such as SPAD-502 (Minolta Corp., Japan) are available for rapid and non-destructive assessment of the foliar N status. Furthermore, sensor devices based on remote sensing technologies have also been developed and applied to guide fertilizer application (Mistele & Schmidhalter Reference Mistele and Schmidhalter2008; Tremblay et al. Reference Tremblay, Wang, Ma, Bélec and Vigneault2009; Erdle et al. Reference Erdle, Mistele and Schmidhalter2011), such as the GreenSeeker® (NTech Industry Inc.), CropCircle® (Holland Scientific, Inc.) or YARA N-Sensor (Yara GmbH & Co. KG, Dülmen, Germany). However, such advanced technologies are suitable for only a few crops such as rice, wheat and maize (Peng et al. Reference Peng, Laza, Garcia and Cassman1995; Tremblay et al. Reference Tremblay, Wang, Ma, Bélec and Vigneault2009; Bijay-Singh et al. Reference Bijay-Singh, Sharma, Jaspreet-Kaur, Jat, Martin, Yadvinder-Singh, Varinderpal-Singh, Chandna, Choudhary, Gupta, Thind, Jagmohan-Singh, Uppal, Khurana, Ajay-Kumar, Uppal, Vashistha, Raun and Gupta2011) and require substantial investment by farmers. Some indicators, such as leaf SPAD readings, are also difficult to use for making N recommendations directly because threshold values might vary among years, locations, cultivars and soil types (Spaner et al. Reference Spaner, Todd, Navabi, Mckenzie and Goonewardene2005).
An on-farm N recommendation approach called ‘fertilizer window’ was presented by Rimpau (Reference Rimpau1984). Farmers were instructed to apply less N on a small part of the field and compared this ‘window’ with the rest of the field to estimate the optimal N rate. Owing to the single N level and the original testing on large-scale farmlands where more accurate N testing methods were available, little attention was paid to this practice. Subsequently, the Automated Calibration Stamp (ACS) and Ramp Calibration Strip (RCS) technologies were presented (Raun et al. Reference Raun, Solie, Stone, Zavodny, Martin and Freeman2005, Reference Raun, Solie, Taylor, Arnall, Mack and Edmonds2008). By conducting and evaluating (visibly or by using an active hand-held normalized difference vegetation index (NDVI) sensor) a continuously changing or increasing application rate of pre-plant N fertilizer on top of a farmer's normal fertilization rate across a field, RCS provided an estimate of the amount of additional N needed in a field for wheat and maize. However, Roberts et al. (Reference Roberts, Brorsen, Taylor, Solie and Raun2011) pointed out that this approach was unlikely to produce accurate N requirement predictions at any spatial scale, and improvements in the RCS technology were needed if it was to become viable.
Based on the principle of the ‘fertilizer window’ (Rimpau Reference Rimpau1984) and RCS (Raun et al. Reference Raun, Solie, Taylor, Arnall, Mack and Edmonds2008), the present paper provides an alternative technology, termed the Green Window Approach (GWA), for determining optimal N rate. The GWA uses stepped increasing rates of split-applied N to plots and enables farmers to conduct a trial in a small part of a field. The lowest N rate that achieves no further visible changes in plant growth provides an estimate of N required by the crop in the next planting season, and could also be used for current N management decisions. The objective of the present paper is to report the key procedures of GWA and to evaluate the effects of its application in small-scale and irrigated wheat fields on grain yield, N use efficiency and economic benefits.
MATERIALS AND METHODS
Concept description of Green Window Approach
The GWA is developed from the ‘fertilizer window’ (Rimpau Reference Rimpau1984) and RCS technology (Raun et al. Reference Raun, Solie, Taylor, Arnall, Mack and Edmonds2008) to determine the N requirement for cereal crops. It is based on the concept of visually evaluating plant growth status with gradually increased rates of split-N to identify the minimum N rate required for a high grain yield. The principles and hypothesis of this concept are illustrated in Figs 1 and 2.
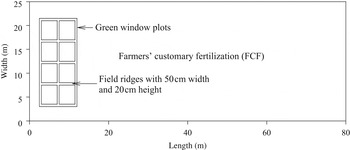
A schematic diagram of the Green Windows Approach (not to scale) conducted in farmers’ field. The relative field shape is typical for small-scale fields in the North China Plain.

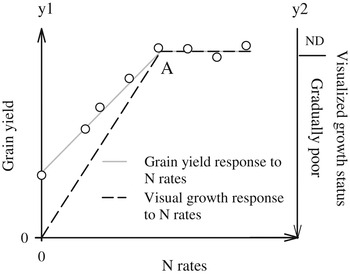
Theoretical response of grain yield (y1) and visual estimation of crop growth status (y2) to nitrogen rates. ND, no visual difference.

The GWA consists of eight small plots placed in one or two strips near an accessible side of a field. Before sowing, all plots receive a basal N application of 30 kg N/ha (except in the nil-N plot). At growth stage (GS) 21–23 (Zadoks et al. Reference Zadoks, Chang and Konzak1974) in early spring and GS 41–52, GWA plots receive split-N in a 1 : 1 ratio at levels of 0, 90, 120, 180, 240, 300, 360 and 420 kg N/ha, including soil Nmin in 0–90 cm determined in early spring. Alternatively, incremental N rates can be applied without taking into account residual soil nitrate and N rates can be adjusted according to crop N requirements and soil mineral N content in specific regions and fields. The remaining larger part of the field still receives farmers’ customary fertilization (FCF). The schematic diagram is shown in Fig. 1.
Grain yield response to N rate is in accordance with the linear plateau model (Cui et al. Reference Cui, Chen, Miao, Li, Zhang, Li, Ye, Yang, Zhang and Liu2008), by which the optimal N rate can be estimated at the point where the transition curve reaches the yield plateau. Crop growth also responds proportionally to N rate until it reaches a plateau where there are no longer visible changes (Raun et al. Reference Raun, Solie, Stone, Zavodny, Martin and Freeman2005, Reference Raun, Solie, Taylor, Arnall, Mack and Edmonds2008). Assuming both crop growth and grain yield respond to N rate synchronously, the lowest N rate that makes no visual difference in crop growth (point A in Fig. 2) provides an estimate of the optimal N strategy. Further assuming that grain yield has a similar response to N fertilizer in the subsequent year, such an optimal N strategy could be applied by farmers in the next growing season. The lower or lowest application rates also allow evaluation of the soil N supply, and further to make decisions for subsequent N application in the same way.
Crop growth status could be visually monitored after its nearly full response to the last topdressing after flowering. The visually optimal plot (V-OPT) is documented as the one presenting no visual difference compared with the higher N level. If the V-OPT also achieves a maximum or near-maximum grain or biomass yield, the optimal N rate could be estimated as the N applied in V-OPT. Alternatively, visual information obtained during the vegetative stage can be used for current in-season N management, allowing the farmer to decide about further N applications and rates. In the experiments presented below, one of the primary tasks was to prove whether a maximum or near-maximum grain yield could be achieved in the V-OPT.
Experimental layout and management
A total of seven trials were conducted under irrigated winter wheat field conditions, according to the above-mentioned GWA procedures, from 2009 to 2011 in the North China Plain, spreading 15 km (N39°33–38′, E116°34–40′) around Wanzhuang Town, Hebei Province with 20–23 m a.s.l. and c. 40 km to the centre of Beijing. The mean annual temperature is c. 11·9 °C, with the coldest month in January and the hottest in July. The mean annual sunshine period is 2660 h and the annual frost-free period is 183 days. This region receives a mean annual precipitation of 555 mm, c. 70% of which occurs between June and September. Soil texture of the experimental fields varied from sandy loam to clay loam; soil organic matter, soil pH, total N, nitrate-N, available phosphorus (P) and potassium (K) at topsoil (0–20 cm) were 17±2·0 g/kg, 8·6±0·07, 0·8±0·10 g/kg, 21±10·2 mg/kg, 6±1·2 mg/kg and 84±15·1 mg/kg, respectively.
In each trial, eight GWA plots were established near one side of farmers’ small-scale fields. Plot size varied from 2·5×2·5 to 4×4 m2, depending on the size and shape of the specific field. Ridges 20 cm high and 50 cm wide were piled up between the adjacent plots by machine or iron shovel to block the flow of irrigation water carrying dissolved fertilizer. Before sowing, GWA plots received 30 kg N/ha of urea (46% N) except in the nil-N plot/treatment (control), 80 kg P2O5/ha of superphosphate (16% P2O5) and 100 kg K2O/ha of potassium chloride (60% K2O) or potassium sulphate (50% K2O) as regional P and K recommendation rates. At GS 21–23 and GS 41–52, GWA plots received split-N in a 1 : 1 ratio at levels of 0, 90, 120, 180, 240, 300, 360 and 420 kg N/ha, respectively, including soil Nmin in 0–90 cm determined at GS 21–23 in early spring. Owing to high residual soil nitrate and its great variation among different fields, the amount of N fertilizer in GWA plots ranged from 0 to 270 kg N/ha on average. Therefore, the optimized N recommendation may include residual soil nitrate-N measured by an on-site quick test (Schmidhalter Reference Schmidhalter2005; Yue et al. Reference Yue, Li, Hu, Zhang, Ji, Zhang and Schmidhalter2012).
In the FCF area in the remaining larger part of the field, different fertilizers such as urea, diammonium phosphate and/or NPK compound fertilizers were used by farmers as their customary practice, including sheep manure in two FCFs. The FCFs received 186–637 kg/ha of N with a mean value of 375 kg/ha in a mean ratio of 0·51 : 0·49 at pre-sowing and GS 21–23; 68–259 kg P2O5/ha of phosphate and 0–89 kg K2O/ha of potash as basal application.
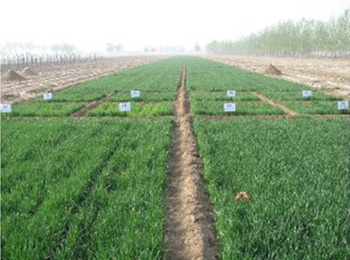
Winter wheat was sown at the beginning of October and harvested in mid-June of the following year. At pre-planting, fertilizers/manure were broadcast evenly on the soil surface by hand/shovel and then ploughed to a depth of c. 20 cm. During plant development, all trials were irrigated four times, receiving c. 100 mm each time according to the soil water content: twice after split-N topdressing and the remainder applied at pre-frost before winter and at GS 60–79. To ensure GWA plots in each trial received the same amount of irrigation water, a soft plastic pipe (8 cm internal diameter) was used. One side of the pipe connected to the outlet of a well motor-pump, the other side extended to the GWA plots for irrigating. A soft, thick plastic sheeting was placed near the pipe outlet as a buffer layer to prevent topsoil erosion due to irrigation. A stopwatch or other meter with an accurate timing function (such as a mobile phone) was used to apply the same amount of irrigation to each plot. Other field managements such as ploughing, sowing and pesticide application in GWA plots were in accordance with farmers’ customary practice in FCF. During GS 60–73, at least 10 days after the last topdressing, the V-OPT was visually estimated and documented by two scientists or together with a farmer, according to the above mentioned principle of GWA. One of the GWA trials is illustrated in Fig. 3.
[colour online]. Illustration of the Green Window Approach (GWA) designed for improving the nitrogen management by farmers in small-scale and irrigated wheat fields. The GWA represents an on-field demonstration site visualizing the effects of incremental nitrogen (N) levels (0, 90, 120, 180, 240, 300, 360 and 420 kg/ha indicating N supplies), and enables farmers to conduct such a trial within their own field. The lowest N rate that achieves no visible change in plant growth or biomass shows the optimal N requirement of crops.

Soil samples were collected at GS 21–23 before the first N topdressing and at post-harvest by hand with a Holland auger (4 cm internal diameter) at depth intervals of 0–20, 20–50 and 50–90 cm, and three soil cores were taken from each layer to make a composite sample. Soil nitrate-N was measured by a quick test nitrate reflectometer (RQeasy) and nitrate test strips (Schmidhalter Reference Schmidhalter2005; Yue et al. Reference Yue, Li, Hu, Zhang, Ji, Zhang and Schmidhalter2012).
At harvest, the above-ground biomass in the total area of GWA plots and a representative area of the same size in FCF were collected, separated into straw and grain by an experimental thresher and weighed. A small amount of straw and grain was sampled and oven-dried at 70 °C until constant weight, then ground into powder and sieved (<0·25 mm) for determination of total N content using the Kjeldahl method (Bremner Reference Bremner1960).
Data analysis
Grain yield in V-OPT was first compared with other GWA plots in each trial so as to provide evidence of whether a maximum or near-maximum grain yield could be achieved in V-OPT with the lowest N rate that made no visual difference in crop growth. Then the V-OPT was compared with FCF or together with the control treatment for grain yield, apparent N recovery (ANR) and economic benefits by analysis of variance (ANOVA) and quartile analysis using the JMP 4 software (SAS, USA) for further assessment of the effect of GWA on these aspects.
To compare these data among V-OPT, FCF and the control treatment, grain yield was corrected according to the plot-sampling size and boundary effect: wheat grain yield North China Plain was increased by 65% within the outside row with a boundary width of 40–60 cm, and 7·7% in the adjacent row (Zhao et al. Reference Zhao, Yu, Li and Yu1997; Li et al. Reference Li, Ding and Song1999). Grain yield equals grain yield per plot/plot area×coefficient of boundary effect, where the coefficient of boundary effect ranged from 0·93 to 0·97. The ANR in percentage was calculated as follows: ANR%=(N uptake in N fertilized plot−N uptake in N unfertilized plot)/N application rate×100. Net profit was calculated as grain yield income minus input costs, the latter of which included the costs of fertilizers, seeds, pesticides, irrigation and machines. The prices of all items used were according to the market price at the time. US dollar (US$) was converted from Renminbi (RMB) by using the exchange rate averaged as 6·45 in 2011.
RESULTS
At GS 60–73, V-OPT was observed in GWA plots of all seven trials. Five were in plots with N supply at 180 kg N/ha, whereas the other two were at 0 and 90 kg N/ha. The V-OPT in five trials achieved a maximum grain yield of 5·5 t/ha on average. In the other two trials, the V-OPT received a near-maximum grain yield of 6·3 t/ha on average and was 3–4% lower than the maximum rate, but the N rates were 150–164 kg N/ha lower than in the latter (data not shown).
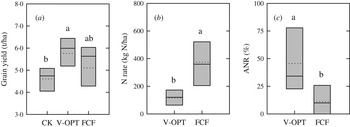
Across all seven GWA trials, a significant difference (P<0·05) in grain yield occurred among the control, FCF and V-OPT (Fig. 4(a)). The highest grain yield of 5·8 t/ha as mean value was observed in V-OPT, which was 13% higher than FCF and 25% than in the control treatment. The result that grain yield in FCF was 11% higher than in the control indicates a positive response of grain yield to FCF management.
Comparison of (a) grain yield, (b) the amount of applied nitrogen (N) and (c) apparent N recovery among (or between) different treatments for winter wheat in seven sites in the North China Plain. CK: nil-N treatment, FCF: farmers’ customary fertilization area, V-OPT: visually optimal Green Window plot. Solid and dotted lines in this figure indicate median and mean, respectively. The box boundaries indicate upper and lower quartiles, different letters above the boxes denote statistically significant differences of the mean value by Tukey's Honestly Significant Difference test at P<0·05.

The FCF received excessive N of 375 kg N/ha, on average (Fig. 4(b)). However, it was significantly decreased by 69% to 116 kg N/ha in V-OPT, varying from 0 to 186 kg N/ha. Conversely, ANR was only 11·2% on average in FCF (Fig. 4(c)), whereas it was sharply increased to 45·7% in V-OPT.
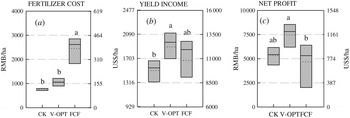
In the seven GWA trials, the fertilizer input cost, yield income and the net profit were significantly different (P<0·05) among CK, FCF and V-OPT (Figs 5(a)–(c)). The fertilizer input cost in V-OPT averaged 1045 RMB/ha (162 US$/ha), which was 38% higher than the control but 57% lower than FCF. The grain yield income was 12 211 RMB/ha (1891 US$/ha), which was 25% higher than the control and 13% higher than FCF. Calculating fertilizers, seeds, pesticides, irrigation and machines at the market price as input costs, the net profit in V-OPT averaged 7473 RMB/ha (1157 US$/ha), which was 40·6% higher than the control and 59·8% higher than FCF, on average.
Comparison of (a) fertilizer cost, (b) yield income and (c) net profit among different treatments for winter wheat in seven sites in the North China Plain. CK: nil-N treatment, FCF: farmers’ customary fertilization area, V-OPT: visually optimal Green Window plot. Solid and dotted lines in this figure indicate median and mean, respectively. The box boundaries indicate upper and lower quartiles, different letters above the boxes denote statistically significant differences of the mean value by Tukey's Honestly Significant Difference test at P<0·05.

DISCUSSION
Determining optimal nitrogen strategies with Green Window Approach
The V-OPT was estimated visually by two scientists or together with a farmer in GS 60–73 according to the procedures of GWA. In plots where N was lower than V-OPT, plants were obviously yellow, slim and/or short; the ears looked small; plant density also seemed lower than V-OPT. Among GWA plots with N not less than V-OPT, almost no visual differences were observed in plant growth characteristics such as plant height, thickness, greenness, density, ear size, etc. The V-OPT could be estimated easily by eye. In addition, the V-OPT in five trials resulted in the maximum grain yield, whereas in the other two trials near-maximum grain yield was achieved at just 3–4% lower than the maximum. These results strongly indicate that visual estimation of the plant growth status in GS 60–73 was in good accordance with the grain yield, i.e. the lowest split-N rate that resulted in maximum or near maximum grain yield could be estimated visually during plant development using the GWA technology.
The optimal N rate in V-OPT was supported by previous studies that optimal N rate ranged from 71 to 170 kg N/ha with a mean of 126 kg N/ha for winter wheat in the North China Plain (Cui et al. Reference Cui, Zhang, Chen, Dou and Li2010). However, in the present study, one V-OPT was observed in the control treatment, i.e. no N should be applied in this field for achieving a high grain yield. This was mainly due to the excessive application of cattle manure and N fertilizer in previous seasons, which caused the residual soil Nmin at 0–90 cm reaching a high amount of 328 kg N/ha in early spring. With the exclusion of this trial, the optimal N rate was equal to N supply (soil Nmin in 0–90 cm in early spring plus the split-topdressing N rates) at 155 kg N/ha with a basal N application of 30 kg N/ha (data not shown), which is also in agreement with Liu et al. (Reference Liu, Ju, Zhang and Chen2003), who found that an N supply (Nmin+fertilizer N) of 90 kg N/ha at the regreening stage and an N rate of 90 kg N/ha at the shooting stage could meet the N requirements of winter wheat with a target yield of 6 t/ha.
The V-OPT also provided a high ANR, achieving an average of 45·7%. Zhang et al. (Reference Zhang, Wang, Zhang, Cui, Ma, Chen and Jiang2008) reviewed 273 experimental data and showed that the mean ANR for wheat was just 28·2% in China and even lower, to 16·4%, in the experimental region considered in the present study. Compared with the optimal N rate in V-OPT, more than 69% of the amount of N in FCF was over-applied, which caused a sharp decrease of ANR to 11·2%, indicating a serious waste of N fertilizer by farmers. Ju et al. (Reference Ju, Xing, Chen, Zhang, Zhang, Liu, Cui, Yin, Christie, Zhu and Zhang2009) pointed out that farmers’ customary N rate in China could be reduced by 30–60% while still maintaining crop yield. Cui et al. (Reference Cui, Chen, Miao, Li, Zhang, Li, Ye, Yang, Zhang and Liu2008) summarized 124 on-farm wheat experiments in the North China Plain and concluded that 55 and 37% of farmers’ fields did not need to apply N fertilization before the sowing and at shooting stages, respectively. The present study proved that GWA could significantly reduce farmers’ customary N rates to a low but optimal level while greatly improving the N use efficiency.
Analysis of economic benefits is necessary since all farmers want to achieve the maximum benefit with minimum cost. The present study provided a positive result compared with FCF: the fertilizer cost in V-OPT decreased by 57%, whereas the grain yield profit increased by 13%. Calculating the input costs of fertilizers, seeds, pesticides, irrigation and machines at the market prices, the economic benefits in V-OPT was increased by 59·8% to 7473 RMB/ha (1157 US$/ha). If the labour costs were also considered, the net profit in V-OPT was 4773 RMB/ha (379 US$/ha) but was still 1·4-fold higher than FCF. The low profit in FCF was in accordance with a previous investigation (NDRC 2007) in nine major wheat production regions in China that farmers’ net profit of winter wheat was commonly 1765 RMB/ha (273 US$/ha) in 2006 and 1879 RMB/ha (291 US$/ha) in 2007. Improving field N management with GWA, farmers’ economic benefits and net profits could be increased greatly.
However, when conducting such a trial, based on an area of 0·20–0·40 ha per field in a Chinese household, it was also estimated that c. 0·8–2·4% of the field is required for establishing field ridges around GWA plots when this technology is used by farmers and c. 0·6–1·8% of the total grain yield might be lost, but the grain yield and net profits in the current season could also be increased by boundary effects (Zhao et al. Reference Zhao, Yu, Li and Yu1997; Li et al. Reference Li, Ding and Song1999). However, compared with the increase of grain yield and net profit in the coming season as discussed above, such a risk of loss is very slight and is not needed to be taken into account.
The variation of optimal nitrogen rates among years
Unlike using the Nmin method (Wehrmann & Scharpf Reference Wehrmann and Scharpf1986) or the RCS Technology (Raun et al. Reference Raun, Solie, Taylor, Arnall, Mack and Edmonds2008) to determine in-season optimal N rate, GWA is used chiefly to determine optimal N rate for the next planting season. Although another study in Oklahoma found no significant effect of weather conditions on fertilizer response (Girma et al. Reference Girma, Holtz, Arnall, Fultz, Hanks, Lawles, Mack, Owen, Reed, Santillano, Walsh, White and Raun2007), most studies describe a significant impact of seasonal weather conditions, especially precipitation, on soil mineral N and thus crop response to N (Derby et al. Reference Derby, Steele, Terpstra, Knighton and Casey2005; Wu et al. Reference Wu, Yu, Wang and Hengsdijk2008; Tremblay et al. Reference Tremblay, Bouroubi, Bélec, Mullen, Kitchen, Thomason, Ebelhar, Mengel, Raun, Francis, Vories and Ortiz-Monasterio2012). Therefore, the optimal N rate might vary among years. Brentrup & Link (Reference Brentrup and Link2004) analysed 79 winter wheat experiments in the UK and showed that the economic optimal N rate averaged about 199 kg N/ha with a temporal variation between 175 and 240 kg N/ha from 1990 to 2001 (data estimated from Fig. 2 in Brentrup & Link Reference Brentrup and Link2004). Lambert et al. (Reference Lambert, Lowenberg-DeBoer and Malzer2006) reported that the economic optimal N rate for maize in Minnesota, USA averaged 115 kg N/ha with a temporal variation between 103 and 129 kg N/ha in 3 years. Generally, <80 kg N/ha variation in optimal N rate for wheat has been found among different years. Under abundant and well-distributed rainfall conditions, however, Tremblay et al. (Reference Tremblay, Bouroubi, Bélec, Mullen, Kitchen, Thomason, Ebelhar, Mengel, Raun, Francis, Vories and Ortiz-Monasterio2012) summarized from 51 studies and found that the N response of maize varied less. As irrigation provided the same effect on the N response as rainfall (Tremblay et al. Reference Tremblay, Bouroubi, Bélec, Mullen, Kitchen, Thomason, Ebelhar, Mengel, Raun, Francis, Vories and Ortiz-Monasterio2012), crop response to N is predictable on irrigated fields (Liu et al. Reference Liu, Swinton and Miller2006). In a 2-year experiment synchronized to the GWA trials in the North China Plain, X. L. Yue (unpublished) found the optimal N rate plus soil Nmin at 0–90 cm in early spring was 195 kg N/ha in 2010 and 180 kg N/ha in 2011, showing little variation. Compared with the excessive level of farmers’ customary N rate, the annual variations of optimal N rate under irrigated conditions in the North China Plain were slight and could be ignored. Furthermore, the optimal N rate as determined by farmers using GWA might be adjusted from year to year according to the previous trial, so that the N balance could also be maintained in the long term without considering climatic variation among years.
Characteristics of Green Window Approach
The GWA is a simple, economical and easily performed method for providing an optimal N strategy by on-field demonstration of incremental N levels and judging its effects in farmers’ fields. It does not require laboratory facilities, complicated procedures or professional knowledge, and can be used easily by farmers themselves. This simplified technology could also be implemented easily by advisory experts, thus allowing optimization of N management in the farmers’ practice. It is feasible that even one or a few exemplary Green Windows may attract other farmers’ curiosity by depicting on simple posters the incrementally stepped N rates and outlining the optimum rate in an appealing way. Further research in disseminating the GWA will contribute to substantial improvements in the actual N management. In order for farmers to conduct carefully and accurately managed GWA plots, a more detailed description of the procedures will be very helpful and should be prepared for the farmers. A website containing an animated demonstration of the procedure, similar to that for simplified soil nitrate analysis (TUM 2010), may further contribute to the dissemination of the GWA.
CONCLUSION
The present study provided a simple technology, termed the GWA, to achieve optimized N strategies for cereal crops. The GWA represents an on-field demonstration site, visualizing the effects of incremental N levels, and enables farmers to conduct such a trial within their own field. The lowest N rate that achieves no further visible change in plant growth or biomass shows the optimal N requirement of crops. The current research has shown that GWA is simple, economical and efficient for providing optimal N rates for irrigated winter wheat in small-scale fields. This technology could not only provide a maximum or near-maximum grain yield, but also improve N use efficiency and increase farmers’ income by reducing fertilizer cost and increasing grain yield profit as well. Most importantly, it convinces farmers to improve N management by their own visual judgment, and should be considered a first step in establishing an improved agricultural practice.