I. INTRODUCTION
The Planetary Instrument for X-ray Lithochemistry (PIXL) is a sub-millimeter focused X-ray fluorescence (XRF) spectrometer selected for the Mars 2020 science mission. Its intended capabilities are to provide major, minor, and trace elemental analysis of the Martian rock and soil and to render two-dimensional elemental images of the Martian surface (Allwood et al., Reference Allwood, Wade, Clark, Elam, Flannery, Foote, Hurowitz and Knowles2015). Calibration efforts are underway to develop the procedures needed to render absolute quantification of PIXL data.
As part of this effort, we have characterized the energy-dependent photon transmission profile of the micro-focus optic attached to the Rh X-ray tube of a prototype “breadboard” PIXL system. An accurate representation of this profile is a necessary component to the fundamental parameters (FP) computations used to quantify elemental constituents in a sample. Of the numerous methods (Wolff et al., Reference Wolff, Malzer, Mantouvalou, Hahn and Kanngieβer2011) available to derive a profile, the procedure of Hodoroaba and Procop (Reference Hodoroaba and Procop2009) was adopted in this work for its simplicity in replication. Here, a direct division of a measured spectrum by a FP calculated spectrum produces an estimate of the profile. The calculated spectrum is obtained using PIQUANT, our in-house software fitting routine, developed to process all PIXL XRF data. Some of the databases used by this software have been described elsewhere (Elam et al., Reference Elam, Ravel and Sieber2002). A key advantage to using this method is that the optic does not need to be removed from the tube. Additionally, a point-by-point profile can be constructed since data from every channel in the spectrum can contribute to estimating the efficiency of its respective energy.
The quality of the derived transmission curve can be assessed using instrument efficiency constants, here referred to as element correction factors (ECFs). ECFs are used to correct for systematic errors found in the pure FP approach that includes spectrum fitting, solid angle, detector and optic transmission efficiencies, and FPs themselves. For a well-characterized system, ECFs will be close to unity (=1) for all Z. Any strong departure from unity therefore indicates a significant systematic error(s) in the calibration, which may include inaccuracies with existing transmission profiles.
This work demonstrates a reproducible empirical procedure that can be used to derive the energy-dependent profile of the optic's transmission function. Using a measurement of pure water as a reference spectrum (with virtually no elemental peaks), a nearly pure representation of the complete bremsstrahlung profile is obtained. By comparing this spectrum to one simulated by PIQUANT enables estimation of the profile in the absence of an optic, and thus allows derivation of the transmission profile. This procedure can be utilized in situations where tube profile information does not exist or in aging tubes where the anode interaction spot shifts, thereby changing the beam's point of entry into the optic.
II. MATERIALS AND METHODS
The prototype PIXL system used for this work is in operation at the NASA Jet Propulsion Laboratory. It consists of a Moxtek® 12 Watt 60 kV MAGPRO® TUB00140-RH3-PROTO Rh X-ray tube, coupled to an XOS (#6319) glass polycapillary focusing optic. The X-ray tube anode consists of a thin coating (~1.2 µm) of Rh on a 250 µm Be window. Electron impact on the anode and the resultant X-ray emission both occur normal (90°) to the window plane and thereby follow a straight path prior to entry into the optic. The optic delivers a focused (95 µm at 17 keV) beam spot at a 2 cm standoff distance. Two Ketek Vitus H50 AXAS-D detectors (Model: D5C2T0 – H50 – ML9BEV) with 12 µm Be windows are oriented in near backscatter geometry on either side of the optic and set at 20° relative to the beam axis. Their standoff is 3 cm. This configuration reflects the geometry of the planned PIXL flight instrument. At this standoff, each detector is able to acquire approximately 3000 cps from a measurement of glass reference material BHVO-2G from the National Institute of Standards and Technology. A helium flow was used for all measurements to enable detection and quantification of the lighter elements (i.e., Na, Mg, Al, and Si). In this work, only one detector was used.
A total of six 20 min (120 min total) measurements of a homogeneous glass standard NIST Standard Reference Material (SRM) 610 were processed using PIQUANT to derive ECFs for all elements present. The NIST SRM 610 standard is a glass doped with up to 61 trace elements, each possessing a concentration of about 500 µg g−1, or less (Pearce et al., Reference Pearce, Perkins, Westgate, Gorton, Jackson, Neal and Chenery1997). NIST SRM 610 is also one of the materials selected for the calibration target to be used by the PIXL flight unit. The benefit of the multi-element spectrum generated by the measurement of NIST SRM 610 is that elemental X-ray response from both K and L X-ray lines are generated across most of the 0–28 keV X-ray excitation range. The use of NIST SRM 610 thus permits the use of one standard, using the ECF computation approach, to assess the quality of the efficiency curve derived in this work.
Four additional 20 min (80 min total) measurements of a sample of pure water were collected using the same geometry and conditions as those used for the NIST SRM 610 measurements. For both specimens, individual spectra were summed to give one high count measurement. Data were collected using Prospect® software installed on a PC. Shaping time was set to 4 µs, yielding spectra with 130 eV (FWHM @ 5.9 keV) resolution.
III. CALCULATIONS
All spectra fitting and calculations were accomplished using PIQUANT. The summed NIST SRM 610 spectrum was processed in PIQUANT using the nominal matrix composition for SiO2, Al2O3, CaO, Na2O (=100%) and the average trace element values as reported by Pearce et al. (Reference Pearce, Perkins, Westgate, Gorton, Jackson, Neal and Chenery1997). Since the nominal matrix composition given in the SRM's certificate summed to 100%, the presence of the trace impurities implies that true matrix composition must sum <100%. Therefore, the four oxides were reduced by the same proportion so that the sum of the oxides plus the traces (unaltered) sum to 100%. Using this composition as input to PIQUANT, the spectrum was fitted and the ECFs computed. Both K and L X-ray lines, for the 60+ elements present in the sample were used.
The water spectrum was calculated using PIQUANT with the assumption that the optic was absent. The two parameters of the linear channel–energy calibration relationship from the fitted spectrum were used in the calculation. In this way, each data point in both the measured and calculated spectrum corresponded to the same energy value.
IV. RESULTS
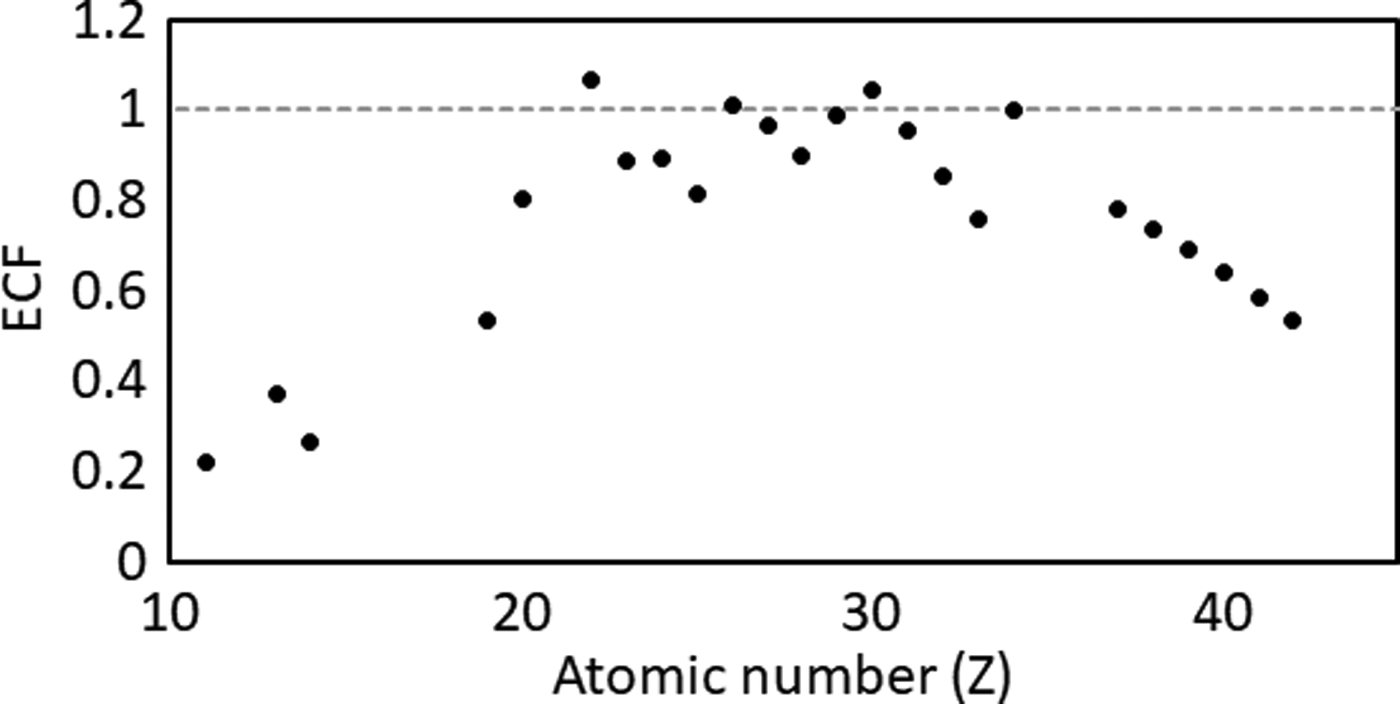
ECFs computed for NIST SRM 610 showed a smoothly varying departure from unity across Z for the K X-ray lines (Figure 1). The ECFs of the middle Z elements did not differ significantly from 1 but those at high and low Z trailed off to lower values. This suggests that the built-in efficiency profile in PIQUANT might contain some errors.
Plot of ECFs calculated using PIQUANT with a generic efficiency curve shown against the ideal value of unity (dotted gray line).

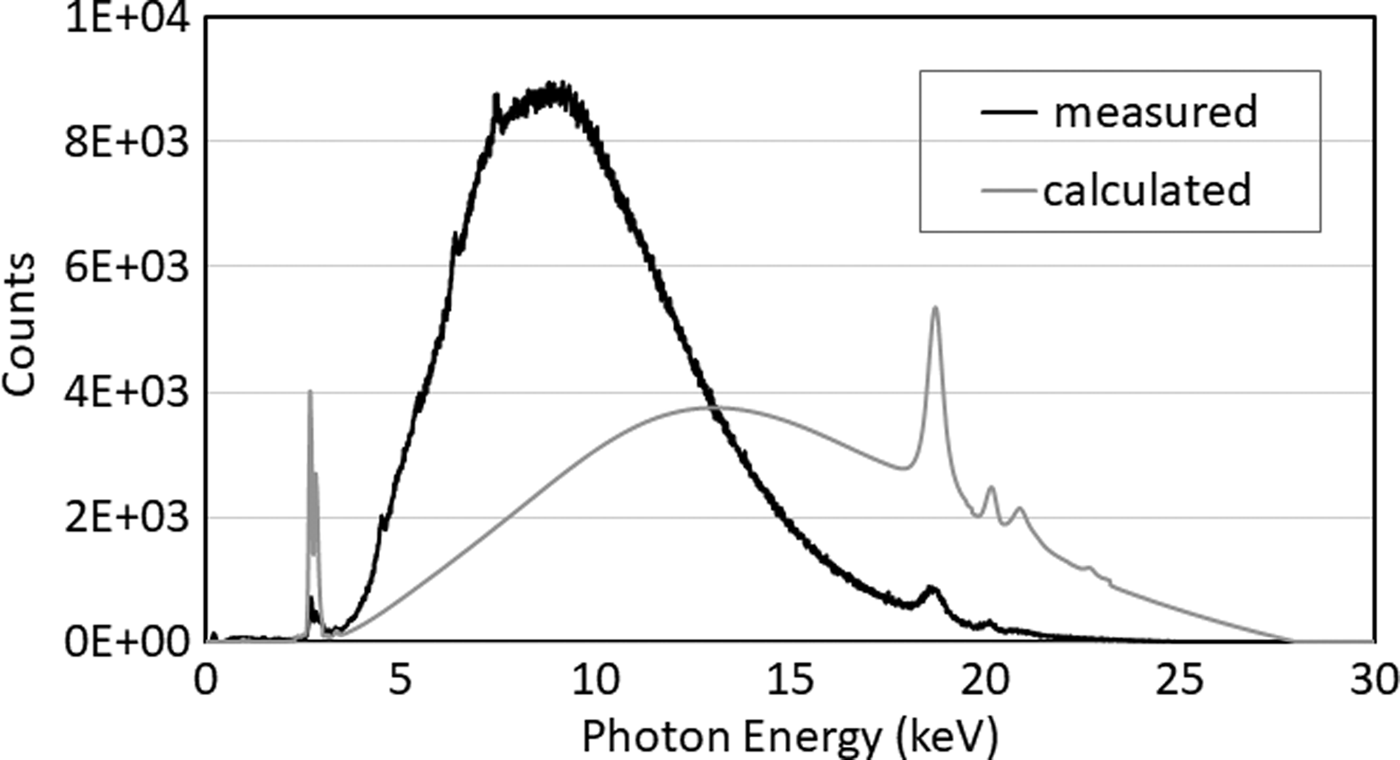
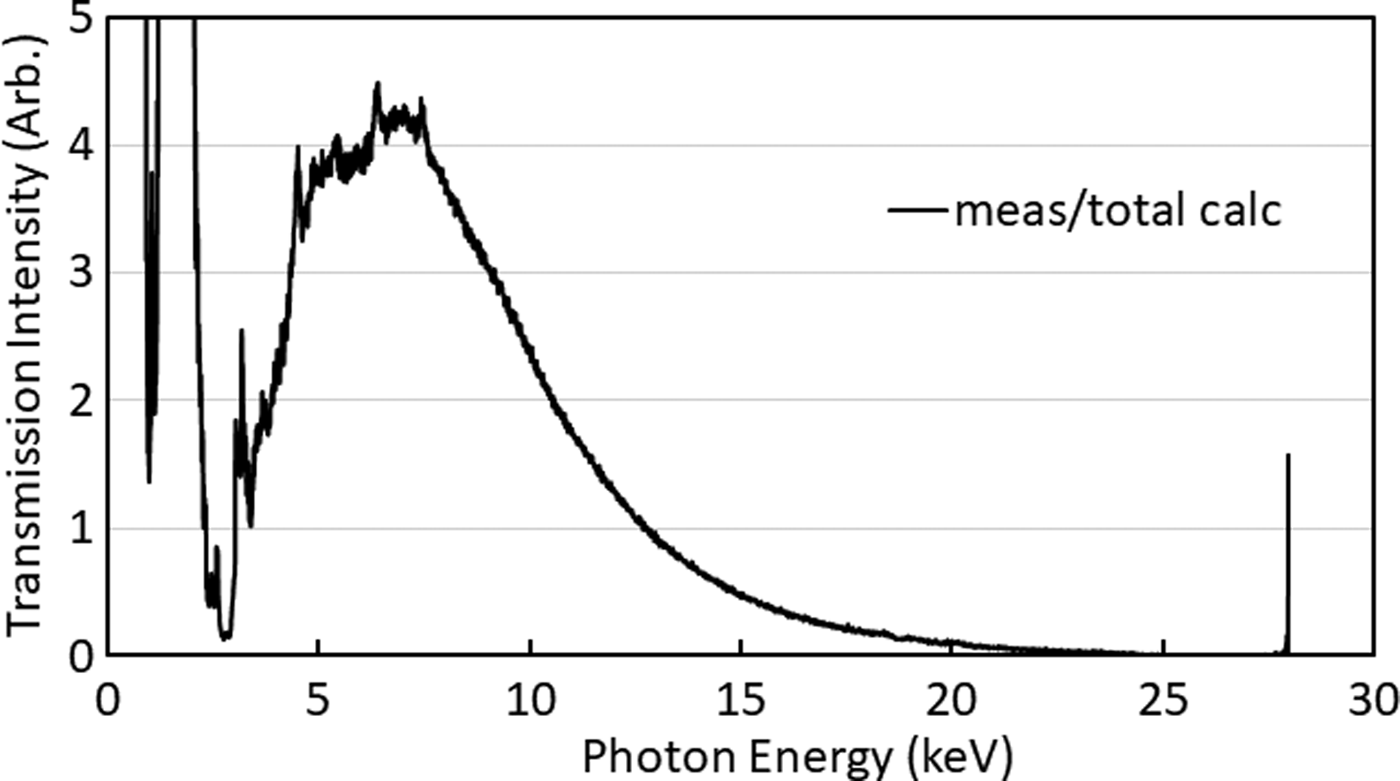
The XRF measurement of water and the spectrum calculated for a water measurement in the absence of the beam are shown in Figure 2. A point-by-point division of the measured over calculated spectra is plotted in Figure 3. Without refinements, this plot is a crude representation of the true optic transmission curve. Several peak and edge artifacts and discontinuities in this plot are apparent and required treatment (described below) prior to the refinement of the final curve.
Comparison of the measured water spectrum to the spectrum calculated by PIQUANT assuming that no optic is present. Both Rh K and L X-ray lines are visible in both datasets.

Initial estimation of the optic transmission function obtained by dividing the measured water spectrum by the calculated spectrum. Low-intensity counts around 2.7 keV correspond to the locations of Rh L lines. Spikes in data are visible at the locations of trace elements, which are not accounted for in the calculated spectrum.

The data points contributing to the sharp rise at 28 keV were deleted and the curve was extrapolated from the remaining highest energy points. Also removed were small peaks attributed to Ca, Ti, Cr, Fe, and Ni K X-ray lines. A Ca peak was attributed to the trace amounts of Ca present in the water sample. Ti and Ni were attributed to the activation of the detector's internal collimation and external casing at the detector mouth, respectively. Both Cr and Fe peaks are assumed to originate from secondary activation of the XOS optic casing that is present in the line-of-sight of the detector windows.
The energy range 2.8–3.7 keV presented numerous discontinuities because of the complex overlap of the Rh Lγ, a small Ar K X-ray peak, and calculated L absorption edges of the Rh tube. Data in this range were therefore deleted, while the data at 2.6–2.8 keV, which corresponded primarily to the division of the measured over calculated Rh Lα and Lβ line profiles, were considered to be a reasonable estimate of the transmission efficiency in this region and were thus retained.
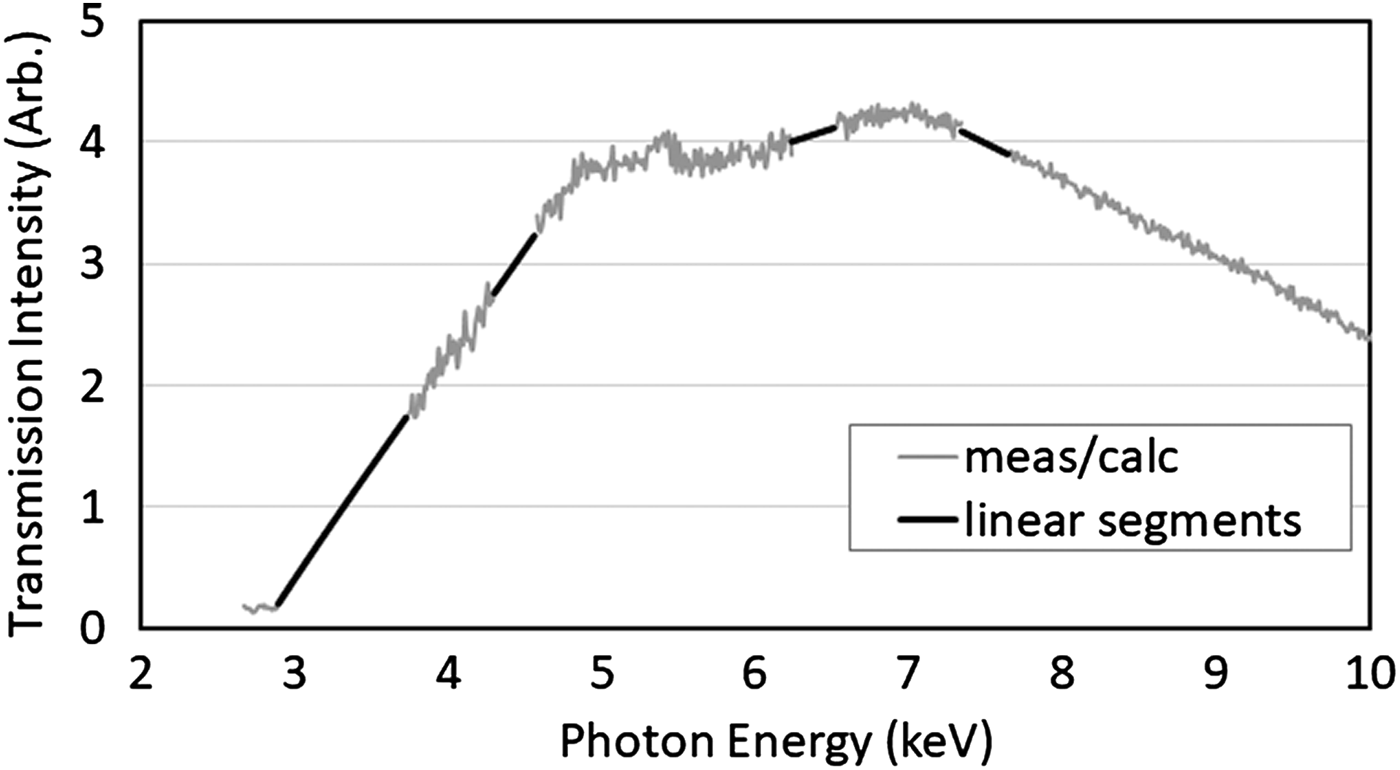
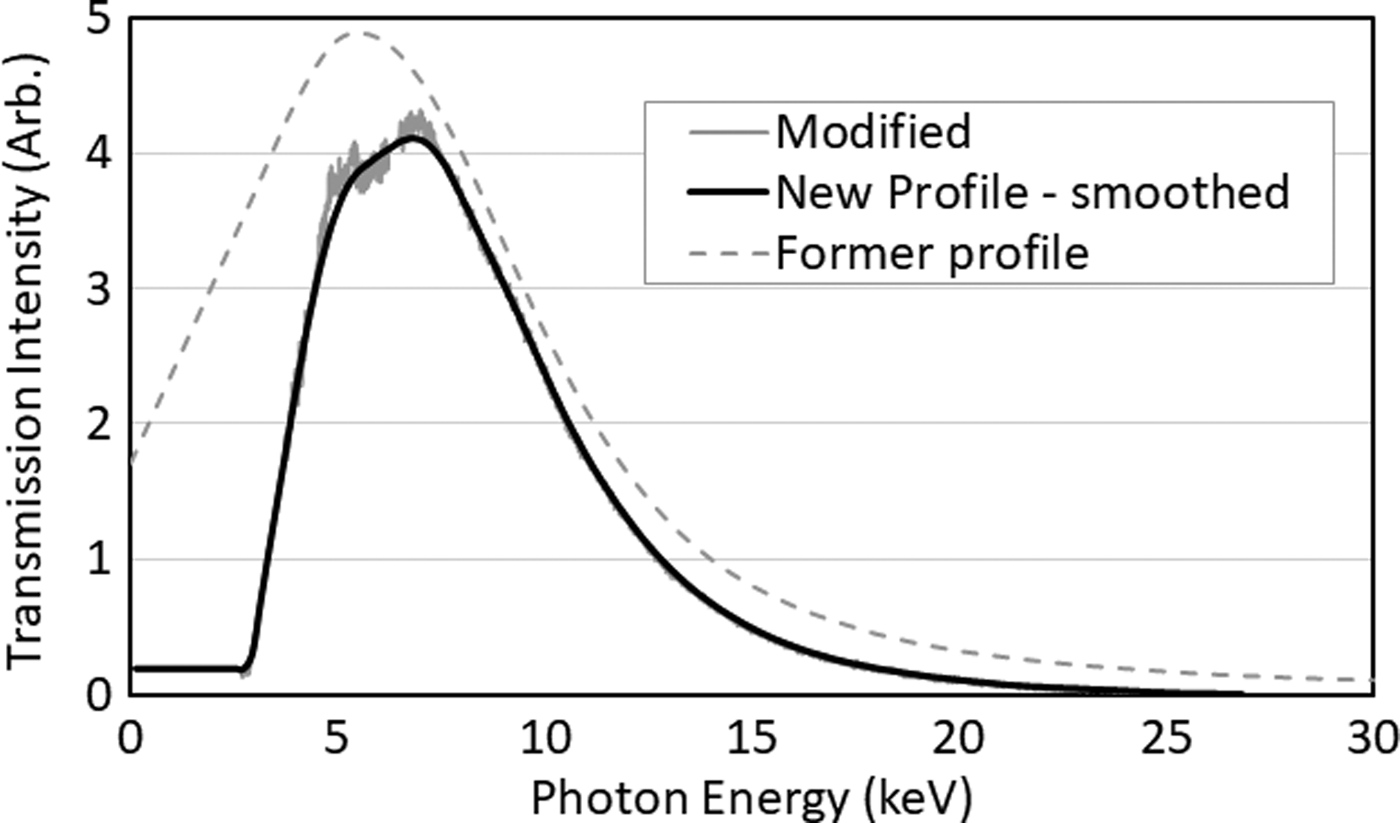
Below 2.6 keV, the transmission profile diverges to infinity. These data points were also deleted and extrapolation from the Rh L line region down to 0 keV was assumed. Deleted data were replaced with points interpolated from nearest neighbor data, derived using linear fit segments (Figure 4). This step of connecting the missing regions was used to produce a non-zero data point for every channel in the plot so that a basic boxcar-smoothing algorithm could be utilized. In this algorithm, data points were calculated using the average of intensity values from the ±80 channels adjacent to the central channel and produced the smooth final transmission curve seen in (Figure 5 – black line).
Refined transmission profile from Figure 3 with peak and edge regions excised and replaced with linear fit segments (black lines) connecting smooth data regions.

A comparison of the transmission profile following the addition of interpolated linear segments (solid gray line), the transmission profile after refinement through box-car smoothing (solid black line), and the former profile adopted from earlier models of optic instruments (dashed gray line).

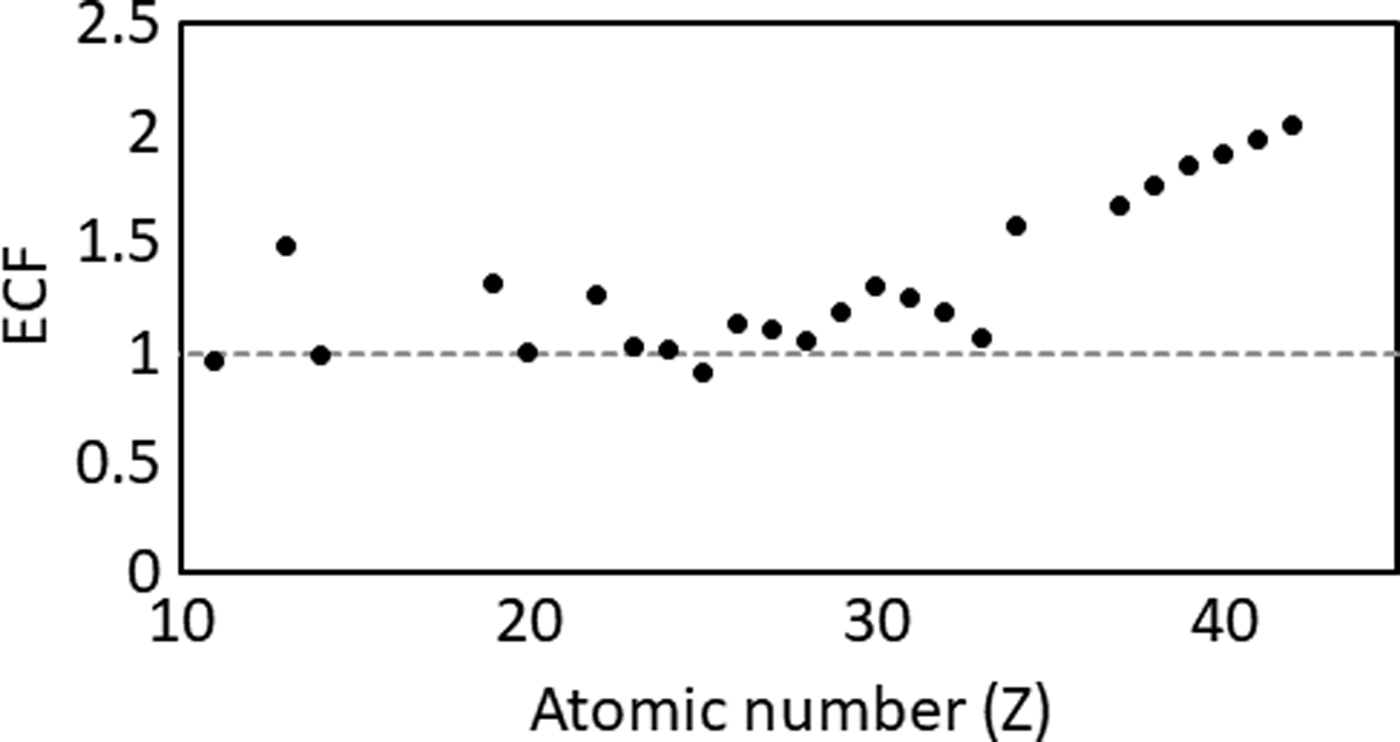
The modified transmission curve was then incorporated into PIQUANT and used to rederive the ECFs from the NIST SRM 610 measurement (Figure 6). The plot shows an improvement in the overall trend for the ECFs of lighter elements. However, the higher Z ECF values show a smooth trend to values significantly in excess of unity.
ECFs calculated using PIQUANT for elements in NIST SRM 610 with the ideal transmission profile of unity (dotted gray line).

V. DISCUSSION
The data below 2.5 keV in Figure 3 diverge to infinity in the division of measured over calculated spectra. Since a combined window thickness of 275 µm Be stands between the Rh anode (anode window 250 µm) and the optic output (two 12.5 µm end windows), most of the counts from the tube are attenuated below this energy. This accounts for the calculated spectrum intensity going to zero in this region. However, the measured spectrum is non-zero in this region, owing primarily to probabilistic electron escape and incomplete charge collection processes that occur in the Si detector wafer. The physics of these phenomena are well documented (Lowe, Reference Lowe2000; Campbell et al., Reference Campbell, McDonald, Hopman and Papp2001; Papp, Reference Papp2003; Eggert et al., Reference Eggert, Boslau, Kemmer, Pahlke and Wiest2006; Scholze and Procop, Reference Scholze and Procop2009) but are not reproduced by our modeling code. Thus, since the measured/calculated division is a positive number divided over zero, the calculation diverges.
Fortunately, the 2.6–2.8 keV region at the Rh L X-ray lines provides a reasonable estimate of the efficiency, thereby providing a low-energy anchor point. Given the absence of good data below 2.6 keV, we have simply extrapolated a constant efficiency value of 0.19 down to 0 keV. We rationalize that any error in this low-energy (<2.5 keV) approximation will have minimal impact on future work since most of the low-energy photons are attenuated by the combined Be windows and henceforth do participate in elemental excitation.
The ECF data in the low- and high-Z regions showed the strongest augmentation (compare Figures 1 and 6) when switching from the former profile to that derived in this work. It is apparent that the proportional differences in the old and new curves are greatest in the low- and high-energy regions of the profile (intra-comparison, Figure 5). The improvement in the ECF trend for light elements strongly suggests that the drastic change in the low-energy portion of the profile is real and accurate. At higher energies, the diverging trend manifests because the primary radiation has an increased average depth of interaction in the water, relative to the basalt targets. The increased average interaction depth in water reduces the target-to-detector effective solid angle. Presently, PIQUANT does not correct for changes to the nominal solid angle because of the target-specific absorption conditions (i.e., density and mass attenuation coefficients). Instead, the ECFs for elements excited by the higher energy photons are increased by PIQUANT to compensate for the diminished solid angle. The outcome is the rising trend in the ECF data observed in Figure 6. Therefore, our highest confidence in the derived profile is presently restricted to the lower energy (0–12 keV) region where the ECF data do not differ substantially from unity.
We acknowledge that the issues in this method persist in the high-energy region and that even derivation of the low-energy portion was somewhat challenging. However, the constant value trend in the low-energy ECF data indicates that this method was largely successful. Since lower energy photons from our setup are primarily responsible for the excitation of major element constituents (i.e., Z = 11,…, 26) commonly found in rock materials, we consider that the present curve is satisfactory for immediate use. As well, the divergent trend of the higher energy portion of the ECF curve is likely to be largely resolved once the software is upgraded to correct for the effective solid angle.
One future direction this work may take is to incorporate the method of Wolff et al. (Reference Wolff, Malzer, Mantouvalou, Hahn and Kanngieβer2011) in which derived instrument efficiency constant ECFs (denoted K – values in the latter reference) are used to provide data to construct the profile in the low- and high-energy regions.
VI. CONCLUSION
This work contributes an additional example of a straightforward method to derive an optic transmission profile. As part of the effort to calibrate the PIXL prototype instrument, this method was adopted because of its relative simplicity. In this example, a boxcar smoothing routine was chosen over a prescribed function for the task of refining the final profile product. Improvements made to the profile were assessed through PIQUANT-calculated ECF efficiency constants. The greatest improvement was to the low-energy region of the profile, which ultimately improves the accuracy of light element (Z = 11,…, 26) quantification. Future work is needed however to improve the ECF computation in the high-energy region of the derived profile.
Acknowledgements
This work was carried out at the Jet Propulsion Laboratory, California Institute of Technology, under a contract with the National Aeronautics and Space Administration.