INTRODUCTION
Barley (Hordeum vulgare L.) is a vital source for food, animal feed and beverage production and has been grown for centuries in China (Ullrich, Reference Ullrich2010). Recently, the primary use of barley has focused on animal feeds with increasing demands of livestock products. Barley grain has been traditionally used as an animal feed in China with little attention being placed on the use of green forage, which is also an ideal source for animal feeds (Birhan, Reference Birhan2013; El-Shatnawi et al., Reference El-Shatnawi, Al-Qurran, Ereifej and Saoub2004; Royo et al., Reference Royo, López, Serra and Tribó1997). Barley green forage can be a valuable source of feed in China in winter and early spring when other sources are not available.
Defoliation is a routine method for the management of grassland (Hamilton et al., Reference Hamilton, Kallenbach, Bishop-Hurley and Roberts2013; Pitman, Reference Pitman2013). Previous studies have reported the effects of defoliation on plants, including wheat (Shao et al., Reference Shao, Zhang, Hideki, Tsuji and Chen2010), wall barley (El-Shatnawi et al., Reference El-Shatnawi, Ghosheh, Shannag and Ereifej1999) and barley (Gu and Marshall, Reference Gu and Marshall1988). Defoliation timing has been identified to influence yield, shoot production and forage quality in both wall barley (El-Shatnawi et al., Reference El-Shatnawi, Ghosheh, Shannag and Ereifej1999, Reference El-Shatnawi, Al-Qurran, Ereifej and Turk2003) and barley (Birhan, Reference Birhan2013; Jenkyn and Anilkumar, Reference Jenkyn and Anilkumar1990).
The capacity for re-growth of barley after defoliation enables it to be used as both forage and grain (Royo et al., Reference Royo, López, Serra and Tribó1997). Most of the previous reports are concentrated on the impacts of defoliation pattern and defoliation frequency on the re-growth of barley (Jebbouj and Yousfi, Reference Jebbouj and El Yousfi2009) and the effects of sowing dates and cutting stages on forage yield and quality and grain yield (GY) (Royo, Reference Royo1999; Royo et al., Reference Royo, López, Serra and Tribó1997). Few researches have been reported on genotypic differences in forage yield and quality and interaction between genotype and defoliation. To obtain detailed information on the management of barley as a dual purpose crop, we aim to illustrate the effects of defoliation on the performance of green forage and final GY of different barley genotypes from different regions.
MATERIALS AND METHODS
Plant materials and experimental design
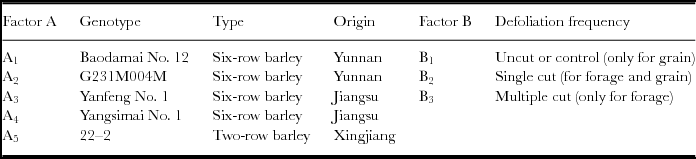
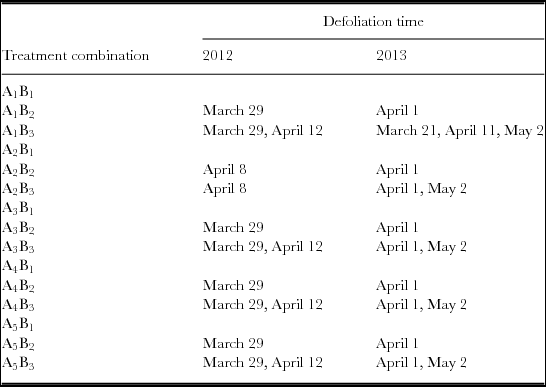
Five feed barley cultivars and breeding lines (Factor A) and three levels of defoliation treatments (Factor B) were involved in this study (Table 1). The specific dates of treatment and genotype × treatment combinations were listed in Table 2. These five representative barley genotypes included three commercial cultivars: Baodamai No. 12 from Yunnan province and Yanfeng No. 1 and Yangsimai No. 1 from Jiangsu province; and the other two advanced lines (G231M004M and 22–2) from Yunnan and Xinjiang provinces, respectively. Among all these lines, the 22–2 is a two-row barley and the rest of them are six-row barleys (Table 1).
Types and origins of barley lines and defoliation frequency applied in the experiment.

Date of each defoliation treatment applied through the growing seasons 2011–2012 and 2012–2013.

A randomized complete block design was used in this study, and the field trials were conducted over two consecutive crop seasons, 2011–2012 and 2012–2013 at the Experimental Station of Anhui Academy of Agricultural Sciences, Hefei, China (31°89′ N and 117°25′ E). Since barley is an autumn-sown crop in Hefei and the forage biomass is extremely limited at tillering stage, defoliation was carried out when the plant height reached 40 cm (trigger height) between jointing and booting stage. The stubble height after cutting was 5 cm above ground. Three levels of defoliation treatments were as follows: treatment B1 (uncut or control for grain), B2 (single cut for forage and grain) and B3 (multiple cut only for forage).Whenever the re-growth reached the trigger height (Table 1), each plot received fertilizer as follows: 195 kg N ha−1, 75 kg P2O5 ha−1 and 75 kg K2O ha−1, and additional 35 kg N ha−1 was added in each plot after forage removal. The plot size was 6.7 m2 with a sowing density of 300 seeds/m2, and each treatment was designated in three replications.
Green forage yield
Green forage samples removed from the trials were weighed before drying at 80°C for 72 h to measure the dry weight and test nutritional elements. The ratio of dry weight to fresh weight (DTF) was further calculated.
Green forage quality
During the growing season of 2011–2012, defoliated forage samples were collected from B3. The samples were dried and ground for further quality test. The components, including crude ash (CA), crude protein (CP), crude fat (CF), crude fiber (Cfib), calcium (Ca) and phosphorus (P), were measured. Experimental procedure was determined in accordance with standard methods (Editorial Office No. 1, China Standards Press, 2010).
Grain yield and agronomic traits
Since treatment B3 showed severe effect on GY, GY of only treatments B1 and B2 were compared to assess the influence of defoliation on re-growth and yield rebuilding in barley. Six individual plants in a plot were randomly sampled to investigate agronomic characteristics, including plant height (PH), internode length below spike (ILBS), spike length (SL), number of spike per plant (NSPP), grain number per spike (GNPS) and thousand kernel weight (TKW) throughout the two consecutive growing seasons.
Statistical analysis
Differences between treatments for each trait were identified by analysis of variance (ANOVA) using the statistical analysis package SAS (SAS Institute, 2004). Linear model can be displayed as: y ijk = μ + α i + β j + (αβ ij) + ε ijk, where μ is the general mean; α i is the mean effect of genotype (factor A); β j is the mean effect of defoliation frequency (factor B); αβ ij is the interaction between factors A and B and ε ijk is the effect of error. The measured mean values for traits were compared by the Duncan's Multiple Range Test. Simple correlation analysis was performed to analyse the relations between variables. Statistical results were considered significant if the probability was significant at p ≤ 0.05.
Climate and time of defoliation
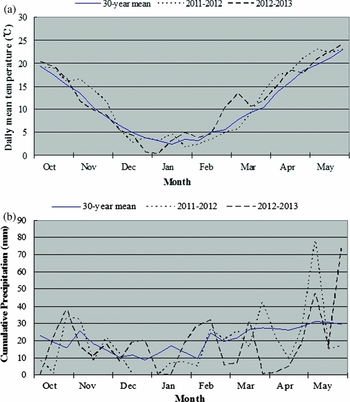
Data of temperature and precipitation through the growing stage of barley were recorded for both years (data from the Hefei Meteorological Administration, Hefei, China) (Figure 1). During the growing season of 2011–2012, the defoliation was performed only once for genotype ‘G231M004M’ (April 8) and twice for the rest of the lines (March 29 and April 12) for treatment B3 (Table 2). In the growing season 2012–2013, an extra defoliation was for genotype ‘Baodamai No. 12’ (March 21, April 11 and May 2), while the others were only defoliated twice (April 1 and May 2) (Table 2).
Daily mean temperature (a) and cumulative precipitation (b) during 2011–2012 and 2012–2013 seasons and over the preceding 30 years.

RESULTS
Effects of defoliation on green forage yields
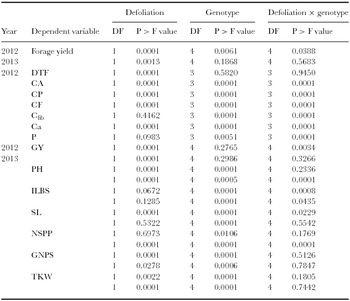
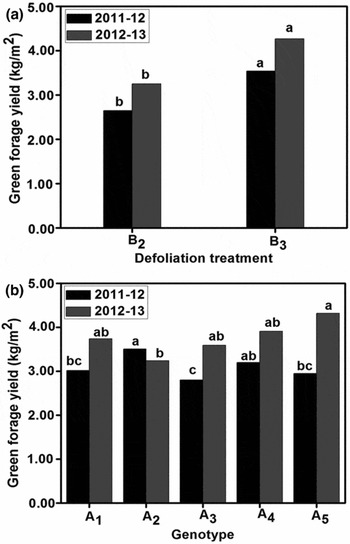
Green forage yields varied significantly between two defoliation patterns in both growing seasons (Table 3). The accumulative green forage yields were 3.54 kg/m2 and 4.27 kg/m2 for treatment B3 as compared with treatment B2 with the values of 2.65 kg/m2 and 3.25 kg/m2, respectively, in the growing seasons 2011–2012 and 2012–2013 (Figure 2a). A significant variation in green forage yields was identified among barley genotypes only in the first growing season with the mean values ranging from 2.80 kg/m2 (Yanfeng No. 1) to 3.51 kg/m2 (G231M004M) (Table 3, Figure 2b). Similarly, the interaction between defoliation and genotype was only detected in the first growing season (Table 3).
Effects of defoliation treatment, genotype and interactions between them on barley green forage yield and quality, grain yield and its correlated traits through the growing seasons 2011–2012 and 2012–2013.

Comparison of green forage yields in defoliation treatments B2 and B3 (a), and among genotypes (b) through the growing seasons 2011–2012 and 2012–2013.

Effects of different cuts on green forage quality
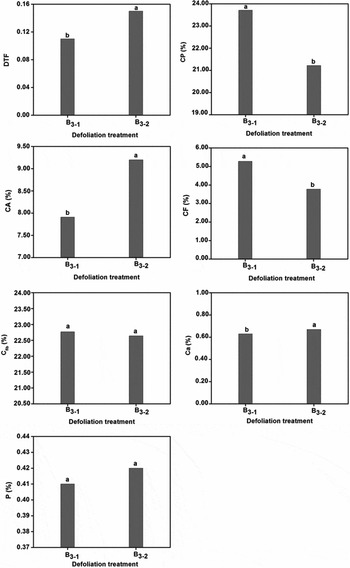
All barley lines were subjected twice to defoliation during the growing season of 2011–2012 except for A2 (G231M004M), which received only once, whereas B3–1 and B3–2 represented respectively the first and the second cut for treatment B3 (Table 2). Seven feed quality traits were evaluated to identify the effects of defoliation frequency on green forage quality. DTF, CA and Ca contents improved significantly, while CP and CF contents decreased due to repeated defoliation (Table 3, Figure 3). Changes in CP content ranged from 23.71% in treatment B3–1 to 21.22% in treatment B3–2, suggesting that excessive defoliation may result in the decline of green forage quality in barley (Figure 3). No significant differences in Cfib and P were found between treatments B3–1 and B3–2 (Table 3, Figure 3).
Comparison between different cuts of B3–1 and B3–2 for forage quality traits, including the ratio of dry weight to fresh weight (DTF), crude protein (CP), crude ash (CA), crude fat (CF), crude fiber (Cfib), calcium (Ca) and phosphorus (P) contents through the growing season 2011–2012.

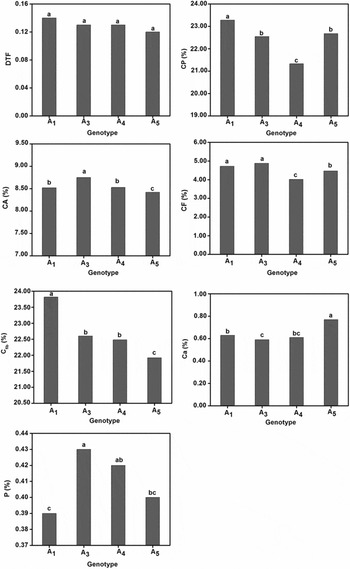
All seven quality traits but DTF varied significantly among genotypes (Table 3). The CP and Cfib content among genotypes ranged from 21.33% (Yangsimai No. 1) to 23.28% (Baodamai No. 12) and from 21.92% (22–2) to 23.82% (Baodamai No. 12) respectively (Figure 4). Genotype ‘Yanfeng No. 1’ was deemed to be the optimal candidate when combining the performance of both CP (22.55%) and Cfib (22.60%) (Figure 4).
Comparison between genotypes for forage quality traits, including DTF, CP, CA, CF, Cfib, calcium and phosphorus contents through the growing season 2011–2012.

Effects of defoliation on grain yield and its related traits
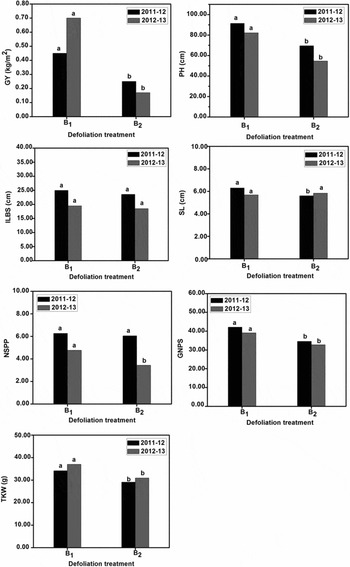
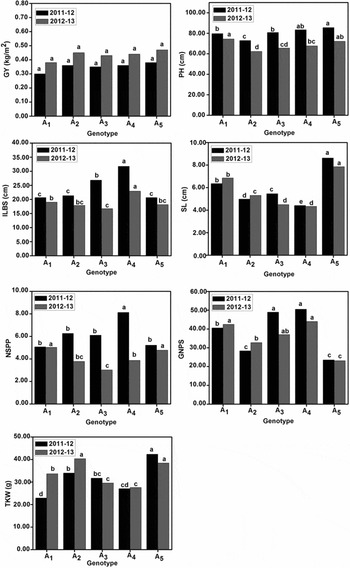
Plant height and other yield components under different defoliation treatments of B1 (control) and B2 were compared through the two consecutive years, and the results are listed in Table 3, and shown in Figure 5. Significant changes in GY were identified between treatments B1 and B2, but not among genotypes (Table 3, Figure 6). In contrast to treatment B1 (control), GY reduction in B2 was from 0.45 to 0.25 kg/m2 and from 0.70 to 0.17 kg/m2 respectively in the two seasons (Figure 5). Significant effect of interaction between genotype and defoliation on GY was only found in the growing season 2011–2012 (Table 3).
Comparison between defoliation treatments B1 and B2 for grain yield (GY) and its correlated traits, including plant height (PH), internode length below spike (ILBS), spike length (SL), number of spikes per plant (NSPP), grain numbers per spike (GNPS) and thousand kernel weight (TKW) through the growing seasons 2011–2012 and 2012–2013.

Comparison between genotypes for GY and its correlated traits, including PH, ILBS, SL, NSPP, GNPS and TKW through the growing seasons 2011–2012 and 2012–2013.

Six other traits were compared between treatments B1 and B2 to evaluate re-growth ability. The results indicated that PH, GNPS and TKW were significantly reduced by defoliation, while no significant changes were identified in ILBS (Table 3, Figure 5). Significant reduction in SL and NSPP by defoliation was found in the growing seasons 2011–2012 and 2012–2013 respectively. All six traits varied significantly among genotypes (Table 3, Figure 6). Significant interaction between defoliation and genotype was found in both years for ILBS, but only in one year for PH, SL and NSPP (Table 3). Of all the traits, only PH was significantly correlated with GY.
DISCUSSION
Variation in green forage yields
Our current data demonstrated that the green forage production of barley increased significantly by repeated defoliation, and varied significantly among genotypes (in one year), implying that selection of genotypes with optimal defoliation frequency will result in greater forage yield. Differences of forage yield were also found among barley genotypes (Pal and Kumar, Reference Pal and Kumar2009) and between barley and triticale (Royo et al., Reference Royo, López, Serra and Tribó1997). According to our present study, multiple cut is recommended for greater forage production in the winter barley region of China. Effects of genotype and interaction between genotype and defoliation on forage yield appeared to be affected by environmental factors as well. Differences in forage yield may be related to both higher temperature and precipitation from late March to mid-April in the first season (Figure 1). Herbage production of perennial grasses was also reported to be responsive to environments (Boschma et al., Reference Boschma, Murphy and Harden2014). Therefore, environmental conditions, such as temperature and rainfall, should also be considered for the management of forage production in barley.
Variation in green forage quality
Decrease in CP concentration with re-growth may be related to forage age, and is due, in part, to acceleration of carbon assimilation ratio in the relatively shorter recovery growth stage (Chen et al., Reference Chen, Zhao, Wang and Ji2015). Other reports also showed decline in CP concentration during re-growth in cocksfoot (Rawnsley et al., Reference Rawnsley, Donaghy, Fulkerson and Lane2002) and in perennial ryegrass (Fulkerson et al., Reference Fulkerson, Slack, Hennessy and Hough1998). Increased contents of DTF and CA occurred during the second cut, indicating that repeated defoliation can result in the decline of palatability of feed. Thus, green forage by the first cut can be directly used to feed animals, and the recovered forage is more suitable for silage use.
A large variation in most forage quality traits emerged among genotypes, so that it is feasible to select ideal genotypes for better quality forage use. ‘Yanfeng No. 1’ is presented to be the optimal genotype in terms of combined performance of both CP and Cfib. Forage quality was affected by the interaction effect of genotype and defoliation, which was also reported in forage legumes (Kleen et al., Reference Kleen, Taube and Gierus2011). The results indicate that both genotypes and defoliation contribute to the higher forage quality performance.
Variation in grain yield during re-growth
Our study indicated that defoliation gave rise to apparent reduction in GY and its correlated traits, PH, GNPS and TKW. Reduction in GY by forage removal might be related to late cutting stage (between jointing and booting stages), which resulted in the greater loss of GY in barley (Royo, Reference Royo1999; Royo et al., Reference Royo, López, Serra and Tribó1997). Consistent grain losses due to defoliation were reported in both barley (Jebbouj and Yousfi, Reference Jebbouj and El Yousfi2009; Jenkyn and Anilkumar, Reference Jenkyn and Anilkumar1990) and wheat (Zhu et al., Reference Zhu, Midmore, Radford and Yule2004). Single cutting may be the optimal choice to achieve both forage supply in winter and early spring and grain harvest in summer for the majority of winter barley region in China.
Correlation analysis of GY and its related traits showed that only PH was significantly correlated to GY. Although changes in GY components showed no significantly positive correlation with GY losses, visible reduction by defoliation was identified in GNPS and TKW through the two growing years and in NSPP in one year. Thus, diminished grain number and grain weight by forage cutting could be the major factors leading to yield reduction.
No significant changes in GY were identified among genotypes under the defoliation system, while changes in yield components were significant through the two growing seasons. Interaction effects of genotype and defoliation appeared complex to interplay changes in GY and its correlated traits, of which variation in GY appeared similar to that of forage yield (significant only in the first growing season). Although reduction in GY appears to be inevitable for most of barley genotypes after forage removal, it is feasible to achieve both forage and grain harvests by combining optimal genotypes and defoliation systems in practical breeding programmes.
CONCLUSIONS
In summary, effects of defoliation treatments, genotypes and interaction between these play a pivotal role in changes of green forage yield and quality, and GY in barley. We found that the green forage yield of barley was enhanced by repeated defoliation, but GY correspondingly declined during the re-growth stage. Also, environment may have some impact on forage performance and GY of barley. Selection for ideal barley genotypes for forage and grain uses appeared to be viable in this study.
Acknowledgements
We would like to thank Dr. Christina King of the University of Oklahoma for assistance in the writing of the paper, and Daxin Ling for field trial management. Our special thanks go to Dr. Meixue Zhou at the Tasmanian Institute of Agricultural Research, Australia for his valuable comments. The research was financially supported by the earmarked fund for China Agriculture Research System and the Youth Innovation Fund Project from Anhui Academy of Agricultural Sciences (13B0218).