INTRODUCTION
Currently, there is a considerable research effort aimed at investigating the variability in rocky shore communities, where a combination of abiotic and biotic factors operate at different spatial scales (e.g. Underwood, Reference Underwood, Floyd, Sheppard and De Barro1996; Aberg & Pavia, Reference Aberg and Pavia1997; Hyder et al., Reference Hyder, Johnson, Hawkins and Gurney1998; Benedetti-Cecchi, Reference Benedetti-Cecchi2001; Chapman, Reference Chapman2002). These studies have shown that patterns in species assemblages are not scale-independent, indicating that changes in the composition of assemblages are more visible at particular scales than at others. The most general conclusion is that variability at small scales, from centimetres up to 1000s of metres, is at least as high as variability at large scales of distances of several kilometres.
The approach of these studies to the analysis of spatial patterns with reference to investigated sources of variation, can be considered as a novelty in rocky shore ecology. Random sources of variation are examined at a hierarchy of spatial scales and estimates of the contribution of each scale to the total variation among samples allow comparison of variability across these scales (Morrisey et al., Reference Morrisey, Howitt, Underwood and Stark1992; Underwood, Reference Underwood, Floyd, Sheppard and De Barro1996). These analyses include a wide range of processes that may be important in structuring rocky shore assemblages, regardless of whether specific models about relevant processes can be suggested or not (Benedetti-Cecchi, Reference Benedetti-Cecchi2001). In contrast, an approach used in more traditional studies has evaluated patterns of variation in assemblages along environmental gradients (e.g. Stephenson & Stephenson, Reference Stephenson and Stephenson1949; Bell et al., Reference Bell, Lechowicz, Appenzeller, Chandler, DeBlois, Jackson, Mackenzie, Preziosi, Schallenberg and Tinker1993). This approach can bias the analysis towards the most obvious source of variation that generates the specific gradient, while other potentially important, but less evident sources might remain undetected.
Most obvious on rocky coasts in many parts of the world are the spatial zonation patterns of organisms, as distinct vertical bands, in response to the major gradient of emersion (Southward, Reference Southward1958; Stephenson & Stephenson, Reference Stephenson and Stephenson1972; Lewis, Reference Lewis1978). Besides physical factors, biological interactions such as competition (e.g. Connell, Reference Connell1961; Dayton, Reference Dayton1971), grazing (e.g. Hawkins & Hartnoll, Reference Hawkins and Hartnoll1983; Jenkins et al., Reference Jenkins, Hawkins and Norton1999a, Reference Jenkins, Hawkins and Nortonb) and predation (e.g. Paine, Reference Paine1974; Lubchenco & Menge, Reference Lubchenco and Menge1978) are important in maintaining vertical distribution patterns of organisms on rocky shores. However, in recent years, it has been shown that most intertidal algae and invertebrates are distributed extremely patchily at small spatial scales (centimetres to metres) within any height on rocky shores (e.g. Underwood & Chapman, Reference Underwood and Chapman1996; Menconi et al., Reference Menconi, Benedetti-Cecchi and Cinelli1999; Fraschetti et al., Reference Fraschetti, Terlizzi and Benedetti-Cecchi2005). These complex spatial patterns may be related to small-scale changes in behavioural responses (e.g. Underwood & Chapman, Reference Underwood and Chapman1989; Chapman & Underwood, Reference Chapman and Underwood1994), recruitment (e.g. Chapman & Underwood, Reference Chapman and Underwood1998), the interactive effects of abiotic and biotic factors (Benedetti-Cecchi et al., Reference Benedetti-Cecchi, Bulleri and Cinelli2000a) and small-scale changes in physical factors such as slope (Benedetti-Cecchi, Reference Benedetti-Cecchi2000), or elevation of the substrate at a standard height within any vertical intertidal zone. The slope of the substrate may explain spatial heterogeneity within any vertical height on the shore, whereas elevation of the substrate remains mostly unquantified. Elevation can be defined as the standard height of any intertidal location, either vertical or horizontal, calculated from a reference point. The fact that elevation remains mostly unquantified may partly be explained by the general lack of continuous measurements of the term ‘elevation’ such as in digital elevation models constructed by e.g. airborne or terrestrial laser scanning.
Moreover, most studies examining patterns of variation of rocky shore assemblages have concentrated on geographical regions in Australia, the Mediterranean or the North Atlantic (e.g. Underwood & Chapman, Reference Underwood and Chapman1998; Menconi et al., Reference Menconi, Benedetti-Cecchi and Cinelli1999) and have focused on a few species only (e.g. Underwood & Chapman, Reference Underwood and Chapman1996; Benedetti-Cecchi et al., Reference Benedetti-Cecchi, Acunto, Bulleri and Cinelli2000b; Jenkins et al., Reference Jenkins, Aeberg, Cervin, Coleman, Delany, Della Santina, Hawkins, LaCroix, Myers, Lindegarth, Power, Roberts and Hartnoll2000, Reference Jenkins, Arenas, Arrontes, Bussell, Castro, Coleman, Hawkins, Kay, Martinez, Oliveros, Roberts, Sousa, Thompson and Hartnoll2001). However, studies examining spatial patterns of species assemblages in the North Sea are rare (Li et al., Reference Li, Vincx, Herman and Heip1997). Species assemblages of the relatively small Helgoland rocky littoral in the German Bight (North Sea) have been studied for more than a century (Harms, Reference Harms1993). However, spatial patterns of algal and invertebrate communities in rocky intertidal locations of Helgoland have only been ill-defined. There are few intertidal studies which demonstrate an initial attempt to reveal possible temporal variation in the composition of algae and invertebrates over the past decades (Bartsch & Tittley, Reference Bartsch and Tittley2004; Reichert & Buchholz, Reference Reichert and Buchholz2006). However, there is no evidence so far if spatial patterns of the hard-bottom assemblages are dependent on the scale of measurement and if processes operate at one or more spatial scales.
Accordingly, the objective of this work was to investigate the variation in species richness and total abundance at defined spatial scales. Furthermore, we explored the influence of elevation on these species attributes in two rocky intertidal locations of Helgoland, the northern and western locations. We examined the variation of algae and invertebrates as well as the relevance of elevation by means of a nested sampling design. Our sampling design included two spatial scales at both study locations: transects separated by 65 and 45 m as well as plots separated between 5–40 m and 7–10 m at the northern and western location respectively. We used this sampling design to test the general hypotheses that: (1) variation was important at any scale defined; and (2) spatial patterns of algae and invertebrates were associated to patterns of elevation. We also used the information on the spatial patterns of algae and invertebrates as well as the patterns of elevation to provide recommendations for a monitoring programme of the rocky intertidal at Helgoland.
MATERIALS AND METHODS
Study locations
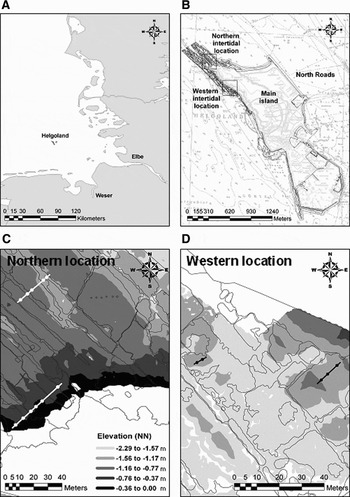
This survey was conducted at two intertidal locations at Helgoland, German Bight, North Sea (54° 11′N 7° 55′E), from summer 2004 until spring 2006 (Figure 1). The locations were in the northern and western part of the island, and were named after their geographical position. The northern and western intertidal locations differed in wave exposure and in the geomorphological structures of the rock-platform. The substrate was natural red sandstone and the degree of rugosity and hardness was approximately the same at both locations. The difference between mean high water spring (MHWS) and mean low water spring (MLWS) was 2.62 m (Lüning, Reference Lüning1985). De Kluijver (Reference De Kluijver1991), using the rate of erosion of standardized gypsum blocks, showed that the intensity of water movement was higher at the west side of Helgoland (0.14–0.16 g · h−1) than at the north-eastern site (0.14 g · h−1). In shallow places at the west side the erosion rates reached 0.28 g · h−1 during westerly winds (force 4–5). The prevailing winds around Helgoland are westerly (de Kluijver, Reference De Kluijver1991). Therefore, the western intertidal was defined as the exposed and the northern intertidal as the semi-exposed location. The geomorphological structure of the northern location is characterized by a series of channels (mean height: ~−1.00 m refers to the height normal null (NN) of the German height reference system; width: ~3–5 m) extending to the north-west direction towards the open sea separated by ridges (mean height to NN: ~−0.60 m; width: ~5–15 m). The ridges and channels alternated in the alongshore direction. The western location showed a more irregular order of channels (mean height to NN: ~−1.50 m; width: ~2–20 m) and ridges (mean height to NN: ~−1.00 m; width: ~5–25 m). The ridges form discrete patches enclosed by channels which were submerged during low tide.
(A) Location of Helgoland in the German Bight, North Sea; (B) the island with the northern and western intertidal locations; the scale of transects and plots at the (C) northern and (D) western study location with the drawn contours of the surface morphology and the elevation in metres refers to the height normal null (NN) of the German height reference system.

The species assemblages in the northern location show distinct vertical zones, whereas in the western location such conspicuous bands do not occur (Janke, Reference Janke1986; K.R. personal observation). Due to the seawall along the western part of the island high-shore assemblages are basically not existent at the rock-platform of the western location. The mid-shore assemblages of the western location are similar to those at low-shore. For the lower intertidal, both shores harbour qualitatively similar algal and invertebrate assemblages. The upper intertidal at the northern location is dominated by green algae of the genus Ulva. Most abundant invertebrates are tube-building polychaetes (mostly Polydora ciliata and Fabricia sabella). The mid-shore is dominated by the large brown alga Fucus serratus, encrusting algae (Ralfsia verrucosa and Phymatolithon lenormandii), the red alga Chondrus crispus and the seasonal green alga Rhizoclonium tortuosum. Characteristic invertebrates are the blue mussel Mytilus edulis and the periwinkle Littorina littorea. At the lower intertidal, most abundant organisms are the algae F. serratus, P. lenormandii, C. crispus and the articulated coralline Corallina officinalis as well as the snails L. littorea, L. mariae/obtusata (identified as a species complex) and Gibbula cineraria, and the spirorbid polychaetes (mostly Spirorbis spirorbis). In addition to these general patterns of distribution, there is a considerable microhabitat variation due to complex geomorphological structures of the substrate (K.R. personal observation).
Sampling design
At the semi-exposed northern location, two transects (separated by ~65 m) were selected at random from a set of possible transects, comparable in terms of type and slope of the substrate (Figure 1). Due to the small vertical and horizontal extension of the rock-platform we had to select one transect at high- and the other at low-shore. Thus, the distance between transects is measured perpendicular to the island's shoreline. The length of transects ranged between 25 and 40 m. Along each transect, six and five plots respectively (separated by 5–40 m) were chosen at random from a larger pool of plots, which was examined in a former study with reference to the community structure. Thus, for each plot the species assemblage was well-known by the results of a previous community analysis (Reichert et al., in preparation). Five replicated quadrats, separated by about one metre, were selected randomly at each plot.
At the exposed western location, two transects (separated by ~45 m) were selected randomly from a set of possible transects, comparable in terms of type and slope of the substrate as well as vertical tidal height (Figure 1). The length of transects ranged between 7 and 10 m. As for the northern location, along each transect plots were selected at random (three and two plots respectively, separated by 4–10 m) from a larger pool of plots examined previously by means of community analysis (Reichert et al., in preparation). Five replicated quadrats (separated by about one metre) were sampled randomly at each plot. For this location we sampled transects across the vertical axes at low-shore.
The positions of the 1st and 5th replicated quadrat at both study locations were recorded using a differential global positioning system (Geo XT, Trimble, Germany) with a mean accuracy of 1–2 m in the field. The positions of the remaining replicates were determined by recording their distance in situ, in x and y spatial coordinates, from the georeferenced replicates. The prevailing coordinates were processed with the programme ArcGIS 9.0 (ESRI).
At each study location, all plots (i.e. 55 and 25 quadrats respectively) were sampled at 3-month intervals over 2 years (summer 2004–spring 2006). All plots at each location were sampled at each 3-month interval within a period of a few days.
The height value of each replicated quadrat was obtained from the digital elevation model, generated for both study locations (see Figure 1). The height values refer to the height normal null (NN) of the German height reference system (hereafter: refer to height NN), and was taken out of the digital elevation model by means of the programme ArcGIS 9.0 (ESRI). At the northern location, the height difference (reference: height NN) was 0.75 m on average between transects, less than 0.40 m at the scale of plot and less than 0.20 m at the scale of replicate. At the western location, the difference was on average 0.10 m between transects and less than 0.30 m between plots and replicates.
Site map and digital elevation model
Figure 1 was created on the basis of georeferenced black and white (b/w) orthophotographs supplied by the Department of Geomatics of the HafenCity University Hamburg, Germany. The orthophotographs were generated on a digital photogrammetric workstation DPW770 from BAE Systems (using SOCET Set software) with a ground sampling distance of 10 cm per pixel using aerial images with a photograph scale of 1:7000 which were acquired in May 1999 by WESER Bildmessflug GmbH in Bremerhaven for the Landesvermessungsamt Schleswig-Holstein in Kiel. The digital aerial images were scanned with a resolution of 14 microns which corresponds to a pixel size of 10 cm on the ground, by the Landesvermessungsamt using a geometrically stable photogrammetric scanner. Subsequently, the images were transformed from central projection into orthogonal projection by differential rectification using the orientation data of each related image and a digital elevation model (DEM) which covers the intertidal study locations. In the geometric rectification process the related height value of the orthophotograph pixel will be interpolated from the DEM. For more detailed description of the generation of digital orthophotographs see Kersten & O'Sullivan (Reference Kersten and O'Sullivan1996). The DEM was generated by automatic digital image correlation on the DPW770 with grid spacing of 50 cm for the intertidal locations using b/w aerial images (photograph scale 1:7000). The used image correlation algorithm is described by Zhang & Miller (Reference Zhang, Miller, McKeown, McGlone and Jamet1997). Empirical accuracy investigations of the automatic generated intertidal DEM showed that the height points of the DEM have a standard deviation of ±18 cm compared to 180 check points which were measured by geodetic methods. The maximum and minimum values of the height differences were 40 cm and −79 cm compared to the reference values (Lehmann, Reference Lehmann2006). The DEM refers to the height NN of the German height reference system (DHHN).
Survey methods
In general, the communities comprised three different structural layers: top, middle and encrusting layer. The top layer usually consisted of thalli of large brown algae (e.g. Fucus spp. and Laminaria spp.). The middle layer was represented by epiphytic, epizoic and endozoic species growing erect from the substrate, but not reaching the top layer (e.g. hydrozoans, mussels and tube-building polychaetes). The encrusting layer was formed by epilithic organisms adhering directly to the substrate, such as bryozoans or encrusting algae of the genera Phymatolithon or Ralfsia (see also de Kluijver, Reference De Kluijver1991, Reference De Kluijver1993). In each structural layer the percentage cover of the vertical projection of sessile, slow moving invertebrates, and algae was estimated, using a 0.25 m2 quadrat. Some species were combined into a complex if the taxonomic position was tentative or if the morphological distinctions between two species were difficult to quantify or too time consuming to investigate. Examples of species combined into a complex are in Reichert & Buchholz (Reference Reichert and Buchholz2006).
Data analyses
MINIMAL AREA
Minimal area tests were performed for each of in total seven plots at our study locations. In summer 2004, ten 0.25 m2 quadrats were sampled at each plot which was characterized by a certain community type (Reichert et al., in preparation). Thus, the seven plots well described the community structure which occurred at the study locations. The minimal area was calculated with the programme MINAR (Kaandorp, Reference Kaandorp1986). The algorithm used in this programme is in Weinberg (Reference Weinberg1978). Here, the similarity is calculated between each possible combination of subsets of m elements out of the ten sampled quadrats, where the same element is not used twice in one combination (1 ≤ m ≤ 5). The data were log-transformed and similarity was calculated with the Bray–Curtis coefficient. The five similarity values were used as a function of the sampled surface. The level at which the minimal area was reached has been chosen according to Weinberg (Reference Weinberg1978) who suggested a similarity level of 70% between samples. The values for the minimal area ranged beween 0.5 m2 and 1.0 m2. Thus, the sampled area of five quadrats (1.25 m2) seemed to be sufficient for reaching the minimal area, when the similarity level of 70% was used.
SPECIES RICHNESS AND TOTAL ABUNDANCE
To evaluate patterns of variability in species richness or total abundance of algae and invertebrates among transects and plots at each location we used estimates of variance components. The spatial patterns of variation in these species attributes were examined for each of the eight times of sampling. Since our sampling design was not balanced due to the varying number of plots at each transect we used the restricted maximum likelihood method (REML), and also a two-way nested ANOVA with the Satterthwaite approximation (Sokal & Rohlf, Reference Sokal and Rohlf1995). Both methods used were a fully nested design with all factors random. In the design, plots were nested in transects. The REML method has been generally accepted as having good properties for unbalanced designs (Robinson, Reference Robinson1987; Searle, Reference Searle1995). The relative variance components were estimated for each source of variation in: (1) REMLs by using the Newton–Raphson iteration; and (2) ANOVAs by using the observed mean squares to estimate terms identified in the expected mean squares (Winer et al., Reference Winer, Brown and Michels1991; Searle et al., Reference Searle, Casella and McCulloch1992). For the REML method the significance of random factors was tested using an asymptotic significance test, whereas for the ANOVA method F-ratio testing was produced by the STATISTICA output (StatSoft, 2001). The validity of likelihood ratio tests however has been called into question because they rely on large sample approximations (Searle, Reference Searle1987; Singer, Reference Singer1998). Since we had relatively small samples the significance test tended to be too conservative, and thus the power of detecting a significant variance component was reduced. Therefore, we used REML to estimate the components and checked them with one of the ANOVA methods; both methods gave approximately the same results. Sometimes one or more estimates from the ANOVA method were negative; then, these estimates were set to zero, removed from the model and the estimates for the remaining factor re-calculated according to Fletcher & Underwood (Reference Fletcher and Underwood2002). Thereafter, we used the ANOVA approach for hypothesis testing.
We used untransformed data for all analyses to provide variance components comparable across all data (Fraschetti et al., Reference Fraschetti, Terlizzi and Benedetti-Cecchi2005). The assumption of homogeneity of variance was checked by Cochran's C test prior to analysis. When the variances were not homogeneous, we set the critical levels to a value equal to the P value for variance heterogeneity (Underwood, Reference Underwood1997). Non-significant effects from analyses can still be interpreted if homogeneity is not reached (Underwood, Reference Underwood1997; Benedetti-Cecchi, Reference Benedetti-Cecchi2001).
RELATIONSHIP BETWEEN ELEVATION AND SPECIES ATTRIBUTES
First, we used variance components, as explained for the biotic variables, to compare spatial variation across scales on the elevation within each location. Then, we used linear and non-linear regression to explore relationships between elevation and species richness or total abundance at the scale of transect and plot at the northern and western locations. The species attributes were pooled per replicate over the eight sampling times.
SPECIES-ABUNDANCE CLASSES
Species richness refers to the total number of species collected at a certain site irrespective of the species abundance. Therefore, the species richness as a variable does not capture patterns of variability in richness related to the classes of species abundance. If for instance competition between common versus rare species is an important structuring process in the community, the cover of both groups should be negatively (positively) correlated and in consequence both species should vary at the same spatial scales. If there is such ‘coupling’ the patterns of richness of rare species may be predicted from the one of common species. On the other hand, if the set of factors affecting common and rare species are operating at different scales, the spatial variability in species richness of each group should be maximal at different scales (e.g. at a given scale, the richness of common species does not vary but that of rare species show a considerable variation). If there is such a ‘de-coupling’ then further investigations will be necessary to understand how species within the same community are responding independently to different factors. For monitoring purposes a de-coupling means that it is necessary to develop particular sampling designs, targeting different scales of variation, for each species group. We explored these potential patterns of variation using species-abundance classes (SACs), where species are assigned to classes according to their abundance.
The standard method of analysis of SACs is to adjust a function (e.g. linear and log-normal), to define species-abundance distribution and to compare changes in the form of the function in space and time. This method is well established in many pollution-related studies (e.g. Gray, Reference Gray1981; Gray & Pearson, Reference Gray and Pearson1982). For instance, Gray & Mirza (Reference Gray and Mirza1979) showed that an undisturbed community fitted well to the log-normal distribution, while in polluted areas two lines of different slopes gave the best fit. Such a method of analysing the log-normal distribution of individuals among species has also been found useful to isolate those species which are most sensitive to pollution-induced changes (Andrews & Richard, Reference Andrews and Richard1980; Gulliksen et al., Reference Gulliksen, Haug and Sandnes1980). In such pollution-related studies, for each sample of the large number of replicated samples per time, each species was assigned to geometric abundance classes with a certain scale, e.g. x 2 scale (0–1, 2–3, 4–7, …, 64–127, 128–255, …). Here, differences among replicated samples reflect: (1) differences in e.g. cover per species—in two different samples a given species may be assigned to a different class according to its abundance; or (2) loss or appearance of species from one sample to another.
In the present study, we followed an alternative approach in order to evaluate if rare, regular and/or common species are responsible for the variation in total species richness among transects and plots at both locations. Here, the identification of the potential presence of relevant abundance classes, responsible for the patterns of variation, can be used in future reduced-scale monitoring programmes. We pooled all replicated quadrats over all seasons and calculated the mean cover for each species. Thereafter, we assigned each species to one of three geometric abundance classes (e.g. 0.01–0.08, 0.09–1.28 and 1.29–81.92%) on the basis of their mean cover. The species were classified as rare (mean cover <0.08%), regular (mean cover <1.28%) and common (mean cover >1.29%). Finally, we recorded, for each replicated quadrat, the number of species assigned to each class. Here, each species belonged to a fixed geometric-abundance class, irrespective of the replicated quadrat considered. Therefore, changes in the number of species per class were related exclusively to species losses and appearances. For instance, this approach is used in community phylogenetics (Swenson et al., Reference Swenson, Enquist, Jason, Thompson and Zimmermann2006).
On the matrix of replicated quadrats × species-abundance classes, we estimated variance components as in the case of species richness and total abundance. We used linear and non-linear regression, Pearson correlation and ANOVA F-ratio testing to explore relationships between elevation and SACs at the scale of transect and plot at both locations. We applied the assignment to SACs and the following analyses to the cover of algae since they dominated both intertidal locations and were more diverse than the sessile fauna.
RESULTS
Species richness and total abundance
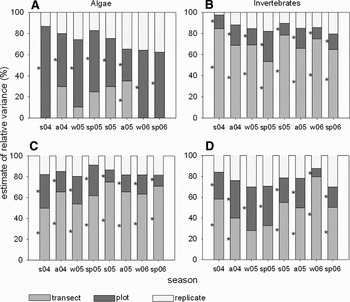
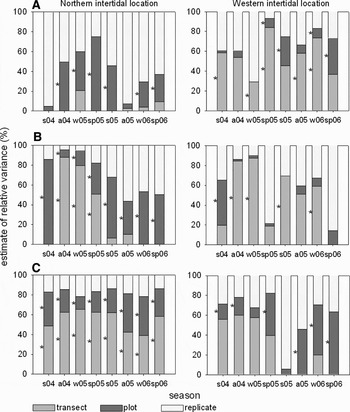
At the northern location, total richness was 112 species, consisting of 52 algae and 60 invertebrates. For algae, most variability in species richness occurred among plots as indicated by the large estimates of relative variance (Figure 2A). At the scale of plot, the variability was significant for all sampling dates; at the scale of transect variability was only significant for autumn 2005. Most variability in species richness of invertebrates as well as in total cover of algae and invertebrates occurred among transects as indicated by the large estimates of relative variance (Figure 2B–D). At the scale of transect and plot the variability was significant for all sampling dates, except for variation in invertebrate cover at the scale of transect in winter and spring 2005.
Estimates of variance components and ANOVA testing for spatial variability in total (A) species richness of algae, (B) species richness of invertebrates, (C) abundance of algae and (D) abundance of invertebrates in the northern intertidal location at the scale of transect, plot and replicate over the sampling seasons (*P < 0.05). Abbreviations of x-axis indicate season and year, e.g. s04: summer 2004.

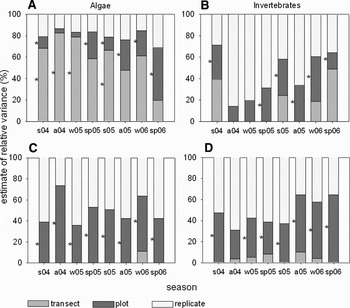
At the western location, total richness was 104 species, consisting of 50 algae and 54 invertebrates. Most of the variability in species richness of macroalgae occurred at the scale of transect (significant in 50% of the sampling dates; Figure 3A). At the scale of plot, variability was high only in spring 2006; variability differed significantly in all sampling dates, except for autumn 2004 and winter 2005. For invertebrate richness as well as algal and invertebrate cover, the estimates of residual variance were at least in half of the sampling dates larger than the variance components among transects and plots; this indicated that the variation among replicates was important (Figure 3B–D). At the scale of plot the variability was significant for most sampling dates, except for autumn 2004 and winter 2005 regarding invertebrate richness and autumn 2004 regarding invertebrate cover.
Estimates of variance components and ANOVA testing for spatial variability in total (A) species richness of algae, (B) species richness of invertebrates, (C) abundance of algae and (D) abundance of invertebrates in the western intertidal location at scales of transect, plot and replicate over the sampling seasons (*P < 0.05). Abbreviations of x-axis indicate season and year, e.g. s04: summer 2004.

Relationship between elevation and species attributes
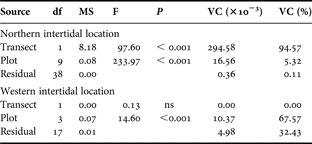
At the northern intertidal location, most variability in elevation occurred among transects, as indicated by the large estimates of relative variance (Table 1). At the scale of transect and plot the variability was significant. For the western intertidal location, the largest variability in elevation appeared among plots; at this scale the variability was significant (Table 1).
Estimates of variance components from REML and ANOVA methods, and ANOVA testing for spatial variability in elevation carried out separately in each study location at the scale of transect and plot. The REML and ANOVA methods gave approximately the same estimations.

VC, variance component; ns, not significant.
Linear and non-linear regression were used to examine the relationship between logarithmically transformed elevation and species richness or total abundance at the scale of transect, plot and replicated quadrat.
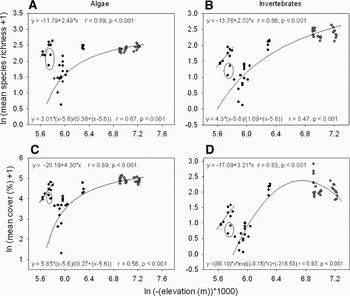
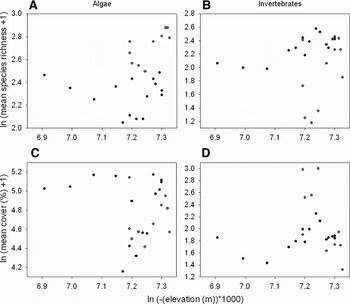
At the northern location (Figure 4), species richness and cover of algae as well as species richness of invertebrates (all logarithmically transformed) responded asymptotically to elevation (all P < 0.001); these species attributes increased from high (5.8 m) to low (7.3 m) elevation (Figure 4A–C). The cover of invertebrates was adjusted to a Ricker function; cover increased from high (5.8 m) to low (6.9 m) elevation and then tended to decrease slightly (Figure 4D). When one replicate, characterized by an extremely high percentage cover of sediment was excluded from non-linear regression, species richness and cover of algae as well as invertebrate richness gave better fits (r < 0.7 versus r > 0.8). The exception of the asymptotic and the Ricker function were the replicated quadrats, belonging to two plots, and responding linearly to the elevation (Figure 4); these plots, located between an elevation of 5.6 and 5.8 m, showed a higher mean in: (a) algal richness (>2.2); (b) invertebrate richness (>1.4), (c) algal cover (>4.0%); and (d) invertebrate cover (>1.0%) than several plots that were situated at an elevation >5.8 m. All linear regression models were significant (P < 0.001). At the western location there was not any significant relationship (Figure 5).
Linear and non-linear regression models, Pearson correlation and ANOVA testing for relationship between elevation and (A) species richness of algae, (B) species richness of invertebrates, (C) cover of algae and (D) cover of invertebrates at the scale of transect, plot and replicate in the northern location. Different colours represent different transects. Elevation refers to the height normal null of the German height reference system. The circled replicates were excluded from the regression models.

Scatterplot for relationship between elevation and (A) species richness of algae, (B) species richness of invertebrates, (C) cover of algae and (D) cover of invertebrates at the scale of transect, plot and replicate in the western location. Different colours represent different transects. Elevation refers to the height normal null of the German height reference system.

Analysis of species-abundance classes
At the northern location, we obtained three abundance classes. Variance components on class I, containing the rare species, showed most variation among replicates; the variation was significant for all sampling dates among plots, except of summer 2004 and autumn 2005 (Figure 6A). For class II, containing the regular species, estimates of variance components showed most variation at the scale of plot; among plots the variation was significant for all sampling dates, while among transects significant variation only occurred from autumn 2004 to spring 2005 (Figure 6B). Most variation in abundance class III, containing the common species, occurred among transects. At this scale the variability was significant for all sampling dates; also, at the scale of plot, the variability was significant for all sampling dates.
Estimates of variance components and ANOVA testing for spatial variability in geometric abundance class (A) I, (B) II and (C) III of macroalgae at the scale of transect, plot and replicate in the northern and western location over the sampling seasons (*P < 0.05). Abbreviations of x-axis indicate season and year, e.g. s04: summer 2004.

At the western location, variance components on abundance classes I and II showed high variance at the scale of transect, whereas variance components on class III showed most variation at the scale of transect as well as plot (Figure 6A–C). The variability of class I was significant for four (sp05, s05, w06 and sp06) and five (s04, w05, sp05, a05 and w06) sampling dates at the scale of plot and transect, respectively (Figure 6A). For class II, variability was significant for some sampling dates among transects (a04, w05, s05 and w06) and for only one sampling date among plots (s04). Significant variation in abundance class III was among plots for all sampling dates, except for winter and summer 2005; variation among transects was never significant.
At the northern location variation in richness of rare species (class I) predominated at the smallest scale (replicate), while variations in common species (class III) varied at the largest scale (transect). In contrast, in the western location variation in rare and regular species (class II) predominated among transects, whereas significant variations in common species was among plots.
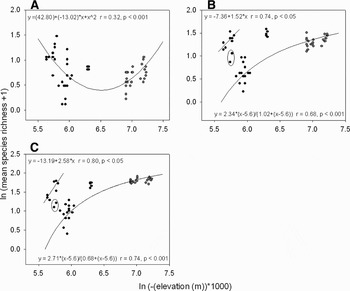
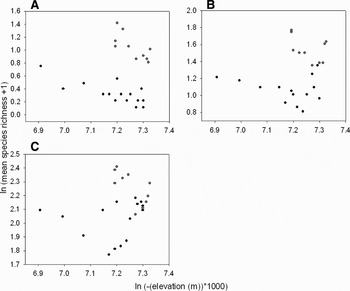
At the northern location, the richness of rare algae (class I) showed a parabola with a minimum at intermediate elevation (from 6.1 m to 6.9 m; Figure 7A). For classes II and III species richness responded asymptotically to elevation; species richness increased from high (5.8 m) to low (7.3 m) elevation (Figure 7B, C). All non-linear regression models were significant (all P < 0.001). When one replicate, characterized by an extremely high percentage cover of sediment was excluded from non-linear regression, species richness of algal abundance classes II and III gave better fits (r > 0.8).
Linear and non-linear regression models, Pearson correlation and ANOVA testing for relationships between elevation and richness of algal species of (A) class I, (B) class II and (C) class III at the scale of transect, plot and replicate in the northern location. Different colours represent different transects. Elevation refers to the height normal null of the German height reference system. The circled replicates were excluded from the regression models.

The exception of the asymptote was confirmed by replicates from two plots that responded linearly; these were located between an elevation of 5.6 and 5.8 m and showed a higher mean algal richness (>1.1) than several plots that were lower situated (>5.8 m). All linear regression models were significant (all P < 0.05).
In the western location, there was not any significant relationship between richness and elevation (Figure 8).
Scatterplot showing the relationship between elevation and richness of algal species of (A) class I, (B) class II and (C) class III at the scale of transect, plot and replicate in the western location. Different colours represent different transects. Elevation refers to the height normal null of the German height reference system.

DISCUSSION
For the intertidal locations at Helgoland we have shown that variation in total species richness and abundance was mainly attributable to the factor transect at the northern location and to the factor replicate at the western location. At the northern location, the parameters of species assemblages responded asymptotically to elevation, while neither a linear nor a non-linear relationship between elevation and species richness or total abundance occurred at the western location. For macroalgae, our analysis of species-abundance classes showed that the scale-dependent patterns of variability depended on whether species were rare or common.
Our data about the intertidal community at Helgoland show that spatial patterns of species richness and total abundance were scale-dependent, but that there were a series of differences between locations. The locations varied in: (1) the scale at which variations were highest (northern location: transect; western location: replicate); (2) the temporal persistence of the scale-dependent patterns (persistent only at the northern location); (3) the response to the elevation (significant only at the northern location); and (4) the degree of coupling in the scale-dependent variation in the species richness of the different abundance classes. Differences between locations, e.g. the larger variation among transects at the northern location, may be attributed to the sampling design. However, the other differences must be related with the differences in habitat structure, exposure or the presence of particular habitats occupied by characteristic species. The high variations in species richness of rare, regular and common species at the scale of transect characterizing the western location suggest that transects captured important variability in spite of covering a narrow range of elevation. The small variation in richness and abundance at low elevations of the northern location (ln elevation range: 6.8–7.3) is in contrast to the high variability at the same range of elevation of the western location. In what follows we focus on patterns and processes occurring at each location separately and discuss our results in the context of a monitoring programme.
Northern location
At the northern location, variability in species richness and total abundance among transects (separated by 65 m) was a direct result of differences between the vertical heights, the high- and low-shore; this pattern was consistent through time. The elevation (refers to height NN) also showed most variation among transects. The species assemblage at high-shore was characterized by relatively low algal and invertebrate cover as well as invertebrate richness in contrast to high values of these variables at low-shore. Several species cope with long times of emersion, whereas most others do not have abilities to avoid or endure harsher physical factors high on the shore (see reviews: Newell, Reference Newell1979; Norton, Reference Norton, Moore and Seed1985). The differences in the species attributes may be a result of a number of physical factors which may have changed with the vertical height on the shore such as desiccation, extremes of temperature and salinity or lack of nutrients and food. The richness and cover of algae and invertebrates responded asymptotically to elevation; this saturation may be a consequence of competitive processes. Competition was reported by many other studies on rocky shores as a prominent process maintaining differences in the structure of species assemblages among vertical tidal heights (e.g. Dayton, Reference Dayton1971; Hawkins & Hartnoll, Reference Hawkins and Hartnoll1985; Kelaher et al., Reference Kelaher, Underwood and Chapman2003).
Algal richness was an exception: richness showed the largest variance components among plots (separated by 4–40 m) and not among transects as in the case of the above mentioned variables. The algal assemblages at high-shore were characterized by relatively high richness just as those at low-shore. This pattern suggests that other factors not associated with vertical elevation on the shore are also important in affecting spatial patterns of macroalgal distribution. The algal assemblages at high-shore were characterized by relatively high richness just as those at low-shore. It is not clear why this is the case; potential factors explaining this unusual high richness may be differential substrate heterogeneity (Underwood & Chapman, Reference Underwood and Chapman1989; Chapman & Underwood, Reference Chapman and Underwood1994), hydrodynamic conditions (Leonard et al., Reference Leonard, Levine, Schmidt and Bertness1998), intra- and interspecific interactions (Connell, Reference Connell1961; Hawkins & Hartnoll, Reference Hawkins and Hartnoll1983) and the interplay between physical and biological processes (Benedetti-Cecchi et al., Reference Benedetti-Cecchi, Bulleri and Cinelli2000a). Dependent on the geomorphology of rocky shores a variety of microhabitats with different elevation (e.g. pools and promontories) results in diverse small-scale variation in physical conditions (e.g. micro-hydrodynamic or -climate changes). In particular, the presence of promontories at the northern location of Helgoland, may contribute to the formation of particular microhabitats not found in the lower intertidal. These highly elevated patches were characterized by a multilayered algal structure: an encrusting layer, a middle layer and a top layer consisting of large brown algae (Reichert et al., in preparation). For example, exposed patches on the promontories offered an unsuitable habitat for dense stands of filamentous algae of the genus Ulva, whereas they supported the settlement of large brown algae such as Fucus vesiculosus and Fucus spiralis. In contrast, Ulva species were more abundant on the base of the promontories. A pre-emption of patches on the promontories by brown algae might have ameliorated the conditions for the establishment of other species. Thus, micro-hydrodynamic changes in the upper intertidal may have defined particular microhabitat types (Guichard & Bourget, Reference Guichard and Bourget1998).
We found a de-coupling between the richness of regular species and rare or common species. Richness of regular species mostly varied at the scale of plot as in the case of total species richness, whereas rare and common species varied mostly at the scale of replicate and transect respectively. Since brown algae (e.g. Fucus vesiculosus and Fucus spiralis) were classified as regular species, the observed pattern of richness should be a consequence of pre-emption of high elevated rocky promontories.
Western location
At the western study location, most variability in species richness and total abundance was among replicates (separated by 10s of centimetres), and thus agreed with several investigations which revealed a considerable degree of variation in benthic assemblages at the smallest spatial scale, that is between individual replicates (Archambault & Bourget, Reference Archambault and Bourget1996; Underwood & Chapman, Reference Underwood and Chapman1996; Menconi et al., Reference Menconi, Benedetti-Cecchi and Cinelli1999; Fraschetti et al., Reference Fraschetti, Terlizzi and Benedetti-Cecchi2005). The variation among replicates may be explained by a haphazard scattering of suitable microhabitats across the low-shore of the western study location. However, most differences in elevation (refers to height NN) such as one topographic feature were among plots and not among replicates, and the relationship between elevation and species richness or total abundance was not significant. Other geomorphological structures (e.g. crevices, holes and cracks) within each plot may govern patterns at scales smaller than a few metres (Underwood & Chapman, Reference Underwood and Chapman1996). Differences in abundance of dominant periwinkles (e.g. Littorina littorea and Littorina mariae/obtusata) among replicated quadrats may be affected by their behaviour dispersing among patches of microhabitats during a period of activity. Foraging movements of these grazing periwinkles may subsequently influence the patterns of distribution of the preferred sessile algae, such as Fucus species. Manipulative experiments to test such a hypothesis may be important and should be planned in future.
Algal richness was also an exception as in the case of the northern study location. Species richness of algae showed the largest variance components among transects (separated by ~45 m). The differences in algal richness among transects may be a result of substrate heterogeneity in combination with interspecific interactions. Personal observations showed a considerable variability in the abundance of burrowing, tube-building polychaetes (e.g. Polydora ciliata and Fabricia sabella) found in patches of relatively soft red sandstone scattered at low intertidal. Patchiness in local abundance of polychaetes appears to be also related with the occurrence of seagulls feeding on them (K.R., personal observation). The faeces of the polychaetes and seagulls can cause a local increase of ammonium, which in turn serves as nutrient for algae, and may increase algal richness. The close relationship between the occurrence of green and red macroalgae and eutrophication has been documented elsewhere (e.g. Chryssovergis & Panayotidis, Reference Chryssovergis and Panayotidis1995) and should be studied in detail at Helgoland.
The results of species-abundance distribution of macroalgae supported our assumption that inter-specific interactions between animals and green and red macroalgae may be responsible for spatial variation among transects. We found that rare species, such as Rhizoclonium tortuosum, Spongomorpha aeruginosa or Porphyra spp., mostly showed significant variation at the scale of transect as for total species richness of algae. Thus, it appears that the distribution of rare occurring algae at the western location were mainly responsible for the general pattern of total richness, which may be caused by an interplay of physical and biological processes.
The richness of species-abundance classes of macroalgae did not show a de-coupling as in the northern location: richness of rare, regular and common species varied mostly at the scale of transect. The consistent variation in the variability among classes at the scale of transect (i.e. higher richness along the transect at the lower intertidal level) may be the consequence of favourable physical conditions, animal–macroalgal interactions or facilitation effects among macroalgae.
Perspectives for monitoring
Our data show that monitoring may not be a simple task in marine benthic communities. Monitoring may take into account that: (1) community structure varies at several scales; (2) scale-dependent variations depend on the location; (3) scale-dependent variation may be inconsistent through time; and (4) de-coupling may occur among species richness per abundance class.
Monitoring of the community may try to control variation at particular spatial scales. The identification of a characteristic scale of variation at each location helps to design a monitoring programme targeting the appropriate scale at each location separately. However, temporal inconsistencies of the scale-dependent variation show that monitoring should involve a multiple-scale sampling design. In particular, the monitoring should focus on smaller spatial scales (centimetres to 10s of metres apart) since temporal changes in the variation of assemblages at these scales may be a diagnostic feature for stressed benthic communities (e.g. Chapman et al., Reference Chapman, Underwood and Skilleter1995; Terlizzi et al., Reference Terlizzi, Benedetti-Cecchi, Bevilacqua, Fraschetti, Guidetti and Anderson2005). In our case, inconsistencies through time appeared in the western location and warn against using a one-scale sampling approach. The de-coupling among species richness per abundance class also argue for a multiple-scale approach in order to capture the relevant variation. Alternatively, monitoring may concentrate on the species groups displaying least variation (Hartnoll & Hawkins, Reference Hartnoll and Hawkins1980). In our case, richness of the common species showed a consistent pattern of variation at the northern location and should be targeted in the monitoring programme.
In conclusion, although processes causing spatial patterns cannot be determined from observational studies, the identification of relevant scales of variation helps to formulate hypotheses and design manipulative experiments or monitoring programmes at the appropriate scale. At the northern location, processes structuring communities appear to be associated with intertidal elevation. These processes may be affecting rare, regular and common species in a different way. In contrast, at the western location, other processes (e.g. geomorphological structures, behavioural responses, interactive effects of abiotic and biotic factors) appear to structure the intertidal communities and affect rare, regular as well as common species in a similar way. Experiments are vital to explain particularly the processes causing the high small-scale variability of assemblages and their temporal changes at the western location. To date, for both locations at Helgoland the monitoring should consider variation at several spatial scales and should follow a multiple-scale sampling approach.
ACKNOWLEDGEMENTS
This work is part of the PhD thesis of Katharina Reichert conducted at the Biological Station Helgoland, Foundation Alfred Wegener Institute for Polar and Marine Research. We are grateful to Dr Mario de Kluijver for his ideas, discussion and help with handling ArcGIS. Anja Röw is thanked for assistance in the field. We also thank the anonymous referees for constructive comments on the manuscript.