


1. INTRODUCTION AND MOTIVATION
The field of health economics, and in particular the comparison of health technologies through cost-effectiveness analysis (CEA), is growing rapidly. In the analysis of data that have been collected in a clinical trial, many authors (Reference Briggs2;Reference O'Hagan and Stevens15) have proposed the use of Bayesian statistical methods, which provide a natural framework for quantifying uncertainty and decision making.
The most used tool for health technology assessment is the incremental cost-effectiveness ratio (ICER). It is defined as:

where γi and μi denote the mean of the cost and effectiveness of treatment i (i = 1,2), and Δγ and Δμ are the incremental cost and incremental effectiveness, respectively.
The ICER presents serious interpretation problems, instability, as well as difficulties for estimating confidence or credible intervals (Reference Heitjan, Moskowitz and William8;Reference Polsky, Glick, Willke and Schulman19). The net benefit is a close related tool which was proposed as an alternative to ICER (Reference Stinnett and Mullahy21). The incremental net benefit (INB) of treatment 2 compared with treatment 1 is defined as:

that depends on the deterministic threshold cost R c (ceiling ratio), which is defined as the “value the health provider assigns to increasing the effectiveness one unit” (Reference O'Hagan, Stevens and Montmartin17). From the Bayesian point of view, the interest might be on the probability that the INB(Rc) is positive for each value of Rc,

which is called the cost-effectiveness acceptability curve (Reference Fenwick, Claxton and Sculpher6;Reference Löthgren and Zethraeus10) (CEAC). We remark that this curve is based on the means of the effectiveness (μ) and cost (γ) of each treatment, as it is the ICER.
Seminal papers on Bayesian CEA assumed that both effectiveness and cost are normally distributed (Reference O'Hagan, Stevens and Montmartin17), and so it is for the frequentist approach. In this case, the mean is indeed a meaningful characteristic of the distribution. In fact, the natural candidates for the location, for example, mean, median, and mode, all coincide. However, asymmetric distributions do not have a natural location parameter. The median is often used instead of the mean, because it is less sensitive to extreme values. In the clinical literature, there are examples where the difference in median survival time in two arms of a clinical trial is used to make decisions (Reference Michiels, Piedbois and Burdett11). It is recognized, however, that many clinical trials have either effectiveness or costs (or both) that are not normally distributed. For instance, effectiveness is often a binary variable that takes the value 1 when success, and 0 when not success (Reference Al and Hout1;Reference Hoch, Rockx and Krahn9).
The use of the mean to make decisions has been supported in the health economic literature because of a social objective in cost-effectiveness analysis is to maximize the total (or average) health gain (Reference Gold, Siegel, Russell and Weinstein7). So according with the criterion of potential compensation of net benefit among individuals of Kaldor and Hicks—the individuals having a higher net benefit will compensate those with a lower net benefit—the decision maker should choose the treatment with the greatest expected net benefit (Reference O'Hagan and Forster14). However, some authors have recently argued that the mean is not the only quantity that matters to medical decision makers because compensation of health is not so acceptable as compensation of wealth. Variance (or other moments) may matter as well (Reference O'Brien and Sculpher12;Reference Zivin25).
We provide below some very simple examples where the conventional decision-making measures based on the mean achieve controversial conclusions.
Example 1 (Categorical Effectiveness)
For simplicity, we assume that the costs of treatment 1 and 2 are the same, and without loss of generality that they are zero. Hence, we focus on the analysis of a hypothetical effectiveness, which is measured by a discrete variable whose values are 0, 1, and 2, resulting from a health status indicator of bad, good, and excellent. To simplify the example, suppose that the evaluation of the effectiveness is carried out under perfect knowledge, so we know the population distribution for both treatments are:

Both treatments are certainly different, but an analysis based on the mean is not able to discriminate between them. In fact,

An analysis of the distribution of the difference between effectiveness (e 2−e 1), instead of the difference between means of effectiveness, provides important information to the decision maker to discriminate between treatments. Indeed, from:

it follows that the probability that both treatments are equally effective is:

the probability that treatment 2 is more effective that treatment 1 is:

and the probability that treatment 1 is more effective that treatment 2 is:

The implications for the decision maker of the last three sentences is that the proportion of times that treatment 2 will be more effective than treatment 1 is of 6 percent, and thus treatment 2 is the optimal decision.
Example 2 (Asymmetric Costs)
For simplicity, we assume that the effectiveness of both treatments are the same, thus the CEA is reduced to a costs analysis. Suppose that the population distributions of c2 and c1 are the following log-normal densities:

See Supplementary Figure 1, which can be viewed online at www.journals.cambridge.org/thc.
Both densities are quite different but the INB does not provide this information, it is a constant equal to 0, that is:

However, the density of the variable c 2−c 1 provides important supplementary information. For instance, from this density we find that the probability that treatment 1 is preferred to treatment 2 is 0.79.
Example 3 (Uncertainty)
Assuming for simplicity that the costs of both treatments are zero, we consider the case where the population effectiveness can be modeled through the following normal densities:

Both distributions are very similar and the distribution of the difference of effectiveness is (e 2−e 1)~N(1, 40). The probability of preference for treatment 2 is only of 0.56 but the probability that the mean of treatment 2 is bigger than that of treatment 1 is 1. That is, an analysis based on the mean chooses treatment 2 with no uncertainty, but an analysis based on the whole distribution indicates that treatment 2 is to be chosen with a large uncertainty.
Table 1 contemplates three normal scenarios with different population means and a variance of 20, and gives the CEAC curves based on the means and those based on the whole distribution.
Three CEAC Curves Based on the Mean and on the Whole Distribution
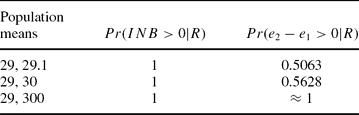
The CEAC curve based on the mean gives the same report for the three different scenarios, it is constantly equal to 1. The alternative CEAC curves, based on the distribution of effectiveness and cost, report that, in the first scenario, the advantage of the second treatment over the first one is very small, it is bigger in the second scenario, and it is overwhelming in the third scenario.
Recently, Vanness and Mullahy (Reference Vanness and Mullahy22) pointed out that “because clinicians and administrators make choices that impact nonexchangeable, nonanonymous individuals, they may care about features of the distributions of costs and health outcomes beyond the mean”.
In this study, we propose an alternative framework for CEA, where the quantity of interest is not a point estimator of the means outcome of effectiveness and costs, but the full posterior distribution of the net benefit. In the Bayesian literature, this posterior distribution is known as the posterior predictive distribution of the net benefit (Reference O'Hagan and Forster14).
More precisely, the conventional analysis solves an optimization problem where the objective is to maximize the total (or average) wealth gain, which is accomplished by choosing the treatment with higher expected net benefit. We note that the net benefit is expressed in monetary units, and that for small values of R c the main component of the net benefit is the treatment cost. Therefore, this conventional approach would be reasonable when the decision maker assumes small values for R c, and hence the wealth gain is the goal.
In the new approach, one is interested in choosing the treatment having, in probability, the higher net benefit. This decision rule solves an optimization problem where the objective function is to maximize the proportion of patients in the population having a net benefit gain (Reference Willan24). We note that for large values of R c the main component of the net benefit is the treatment effectiveness, so for such values the health gain is the goal.
Both objectives are of interest for the decision maker and, in general, will provide complementary information. In formulas, for a given value R c, the conventional Bayesian analysis chooses treatment 2 if:

and the new one choose treatment 2 if:

where, Δe = e 2−e 1, Δc = c 2−c 1, and both the expectation and the probability are computed with respect to the posterior predictive distribution of the cost and effectiveness.
The rest of the study is organized as follows. In Section 2, we present the new framework based on the predictive distribution of effectiveness and cost. In Section 3, we analyze a common case in the CEA: normal distribution for effectiveness and log-normal distribution for costs. In Section 4, a detailed illustration is presented as a case study using real data. Section 5 presents some conclusions.
2. GENERAL FRAMEWORK
Suppose we have independent patient-level data {(e ij, c ij):i=1, 2; j = 1, 2, . . ., n i} from a clinical trial, where e ij refers to the observation on effectiveness for subject j receiving treatment i, and c ij refers to cost. Consider the sampling model of treatment i f(ei, c i|θi), i=1, 2 where θi represents the unknown unobservable parameters. The likelihood of (θ1, θ2) for the above data is given by:

We have assumed that the treatments are independent, an assumption that seems to us realistic, although a conspicuous referee has pointed out that exchangeability would be a more appropriate assumption for some applications.
To complete the specification of the Bayesian model, we need a prior distribution π(θi), i=1, 2 reflecting our prior belief on the behavior of the parameter θi. Then, assuming prior independence of θ1 and θ2, the joint posterior density of (θ1, θ2) is given by Bayes’ theorem as:

From Equation [4], it follows that the above equation can be written as:

that is, θ1 and θ2 are also independent a posteriori.
Conventional CEA requires to compare expected efficacies and expected costs for each treatment. Let the distribution f(e, c|θ) have mean (μ(θ), γ(θ)), so that the mean efficacy for treatment i is μi(θi) and the mean cost for treatment i is γi(θi), and both can be obtained as functions of θi.
The alternative analysis is based on the posterior predictive distribution of effectiveness and cost, conditional on the data,

which is decomposed as:

From this density, we can compute some measures of cost-effectiveness. For instance, the density of the cost-effectiveness ratio for treatment i, CER i=c i/e i, as:

In a similar way, the posterior distribution of the net benefit for treatment i, NB i=R c⋅e i−c i, is computed as:

Assuming a common value of R c for both treatment 1 and 2, the posterior joint distribution of net benefit of the treatments turns out to be:

From Equation [10], we can also obtain the probability that treatment 2 is preferable to treatment 1, conditional on a value R c and the available data. That is:

where I A denotes the indicator function of event A. The graphical representation of this probability for different values of R c is an alternative to the conventional CEAC curve.
3. NORMAL DISTRIBUTION FOR EFFECTIVENESS AND LOG-NORMAL DISTRIBUTION FOR COSTS
In this section, we assume an asymmetric lognormal model for the cost. The joint distribution of effectiveness and cost is defined as

The symbol N 2 denotes the bivariate normal distribution with parameters θi = (μi, γi, Σi) where μi denotes the mean of the effectiveness of treatment i, γi the mean of the log of the cost, and Σi the covariance matrix.
We propose a flexible prior structure, with normal distributions for location parameters (μi, γi) and inverse-Wishart distributions for variance-covariance matrices, factorized as:

This prior distribution enables us to incorporate prior information through the values of the hyperparameters μ0i, γ0i, V i, A i, v i. In this way, the elicitation process might play an important role in modeling the empirical or historical evidence using the prior distribution (Reference O'Hagan, Upadhyay, Singh and Dey13). Section 4 presents an illustration of how to incorporate prior information into the analysis.
The joint posterior distribution of the parameters (μ1, γ1, μ2, γ2), given data, follows from Equation [5] using Bayes’ theorem, as:

where:

trA denotes the trace of matrix A,  ,
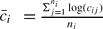 , and

Sampling from this posterior distribution requires Markov Chain Monte Carlo (MCMC) algorithms. In fact, the form of Equation [12] is particularly well suited for an application of Gibbs sampling. We have used the standard package WinBUGS (Reference Spiegelhalter, Thomas, Best and Lunn20).
4. EXAMPLE
The Trial
We present an example of a clinical trial in which a comparison was made between four highly active antiretroviral treatment protocols applied to asymptomatic HIV patients, developed in 1999 (Reference Pinto, López, Badìa and Coma18). Each treatment protocols combined three drugs. We obtained data on the direct costs (of drugs, medical visits, and diagnostic tests), and on the effectiveness, quality-adjusted life-years (QALYs), using EQ-5D instrument. EQ-5D is an instrument for the self-evaluation of personal health, consisting of five questions that investigate five aspects of health-related life quality, based on a visual analogue scale. We have calculated the QALYs as the area under the curve defined by the utility values at each time point during the study period. All patients used a monthly diary during 6 months to keep record of resource consumption and quality of life progress.
Most CEA compare two alternative technologies only, namely the control treatment and the new treatment. Although this example includes four treatments, we take the treatments d4T+3TC+IND (that combines the drugs estavudine (d4T), lamivuidne (3TC) and indinavir (IND)) and d4T+ddl+IND (that combines estavudine (d4T), didanosine (ddl), and indinavir (IND)) to illustrate how a CEA for two treatments would be carried out. Hereafter, we refer to these treatments as T1 and T2, respectively.
The sample data seem to indicate that T2 is slightly the most effective treatment, with a sample mean QALY of 0.4024 versus a sample mean of 0.3958 for T1. However, the sample also suggests that T2 is the most expensive treatment (7,302.70 euros versus 7,142.28 euros). The large standard deviations (1,702.85 and 1,568.12, for T2 and T1 respectively) indicate a high degree of overlapping of the samples. See Supplementary Table 1, which can be viewed online at www.journals.cambridge.org/thc.
Weak Prior Information
In this subsection, we assume weak prior information about the value of the parameters of the model. We follow the prior structure described in Section 3, where the hyperparameters are chosen to be:

It should be pointed out that WinBUGS does not allow the completely noninformative prior distributions for Σ1 and Σ2. Thus, we set:

which will be essentially similar to those produced under the totally weak prior specification (Reference O'Hagan, Stevens and Montmartin17).
After following a burn-in of 100,000 iterations, the posterior distributions were monitored over a further 100,000 iterations of the chain. Convergence was checked by rerunning the MCMC process from four different initial starting values and using the diagnosis tools provided by the CODA package. The complete code for the examples is available from the authors upon request.
The posterior mean, median, standard deviation, and 95 percent probability interval of the mean effectiveness (μ) and mean cost (γ) under the two treatments are given in Table 2 (also see Supplementary Figure 2, which can be viewed online at www.journals.cambridge.org/thc).
Posterior Mean and Posterior Distribution of Effectiveness and Cost

Note. Column headings are mean, standard deviation, MCMC error, median, and 95% Bayesian interval. Weak prior information.
From this table, it follows that while the probability of a positive increment in mean effectiveness of T2 to T1 is 68.9 percent, we find that from the new approach the posterior probability that T2 is more effective than T1 is only of 52.2 percent. Furthermore, the probability of a positive increment in mean cost of T2 to T1 is as large as 88.4 percent, but we find that the posterior probability that T2 is more costly than T1 is only of 53.9 percent.
Note that the above comparison between cost and effectiveness can be carried out for the net benefit of the treatments conditional on each value of R c.
Figure 1 shows CEACs for both the analysis based on the mean and for the analysis of the posterior predictive distribution. Both decision rules differ when the values of R c are in the interval (20500, 25100).
Black color, conventional cost-effectiveness acceptability curve based on the mean. Gray color, the new cost-effectiveness acceptability curve based on the posterior distribution of effectiveness and cost. Weak prior information (top) and informative prior (bottom).

Informative Prior
For illustrative purposes, we take the prior information stated in the design of the original trial (Reference Pinto, López, Badìa and Coma18) for construct an informative prior. Recognizing the limitations of this example—for instance the effect differences for which a design is planned may be optimistic—in this retrospective analysis, we have no more reliable prior information. Of course, in a real application of the Bayesian approach it would be necessary to assess carefully the prior knowledge and to carry out a study of the sensitivity of the posterior distribution of effectiveness and cost to the incorporation of genuine prior information.
The prior expectation of the effectiveness for both treatments was 0.40 QALYs. There is typically less prior information about costs in studies of this type. Considering the results of previous studies of antiretroviral therapies with symptomatic patients (Reference Carpenter, Fischl and Hammer4), T2 (d4T+dll+IND) was expected to be more expensive than T1 (d4T+ddl+IND). The mean cost was expected to be 7500 euros and 7100 euros for T2 and T1, respectively.
For the standard deviations of the prior, we assign the value 0.1, suggesting 95 percent prior intervals of approximately ±0.2 around the prior mean. We take large standard deviations for costs, 2000 euros, to model a large prior uncertainty about the value of costs. The hyperparameters of the log-normal distributions can be calculated solving the system of equations with the expressions of mean and variance for the log-normal distribution. The parameters of the prior distributions turn out to be:

We use weak prior information about Σ1 and Σ2.
Table 3 shows the results of the analysis with “genuine” prior information. In this illustrative example, we have assumed a conservative prior distribution to reflect a relatively mild amount of prior information. This is the reason why the differences between noninformative and informative analysis are not relevant.
Posterior Mean and Posterior Distribution of Effectiveness and Cost

Note. Column headings are mean, standard deviation, MCMC error, median, and 95% Bayesian interval. Informative prior.
Figure 1 shows the CEACs for both models. The results are that T2 is to be chosen when R c≥20600 euros for the analysis based on the mean, while T2 is to be chosen when R c≥25300 euros for the analysis based on the whole posterior distribution. These results are very close to those obtained under weak prior information. See Supplementary Figure 3, which can be viewed online at www.journals.cambridge.org/thc.
5. CONCLUSIONS
This study proposes a new framework for CEA based on the posterior predictive distribution of effectiveness and cost that complements the conventional CEA. We argue that the mean of the effectiveness and cost can be poor summaries to carry out a complete CEA for treatments comparison, above all when the effectiveness is a categorical variable, and a certain degree of asymmetry in the cost is present. Clinical data often present these characteristics.
This study has adopted a Bayesian methodology and uses the predictive posterior distribution of the net benefit. The analysis based on the whole posterior distribution, captures the real uncertainty about the value of effectiveness and cost of the treatment. For example, from Table 3 it follows that the cost of the patients receiving T1 will be between 5,127.0 and 9,682.0 euros with a probability of 95 percent. This result is not attainable from the analysis based on the mean. Besides, the new approach does not necessarily coincide with that based on the mean. For instance, Supplementary Figure 3 shows that treatment T2 is preferable to T1 for R c≥25100 euros. This threshold supposes an increase of a 22.44 percent of the threshold of 20,500 euros obtained by the analysis based on the mean.
The main reason to support the use of the mean for treatments comparison is that, by doing so, we are maximizing the social health gain, and thus alternative interventions should be compared on their expected net benefit (Reference O'Hagan and Stevens16). However, there are other important criteria in economic evaluation as risk (Reference Elbasha5) and equity (Reference Brock and Khushf3;Reference Wailoo, Roberts, Brazier and McCabe23) that should be considered.
The new framework compares the net benefit of two treatments and chooses the one having, in probability, the highest net benefit. By doing so it maximizes the proportion of patients with health gains.
Throughout this study, we assumed the effectiveness followed a normal distribution, and the cost a log-normal one. Of course, other models might be of interest. Of special interest is the case where the effectiveness is a binary variable indicating success (value 1) and not success (value 0). In addition, to model the skewness of the cost with distributions such as gamma or log t-student, and to study the robustness of the results with respect to these models is an open question.
SUPPLEMENTARY MATERIAL
Supplementary Figure 1: www.journals.cambridge.org/thc
Supplementary Figure 2: www.journals.cambridge.org/thc
Supplementary Figure 3: www.journals.cambridge.org/thc
Supplementary Table 1: www.journals.cambridge.org/thc
CONTACT INFORMATION
Miguel Angel Negrín Hernández, PhD (mnegrin@dmc.ulpgc.es), Associate Professor, Department of Quantitative Methods, Faculty of Economics, University of Las Palmas de Gran Canaria, E–35017 Las Palmas de Gran Canaria. Canary Islands, Spain.
Francisco José Vázquez-Polo, PhD (fjvpolo@dmc.ulpgc.es), Professor, Department of Quantitative Methods, Faculty of Economics, University of Las Palmas de Gran Canaria, E–35017 Las Palmas de Gran Canaria. Canary Islands, Spain.
Francisco Javier Girón González-Torre, PhD (fj_giron@uma.es), Professor, Department of Statistics and Operations Research, University of Málaga, Campus de Teatinos, E-29071 Málaga, Spain
Elías Moreno Bas, PhD (emoreno@ugr.es), Professor, Department of Statistics and Operations Research, University of Granada, Campus de Fuentenueva, E-18071 Granada, Spain



