I. INTRODUCTION
The concept of (spot) noise factor (or noise figure in dB), conceived by Friis [Reference Friis1] in the 1940s, was until the 1960s the de facto figure of merit for evaluating the noise performance of two-port devices, circuits, and systems. It has however been observed that [Reference Haus and Adler2], since the noise figure is a man-made definition as opposed to the measure of a quantity that issues from clearly established laws of nature, the noise figure alone does not sufficiently define the noise performance of an amplifier, for example.
It has been established in the extensive work of Haus et al. [Reference Haus3] that, the noise figure is a function of the source impedance Z s of the device being measured and thus at certain optimum source impedance Z opt , a minimum noise figure NF min peculiar to the device can be measured. This, coupled with the fact that, the open circuit noise voltage fluctuation of a resistor is expressible in the Nyquist formula in terms of the equivalent noise resistance R n [Reference Nyquist4, Reference Johnson5], led to the establishment of the well-defined characterization of a noisy two-port circuit in terms of four noise parameters. These are the noise resistance, R n , the minimum noise figure NF min , and a complex parameter Г opt , the optimum reflection coefficient. In short, the noise parameters describe how the noise factor varies with the source impedance.
The noise parameters of two-port active devices are required in the design of low-noise amplifier. The most widely used technique in determining the noise parameters of a DUT, employs impedance tuners to present varying source impedances corresponding to several noise figures. The minimum noise figure and the optimum source impedance at which it occurs provide three of the four noise parameters, from which the fourth, the noise resistance is obtained [Reference Escotte, Plana and Graffeuil6]. The drawbacks of this method, which have been cited in the literatures include high cost, long measurement time, and especially the inconvenience of bulky and heavy tuners [Reference Escotte, Plana and Graffeuil6].
Since the introduction of the multi-impedance technique, continuous research aimed at improving the state-of-the-art has yielded various variations of this technique with corresponding improvement in accuracy and speed. The commercial noise parameters test kit developed by Maury Microwave Technology, which is based on Agilent (now Keysight) Technologies’ PNA-X series has reported significant improvement in speed and accuracy [7], which was made possible using advanced algorithms. The capabilities of this commercial test set has been demonstrated in the extraction of the noise parameters of a triple gate CMOS FinFET [Reference Wiatr8] and in one of the most recent case, [Reference Nguyen, Misljenovic and Hosein9] the extraction of the noise parameters of an Si MOSFET transistor over a wideband of frequencies. Another variation of the multi-impedance technique, employing microwave tuners, has been demonstrated in the characterization of the broadband noise performance of a recent Low Power 28-nm H-k/MG CMOS Bulk Technology [Reference Danneville10]. An alternative to measurement in the noise characterization of transistors involves the extraction of the noise parameters from models of the small signal equivalent circuit of the transistor, an example of which appears in [Reference Nalli11].
However, the fact that noise of a microwave network can be treated in terms of power waves [Reference Meys12–Reference Kanaglekar, McIntosh and Bryant14] allows noise problems to be formalized and solved in terms of normalized incident, reflected, and emerging waves, in what is known as the power wave formalism.
Also dubbed the noise wave approach, it has the added advantage of being compatible with the formulation of scattering parameters. Thus, the noise wave approach makes it possible for noise problems to be modeled, analyzed, and solved in the domain of scattering parameters and this is convenient for computer-aided design systems.
Works appearing in [Reference Meys12, Reference Wedge and Rutledge15–Reference Werling, Bourdel, Pasquet and Boudiaf21] and the most recent [Reference Đorđević22] are significant contributions as far as the noise wave technique for the extraction of noise parameters is concerned. In one of the early works in this regard, Meys [Reference Meys12] using an almost lossless source of varying phases and a matched load in a simple setup was able to determine the noise temperatures of three sets of wave parameters in addition to the phase of the cross-correlated power spectrum, that completely characterize the noise properties of a linear two-port. In yet another significant contribution, Wedge et al. [Reference Wedge and Rutledge15–Reference Rutledge and Wedge17] using two sets of noise sources, measured the self-correlated noise power densities of the DUT via thru and the cross-correlated noise power density via a 3 dB hybrid coupler, alternately connected to the noise source and DUT via a pair of circulators. This enabled the complete determination of the noise wave parameters in a very straight forward manner.
The authors [Reference Ahmed and Yeom23] have also presented a technique that employs an eight-port extension of the six-port network [Reference Engen24] and a noise figure analyzer (NFA) to determine the noise correlation matrix of a given coaxial connector-type DUT, which are then converted into the conventional noise parameters. In this paper, we demonstrate the successful implementation of the eight-port network technique for extracting the noise waves of an onwafer-type DUT, achieving good results in noise parameters measurements of two sample DUTs. The DUTs are an amplifier assembled with commercially available MMIC and a 10-dB attenuator.
The calibration of the eight-port network and the extraction of the DUT noise waves require the S-parameters of the eight-port network; which in the case of the onwafer measurement presented here, includes the S-parameters of the wafer probes. We also present how the S-parameters of the eight-port extension of the six-port network including wafer probes were determined. The simplicity of the technique and its low-cost means, the average microwave laboratory can easily design and implement its own noise parameters test set without recourse to measurement with very expensive commercial noise parameters test set, which is comparatively time-consuming and tedious.
II. MEASUREMENT SYSTEM DESCRIPTION
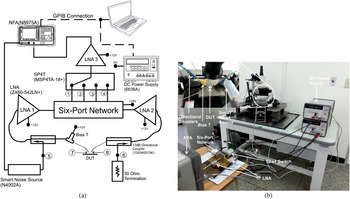
Figure 1 shows the onwafer noise parameters measurement setup. It consists of the six-port network, a pair of 13-dB directional couplers, 102 040 013 K from Krytar, which enables the extension from the six-port to an eight-port network, three (3) sets of ZX60-542LN LNAs from Mini-circuits™ for improving the gain of the measured noise powers, N8975A NFA, N4002A smart noise source, 6636A DC Power Supply, and the probe station. The personal computer (PC) is for instrument control and data acquisition by a general-purpose interface bus (GPIB). The output noise powers from ports 1 to 4 of the now constituted eight-port network are measured via a single-pole four-throw (SP4T) switch, an MSP4TA-18 from Mini-Circuits.
(a) Onwafer noise parameters measurement set up and (b) photograph of (a).

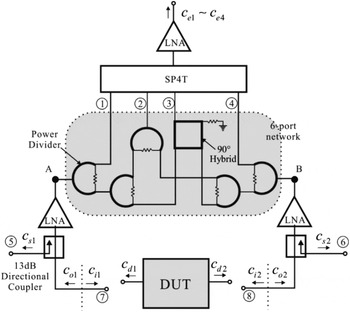
As can be seen from Fig. 1(a), noise waves from the DUT emerge from ports 7 and 8 (wafer probes) and then combine with the scattered version of the input noise waves from the smart noise source and 50 Ω termination coming from ports 5 and 6, respectively. The combined noise waves exiting the pair of couplers are then amplified and subsequently scattered by the six-port network, thus appearing at the output of the six-port network, i.e. ports 1–4. The structure of the six-port network is shown in Fig. 2. It can be seen that the self-correlated noise spectral power densities of the input noise waves entering the six-port network can be determined from the noise spectral densities appearing at ports 1 and 4. The cross-correlated components can be obtained from the output noise spectral densities of the 90° hybrid and the power divider at ports 2 and 3, respectively. Thus, with the appropriate calibration, the self- and cross-correlated noise power spectral densities due solely to the DUT can be determined from the four outputs of the six-port network, i.e. ports 1–4. Once the noise waves of the DUT are determined, expressions [Reference Hillbrand and Russer25] exist for converting same into the noise parameters.
Eight-port network and the various noise sources contributing to the output noise spectral density.

III. THEORY
A Determination of the eight-port noise parameters
Figure 2 shows the constituted eight-port network and the associated noise sources. The relationships among measured noise power spectra densities, b appearing at the output of the eight-port network (ports 1–4 via the SP4T switch), on the one hand and external and internal noise sources coming from switch terminations and the eight-port network, a and c respectively on the other hand, can be expressed as in (1).
 $${\bf b} = \left( {\matrix{ \matrix{{\bf b}_e \hfill \cr {\bf b}_s \hfill} \cr {{\bf b}_i} \cr}} \right) = \left( {\matrix{ {{\bf S}_{ee}} & {{\bf S}_{es}} & {{\bf S}_{ei}} \cr {{\bf S}_{se}} & {{\bf S}_{ss}} & {{\bf S}_{si}} \cr {{\bf S}_{ie}} & {{\bf S}_{is}} & {{\bf S}_{ii}} \cr}} \right)\left( {\matrix{ \matrix{{\bf a}_e \hfill \cr {\bf a}_s \hfill} \cr {{\bf a}_i} \cr}} \right) + \left( {\matrix{ \matrix{{\bf c}_e \hfill \cr {\bf c}_s \hfill} \cr {{\bf c}_i} \cr}} \right).$$
S ij in (1) represent the partitioned S-parameters of the eight-port network. The measured noise power spectra density, b is deduced from the measured noise figure and gain for the respective output ports. Subscripts e, i, and s represent the measuring, DUT noise input, and noise source ports, respectively.
The authors have shown in [Reference Ahmed and Yeom23], that the output noise spectral density b e , is related to all other noise waves in the setup, shown in Fig. 2, by
 $${\bf b}_e = {\bf S}_t{\bf a}_e + {\bf P}{\bf a}_s + {\bf Q}{\bf c}_i + {\bf \Lambda} {\bf c}_D + {\bf c}_e.$$
The embedded matrices can be expressed in terms of the partition matrices as
 $${\bf \Lambda} = {\bf S}_{ei}\left( {{\bf I} - {\bf S}_{ii}{\bf S}_D} \right)^{ - 1}, $$
 $${\bf S}_t = {\bf S}_{ee} + {\bf \Lambda} {\bf S}_D{\bf S}_{ie}, $$
 $${\bf Q} = {\bf \Lambda} {\bf S}_D, $$
 $${\bf P} = {\bf S}_{es} + {\bf \Lambda} {\bf S}_D{\bf S}_{is}. $$
S t a e represents the thermal noise contribution from terminations inside the SP4T switch to the output noise waves b e and Pa s represents the thermal noise contribution to the output noise waves b e from the smart noise source and 50 Ω termination at ports 5 and 6, respectively. c e represents the noise wave intrinsic to the eight-port network and which appears directly at the measuring ports, while c i on the other hand is part of the intrinsic noise of the eight-port network appearing at ports 7 and 8. The term Qc i represents the c i that is reflected back into the six-port network and which appears at its outputs. Qc i is thus due to mismatch between ports 7 and 8 of the eight-port network on the one hand and the input terminals of the DUT on the other hand, respectively. The term Λc D in equation (2) represents the desired noise wave contribution to the output noise wave exclusively by the DUT, which is the term that needs to be known in order to determine the noise wave parameters of a given DUT. Once the undesired noise contributions to b e , i.e. c e , c i , and a e are determined, the noise wave correlation matrix of the DUT, c D can then be obtained from Λc D .
B Determination of c e , c i , and correlations c ie
From equation (2), c e can be determined by measuring noise wave b e across a 50 Ω load when a e = a s = a i = 0. Thus, ports 7 and 8 are terminated in 50 Ω loads and the noise source is applied to port 5 with port 6 terminated in 50 Ω load. Note that the 50 Ω loads also generate thermal noise. As previously stated, the output noise wave b e is obtained from ports 1 to 4. The noise source is alternately applied to port 6 and the noise power measurement can be taken at ports 1–4.
Since the noise contributions due to the 50 Ω terminations as well as the smart noise source are thermal, the normalized noise contributions can be determined from their respective gains, G ij . Thus, the normalized noise power of the eight-port network emerging from ports 1 to 4 is given by
 $${\bf C}_{ee} = \left( {\matrix{ {n_{1,av} - ( {G_{15} + G_{16} + G_{17} + G_{18}} )} \cr {n_{2,av} - ( {G_{25} + G_{26} + G_{27} + G_{28}} )} \cr {n_{3,av} - ( {G_{35} + G_{36} + G_{37} + G_{38}} )} \cr {n_{4,av} - ( {G_{45} + G_{46} + G_{47} + G_{48}} )} \cr}} \right).$$
n i,av is the average noise powers measured at the output ports with the termination conditions described above in place. The gains G ij are determined from the S-parameters of the eight-port network.
C Determination of ci and correlations with c e
The term c i and its correlation can be determined using three different terminations, standard open termination, O, standard short termination S, and offset-open D, which is the case when the port in question (port 7 or 8) is left open without any termination.
In Fig. 2, c o1 and c o2 are defined as the noise waves of the LNAs (referred to their respective inputs) incident on the eight-port network at the DUT input plane. Then, c e can be expressed as a linear combination of c o1 and c o2 as
 $${\bf c}_e = c_{o1}{\bf r}_1 + c_{o2}{\bf r}_2 + {\bf N}_S.$$
Noise waves c o1 and c o2 are mainly due to the output noises of the LNAs in the DUT ports, which are transformed to the DUT input plane. The column vectors r 1 and r 2 are the column partition of S ei . The remaining noise contributions to c e , are represented by column vector N s .
Consider the cases that one of the DUT ports, say port 7 is terminated in short, open, and offset open while the other port 8 is terminated in 50 Ω. The respective DUT S-parameters for these terminations are
 $${\bf S} = \left( {\matrix{ { - 1} & 0 \cr 0 & 0 \cr}} \right),\quad {\bf O} = \left( {\matrix{ 1 & 0 \cr 0 & 0 \cr}} \right),\quad \quad {\bf D} = \left( {\matrix{ {e^{j\theta}} & 0 \cr 0 & 0 \cr}} \right).$$
In addition, the correlation matrix C DD for the case that port 8 is terminated by 50 Ω is
 $${\bf C}_{DD,7} = \left( {\matrix{ 0 & 0 \cr 0 & 1 \cr}} \right).$$
Similarly when port 7 is terminated in 50 Ω
 $${\bf C}_{DD,8} = \left( {\matrix{ 1 & 0 \cr 0 & 0 \cr}} \right).$$
The corresponding measured noise powers for ports 1–4 when the DUT ports are terminated in short, open, and offset open are denoted β S7 and β S8, β O7 and β O8, β D7 and β D8, respectively. The subscripts 7 and 8 denote the port shorted or opened or offset opened.
Noting that the Q-matrix of equation (1) will change according to the nature of S D , which in this case are the terminations described above, q ij in equations (5) represents element of the new Q-matrix formed with those terminations. Thus, the excess noise power at port 1 for terminations open, short, and offset open can be expressed as
 $$\eqalign {& \left ( {\matrix{ {{\left \vert {q_{11,O7}} \right \vert} ^2} & {q_{11,O7}r_{11}^*} & {r_{11}q_{11,O7}^*} \cr {{\left \vert {q_{11,S7}} \right \vert} ^2} & {q_{11,S7}r_{11}^*} & {r_{11}q_{11,S7}^*} \cr {{\left \vert {q_{11,D7}} \right \vert} ^2} & {q_{11,D7}r_{11}^*} & {r_{11}q_{11,D7}^*} \cr}} \right)\left( {\matrix{ {{\left \vert {c_{i1}} \right \vert} ^2} \cr {c_{i1}c_{o1}^*} \cr {c_{i1}^* c_{o1}} \cr}} \right) \cr & \quad = \left( {\matrix{ {\beta _{O7,1}} \cr {\beta _{S7,1}} \cr {\beta _{D7,1}} \cr}} \right).}$$
Similarly, when port 8 is terminated in the three terminations mentioned above and port 7 is terminated in matched load, the following equations are obtained:
 $$\eqalign {& \left( {\matrix{ {{\left \vert {q_{12,O8}} \right \vert} ^2} & {q_{12,O8}r_{12}^*} & {r_{12}q_{12,O8}^*} \cr {{\left \vert {q_{12,S8}} \right \vert} ^2} & {q_{12,S8}r_{12}^*} & {r_{12}q_{12,S8}^*} \cr {{\left \vert {q_{12,D8}} \right \vert} ^2} & {q_{12,D8}r_{12}^*} & {r_{12}q_{12,D8}^*} \cr}} \right)\left( {\matrix{ {{\left \vert {c_{i2}} \right \vert} ^2} \cr {c_{i2}c_{o2}^*} \cr {c_{i2}^* c_{o2}} \cr}} \right) \cr & \quad = \left( {\matrix{ {\beta _{O8,1}} \cr {\beta _{S8,1}} \cr {\beta _{D8,1}} \cr}} \right).}$$
Solving equations (5a) and (5b) yields |c i1|2, c i1 c o1*, c i1*c o1 and |c i2|2, c i2 c o2*, c i2*c o2. Similar results can be obtained for the three remaining measuring ports, ports 2–4. Thus by averaging the values, c i and its correlation with c e can be determined.
Once these noise waves and respective correlations are determined, then all the internal noise sources of the eight-port network as well as the external noise source coming from switch terminations are known and a calibrated noise power, which is exclusively due to a DUT being measured, β e can be obtained by accounting for the effect of these noise contributions; and the result can be expressed as
 $${\bf \beta} _e = {\bf \Lambda} {\bf c}_D.$$
This relationship between the calibrated measured noise powers and the DUT noise waves is of the form:
 $${\bf y} = {\bf Ax}{\rm,} $$
 $${\bf A} = \left( {\matrix{ {{\left \vert {\lambda _{11}} \right \vert} ^2} & {{\left \vert {\lambda _{12}} \right \vert} ^2} & {2{\mathop{\rm Re}\nolimits} \left( {\lambda _{11}\lambda _{12}^*} \right)} & { - 2{\mathop{\rm Im}\nolimits} \left( {\lambda _{11}\lambda _{12}^*} \right)} \cr {{\left \vert {\lambda _{21}} \right \vert} ^2} & {{\left \vert {\lambda _{22}} \right \vert} ^2} & {2{\mathop{\rm Re}\nolimits} \left( {\lambda _{21}\lambda _{22}^*} \right)} & { - 2{\mathop{\rm Im}\nolimits} \left( {\lambda _{21}\lambda _{22}^*} \right)} \cr {{\left \vert {\lambda _{31}} \right \vert} ^2} & {{\left \vert {\lambda _{32}} \right \vert} ^2} & {2{\mathop{\rm Re}\nolimits} \left( {\lambda _{31}\lambda _{32}^*} \right)} & { - 2{\mathop{\rm Im}\nolimits} \left( {\lambda _{31}\lambda _{32}^*} \right)} \cr {{\left \vert {\lambda _{41}} \right \vert} ^2} & {{\left \vert {\lambda _{42}} \right \vert} ^2} & {2{\mathop{\rm Re}\nolimits} \left( {\lambda _{41}\lambda _{42}^*} \right)} & { - 2{\mathop{\rm Im}\nolimits} \left( {\lambda _{41}\lambda _{42}^*} \right)} \cr}} \right),$$
 $${\bf x} = \left( {{\left \vert {c_{d,1}} \right \vert} ^2,{\left \vert {c_{d,2}} \right \vert} ^2,{\mathop{\rm Re}\nolimits} \left( {c_{d,1}c_{d,2}^*} \right),{\mathop{\rm Im}\nolimits} \left( {c_{d,1}c_{d,2}^*} \right)} \right)^t,$$
 $${\bf y} = \left( {{\left \vert {\beta _1} \right \vert} ^2,{\left \vert {\beta _2} \right \vert} ^2,{\left \vert {\beta _3} \right \vert} ^2,{\left \vert {\beta _4} \right \vert} ^2} \right)^t.$$
The column matrix x can then be reordered into a 2 × 2 noise wave correlation matrix of the DUT, C DD given by
 $${\bf C}_{{\bf DD}} = \left( {\matrix{ {{\left \vert {c_{d,1}} \right \vert} ^2} & {c_{d,1}c_{_{d,2}} ^*} \cr {c_{_{d,1}} ^* c_{_{d,2}}} & {{\left \vert {c_{d,2}} \right \vert} ^2} \cr}} \right) = \left( {\matrix{ {c_{11}} & {c_{12}} \cr {c_{21}} & {c_{22}} \cr}} \right) $$
The noise current correlation matrix C Y and ABCD noise correlation matrix C A are obtained by applying the transformations in [Reference Hillbrand and Russer25] to the obtained noise wave correlation matrix in (9). The noise parameters are then computed from the ABCD noise correlation matrix obtained using the formulae in [Reference Hillbrand and Russer25].
IV. MEASUREMENTS
A S-parameters measurement of the eight-port network
It must be noted that, the eight-port network consists of the six-port network, the two flexible cables connecting the couplers to the six-port network via the LNA amplifiers, the bias-T and the onwafer probe. Since there is no direct way of connecting the tips of the probe (here representing ports 7 and 8) to the network analyzer, a challenge arises in the measurement of the S-parameters of the eight-port network.
To do this, the wafer probes are disconnected making the eight-port network an all-coaxial connector-type network. The S-parameters of such a network is easily measured using a four-port network analyzer. Since the output ports of the eight-port network (ports 1–4) are connected to an SP4T switch, the eight-port network essentially reduces to a five-port network. Thus, by varying the switch state, four (4) datasets of S-parameters can be obtained which can be combined to form the eight-port S-parameters.
To obtain the S-parameters of the wafer-probes, a two-port network analyzer is used. Port 1 of the network analyzer is calibrated for one-port coaxial connector type DUT measurement, while the other port is calibrated with a wafer probe calibration kit for one-port wafer probe DUT measurement. The wafer probe is then connected to the coaxial connector of the network analyzer and a two-port S-parameters measurement is carried out to obtain the S-parameters of the wafer probes. The S-parameters of the wafer probes thus obtained is combined with the eight-port S-parameters earlier measured to form the complete eight-port S-parameters inclusive of the wafer probes.
B Noise parameters measurement
The measurement setup is as shown in Fig. 1. For the purposes of calibration, onwafer-type 50 Ω terminations, open, short, and offset-open were used as the DUT. The respective noise powers measured at ports 1–4 enabled the calibration of the eight-port network as set out in Section III, which involves the determination of the noise waves emanating from the switch terminations as well as those emerging from the eight-port network. The following are the steps involved in the calibration. The reference to port numbers is as designated in Fig. 1(a).
Step 1: The NFA is calibrated with a 14–16 dB ENR noise source only. Mismatch at the input of the NFA can be reduced using an attenuator. Step 2: The setup for the calibration is wired as shown in Fig. 1, but without the DUT.
The following set of steps is for determining c e , the noise wave emitted by the eight-port network, directly into the measurement ports.
Step 3: Two 50 Ω terminations are used to terminate ports 7 and 8. Step 4: The noise source is then connected to port 5, while port 6 is terminated in matched load. Step 5: Switching the output from ports 1 to 4, the noise figure and gain for this state is measured for each of the four measuring ports. Step 6: The noise source is then switched to port 6, while port 5 is terminated in matched load. Step 7 is then repeated.
This set of steps is for determining c i , the noise wave emitted by the eight-port network into ports 7 and 8, and its correlation with c e .
Step 8: One of the 50 Ω terminations is replaced with an open termination. Step 9: Steps 4–6 are then repeated for this state of termination. Step 10: The open and 50 Ω terminations at ports 7 and 8 are switched and steps 4–6 are again repeated. Steps 8–10 are then repeated for the remaining sets of termination; short, and offset open.
The noise powers measured in the steps above for the different conditions of terminations, are used to determine all the noise sources emanating from within and without the eight-port network.
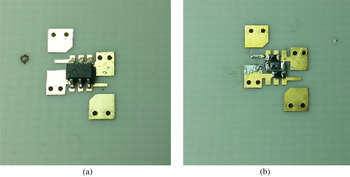
Having thus calibrated the eight-port network, the DUTs shown in Fig. 4, a 10-dB attenuator and an MGA-82563 MMIC amplifier, were then employed in the setup to determine their respective noise waves correlation matrices and thus their noise parameters. With the DUTs connected, the noise spectral densities at the output of the eight-port network are imported into the equations set above in Section III to determine their respective noise parameters.
V. RESULTS AND DISCUSSION
A S-parameters measurement of the eight-port network
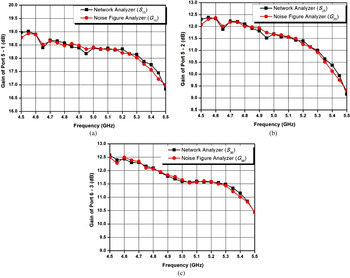
The results of the S-parameters measurement for the eight-port extension of the six-port network, which includes the wafer probes, are as shown in Fig. 3. In total, eight (8) such plots could be obtained, considering that there are four (4) output ports and the noise source can alternately be applied to ports 5 and 6. For want of space however, only three (3) samples of such results are presented here. It must be noted that, in noise figure measurements with an NFA, the gains, G of the respective two-ports being measured can also be obtained along with the respective noise figures, F. The gains can then be compared with the S-parameters results to assess the accuracy of the constituted eight-port S-parameters. Figure 3(a) shows the gain of the two-port formed between ports 5 and 1; i.e. when the smart noise source is applied to port 5 and the noise power is measured at port 1. Figure 3(b) on the other hand shows the gain of the two-port formed between ports 5 and 2. The last, Fig. 3(c) shows the gain obtained when the noise source is applied to port 6 and the noise power is measured from port 3.
Comparison of measured gains from S-parameters measurement and from noise figure measurements: (a) Ports 5–2; (b) Ports 5–3; and (c) Ports 6–3.

A very good agreement can be observed between the two results (network analyzer and NFA measurements), deviating by < ±0.1 dB, which confirms that the S-parameters of the eight-port network including the wafer probes were accurately obtained.
B Noise parameters measurement
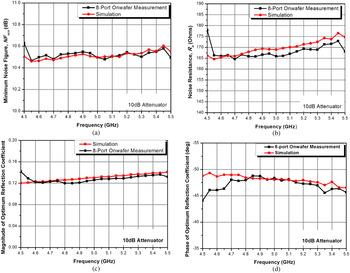
Figures 5 and 6 show the results of the noise parameters measurement of two DUTs, respectively [an MGA-82563 MMIC amplifier (Fig. 4(a)) and a 10-dB attenuator (Fig. 4(b))]. In the case of the 10-dB attenuator which is a passive device, Fig. 5, the reference noise parameters were obtained from simulation, using the measured S-parameters of the 10 dB attenuator; in accordance with the Bosma theory [Reference Bosma26]. The agreement between the reference and obtained results is remarkably very good. The deviation from the reference trace is observed to be within ±0.1 dB for the minimum noise figure, NF min , while that for the noise resistance, R n is within 1%. It is also remarkable that, the optimum reflection coefficient, the magnitude of which is between 0.12 and 0.14 could be estimated by the proposed technique.
DUT: (a) MGA-82563 MMIC amplifier and (b) 10 dB attenuator.

Noise parameters of 10 dB attenuator: (a) Minimum noise figure, NF min ; (b) Noise resistance, R n ; (c) Magnitude of optimum reflection coefficient, S opt ; and (d) Phase of optimum reflection coefficient, S opt .

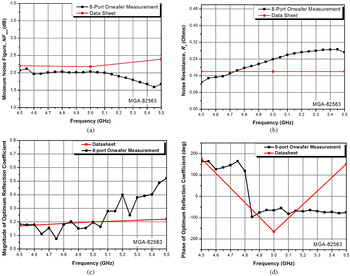
Noise parameters of MGA-82563 MMIC amplifier. (a) Minimum noise figure, NF min ; (b) Noise resistance, R n ; (c) Magnitude of optimum reflection coefficient, S opt ; and (d) Phase of optimum reflection coefficient, S opt .

The reference noise parameters in the case of the MGA-82563 MMIC amplifier were obtained from the datasheet supplied by the manufacturer. It must be noted that, only three (3) frequency points for the given frequency range is available from the datasheet, whereas our measurement were taken over 51 frequency points. Furthermore, quoting from the datasheet of the MGA-82563 by Avago Technologies [27], “the values for parameters are based on comprehensive product characterization data, in which automated measurements are made on a minimum of 500 parts taken from 3 non-consecutive process. The data derived from product characterization tend to be normally distributed, e.g. fits the standard ‘bell curve’. For parameters where measurements or mathematical averaging may not be practical, such as the Noise and S-parameter tables or performance curves, the data represents a nominal part taken from the ‘centre’ of the characterization distribution”. Thus, the results obtained from the measurement of only one such MGA-82563 MMIC amplifier using the proposed technique shows deviation in noise parameters from the nominal values in the datasheet. In the light of these observations, the departure of the measured results from the datasheet, is reasonable and demonstrates the capability of the technique presented in estimating the noise parameters of an onwafer-type DUT. It must be added that, factors that affect the accuracy of the extracted noise parameters include input and output mismatches of the DUT as well as the gain of the DUT. A portion of the noise waves emanating from the DUT can be reflected at the input and output planes of the noise parameters test set, back into the DUT, a situation that has not been factored in this work.
VI. CONCLUSION
A new technique for the extraction of the noise wave correlation matrix and thus noise parameters of onwafer-type DUTs was presented. A technique proposed for the determination of the S-parameters of the eight-port extension of the six-port network including the wafer probes proved to be successful. Finally, the noise parameters of 10 dB attenuator were successfully extracted using the technique presented here; whereas those of the MGA-82563 MMIC amplifier gave a good estimation of the values in the datasheet. Applying this technique will enable a quick and low-cost extraction of the noise parameter of onwafer-type DUTs.
ACKNOWLEDGEMENTS
This work was supported by the Korean Government under the National Research Foundation of Korea (KRF- 2014-010440).
 Abdul-Rahman Ahmed was born in Yeji, Ghana, in 1977. He received the MSc. Degree in Radio Systems Engineering from the University of Hull in 2005 and a Ph.D. degree in radio science and engineering from Chungnam National University, Daejeon, Korea in 2014. He has been a lecturer with the Department of Electrical and Electronic Engineering, Kwame Nkrumah University of Science and Technology, Kumasi, Ghana, since 2005. His current research interests are noise parameter measurement techniques, Microwave Circuit Design and Mobile Radio Propagation.
 Don-Hyun Lee is a PhD student with the department of Radio Science and Engineering, where he also obtained his MSc and BSc in Radio Science and Engineering in 2013 and 2015 respectively.
 Kyung-Whan Yeom was born in Seoul, Korea, in 1957. He received the B.S. degree in electronics from Seoul National University, Seoul, Korea, in 1980, and the M.S. and Ph.D. degrees in electrical engineering from the Korea Advanced Institute of Science and Technology (KAIST), Daejeon, Korea, in 1982 and 1988, respectively. From 1985 to 1991, he was with LG Precision, as a Principal Engineer. He worked with the microwave integrated circuit (MIC) team as a Team Leader and was subsequently involved with the Military Electronics Division for electronic warfare (EW) equipment. From 1991 to 1995, he was with LTI, where he was involved with power-amplifier modules for analog cellular phones. In 1995, he joined Chungnam National University, Daejeon, Korea, as an Assistant Professor, and is currently a Professor with the Department of Radio Science and Engineering. His research interests are in the design of hybrid and monolithic microwave circuits and microwave systems. Prof. Yeom is a member of the Korean Institute of Electromagnetic Engineering and Science (KIEES) since 1995. He was the editor-in-chief of KIEES from 2004 to 2006. He was the recipient of the IR-52 Jang Youg-Sil Prize from the Ministry of Science and Technology (MOST) of Korea for his work on cellphone power amplifiers in 1994. He was also the recipient of the Academic Award of KIEES in 2004.