


Introduction
The areal distribution of snow cover and the variability of its characteristics are important inputs in climate and hydrological models. In a complex Alpine topography, the extent, depth and density of the snow cover are highly variable (Reference Elder, Dozier and MichaelsenElder and others, 1991). Therefore, the inclusion of these data in climate and hydrological models is difficult, and very often models are used that need to be locally calibrated (Reference Kirnbauer, Blöschl and GutknechtKirnbauer and others, 1994). Using the coupled models SAFRAN-Crocus, Reference Martin, Brun and DurandMartin and others (1994) showed the potential of physically based snow-cover models to reproduce and simulate a snow climatology for large Alpine regions without the need for local calibrations. Still, SAFRAN (Systeme d'Analyse Fournissant des Renseignements Atmosphériques à la Neige) is a sophisticated meteorological model, requiring inputs from other meteorological models (Reference Durand, Brun, Merindol, Guyomarc'h, Lesaffre and MartinDurand and others, 1993). It calculates the input variables for snow-cover simulations in a model topography over quite large areas (about 1000 km2).
For investigations of the snow cover in real topography, however, the influences of the surrounding terrain (e.g. shading effects, reflections and emission from the terrain) have to be included on a smaller scale. For this purpose an areal energy-balance (AEB) model has been developed (Reference PlüssPlüss, 1996), based on automatic meteorological measurements as input. The model parameterizes the predominant energy fluxes at the snow-atmosphere interface in a digitized terrain model (grid size 25 × 25 m2; total area 4 × 4 km2), including parameterizations of the diffuse and direct sky irradiance and of the irradiance from the surrounding topography in both the shortwave and longwave range. The AEB model was successfully tested during the 1995 ablation period of the snow cover in the eastern Swiss Alps (Reference PlüssPlüss, 1996).
The purpose of this work was to drive a physically based snow-cover model (Crocus) with the hourly output of the AEB model in order to simulate the temperature and mass evolution of the snowpack on inclined terrain, and to assess its potential for use in climate and hydrological studies. A qualitative verification of the models’ performance was done during the pre-melt season by taking several temperature and snow profiles on south- and north-facing slopes, and by comparing simulated and measured energy Quxes on a well-equipped study site.
Methods
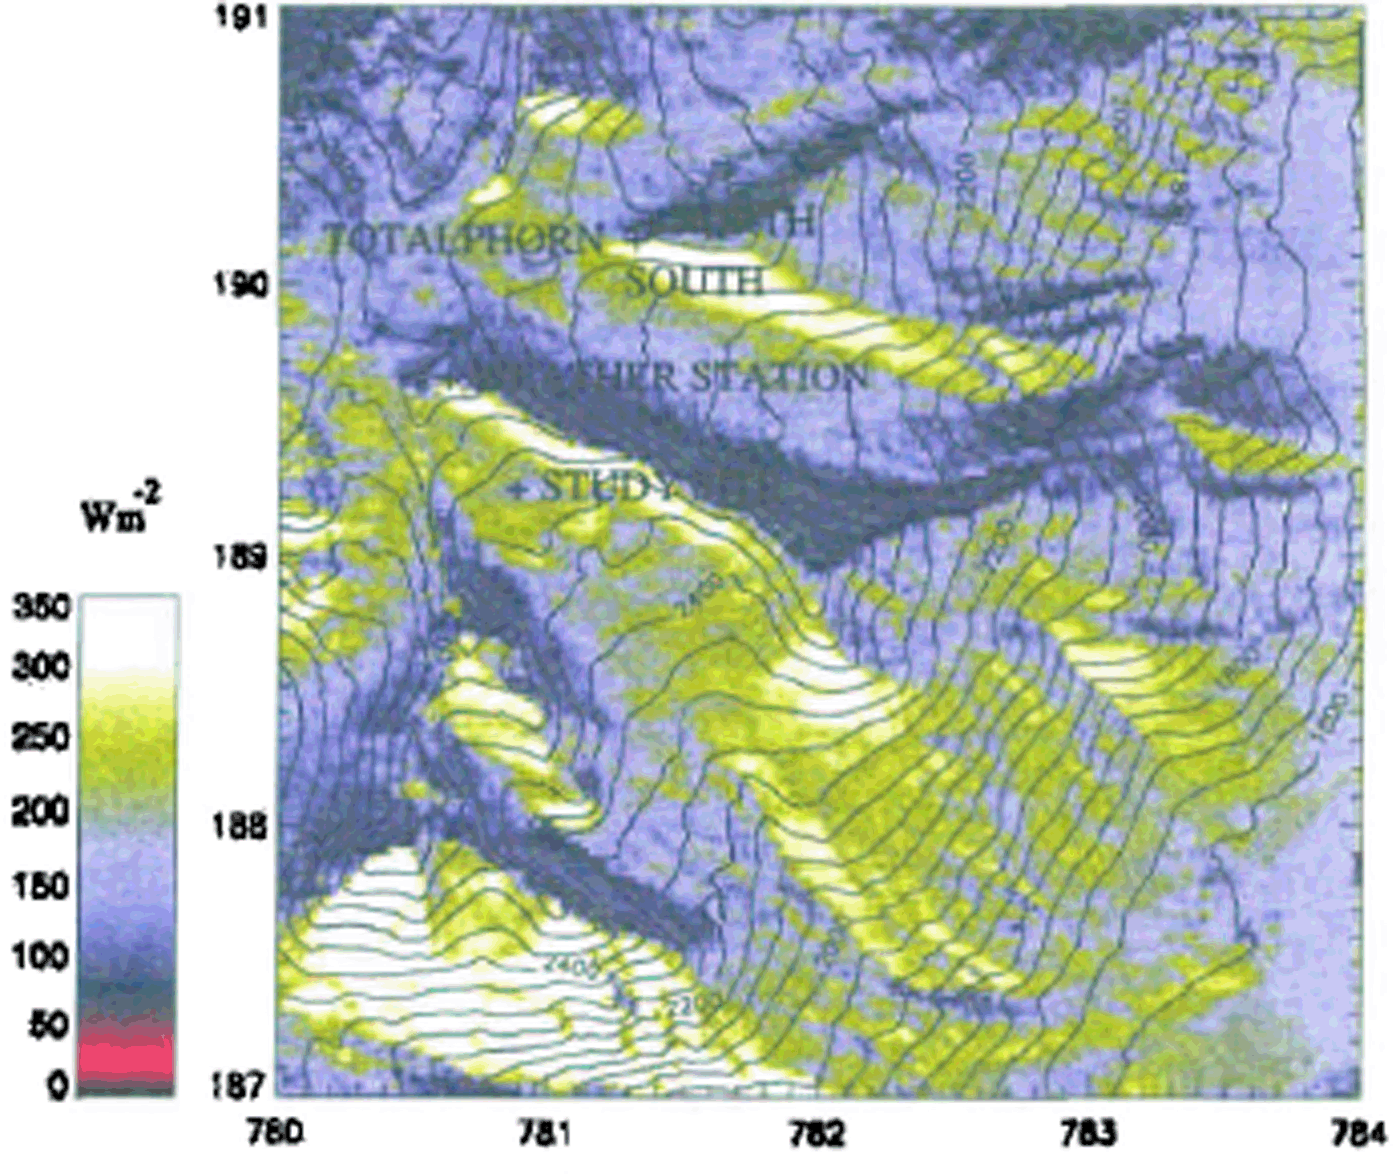
The evolution of snow cover was simulated at three locations near the Swiss Federal Institute for Snow and Avalanche Research at Weissfluhjoch/Davos: the flat study site of the institute (at 2540 m a.s.l.) and the adjacent south- and north-facing slopes of the Totalphorn (2480 m a.s.l., inclination 36° and 2470 m a.s.l., inclination 38°, respectively) (Fig. 1). The simulation of the snowpack on the flat study site allows detailed and continuous checks of model outputs. The simulation period extends from 1 March 1996 0100h UTC to 2 May 1996 0000 h UTC.
Mean global radiation over 24jours in Wm −2 simutated by the areal energy balance model for 5 March 1996 (the numbers on the sides of the map stand for km caordinates). On this clear day. 215 Wm −2 global radiation was measured in 24 hours by the outamatir weather station at Weissfluhjoch. Also indicated are the lorations of the two measurement sites on inclined stopes at Tulalphorn as well as of both the study site and the automatic weather station.
The hourly input to the AEB model was taken from the automatic weather station located at Weissfluhjoch, 2693 m a.s.l. (data taken included air temperature, wind speed, relative humidity and global radiation) and from the mean of three daily observations at Weissfluhjoch (cloudiness). The 24 hour water equivalent of fresh snow measured on the study site was distributed over the day according to the precipitation sequence recorded with a rain gauge. The main precipitations during the period studied were accompanied by moderate winds blowing mainly from northwest to north. The period 20-24 April was characterized by air temperatures near 0°C and sustained gusty south winds.
The areal distribution of the predominant energy fluxes at the snow surface was modelled by the AEB model, using hourly automatic weather station data as input. The mean atmospheric transmission for clear-sky situations is calculated from the transmissivities of the most important aerosols and molecules in the atmosphere (see Reference DozierDozier, 1980), but neglecting the wavelength dependency. The influence of cloud cover was calculated from the ratio of measured global radiation to the top-of-atmosphere radiation. On inclined surfaces, the effects of the surrounding terrain are included for diffuse and direct radiation. For the calculation of longwave-radiation balance, the effects of cloud cover and the radiation from the surrounding topography are taken into account. The turbulent fluxes are calculated assuming an areal constant drag coefficient for each time-step. Wind speed was calculated from a mean gradient estimated from previously recorded wind speeds at Weissfluhjoch (2693 m a.s.l.) and Davos (1560 m a.s.l.). Figure 1 shows an AEB model output for daily mean global radiation.
The hourly output of the AEB model (air temperature, wind speed, relative humidity, incoming direct and diffuse shortwave radiation and incoming langwave radiation) as well as cloudiness and study site precipitation were used to run Crocus. It is a one-dimensional (1-D), physically based mass and energy-balance model of the snowpack (Reference Brun, David, Sudul and BrunotBrun and others, 1992), whith simulates the internal evolution of the snow cover including the most important physical processes (temperature distribution, settling, metamorphosis, simplified percolation, etc.). According to prior studies of snow accumulation in the same area (Reference FöhnFöhn, 1980). precipitations inferred from the study site were reduced by 25% on the windy weather side (north, erosion) whereas they were increased by 25% for the lee side (south, deposition).
To check on the consistency of the model outputs, Crocus was also run with meteorological data measured automatically on the study site. Incoming shortwave and longwave radiation are measured separately, and may be directly used by Crocus. Cloudiness as well as separation into direct and diffuse incoming shortwave radiation were estimated using the parameterizations included in the model.
To initialise Crocus, as well as to verify its outputs, snow profiles were taken every 10 14 days over the test period on all three sites. Six profiles each were taken around 0800h UTC on the south-facing slope and around 1300h UTC either the day before or the same day on the north slope. Profiles on the study site are usually taken around 0900 h UTC. Special care was given to the measurement of both temperature and density profiles. Stratigraphy was recorded, but will not be presened in this paper.
Results
Figure 2a shows the automatically recorded snow depth on the study site as compared to the simulation driven by the output of the AEB model. The simulated snow depth is calculated from the recorded water equivalent of precipitations, taking account of both air temperature and wind.
(a) Snow depth and (b) surface temperature on the study site at Weissfluhjoch. Solid line is measured; crosses are simulated with AEB model data as input.
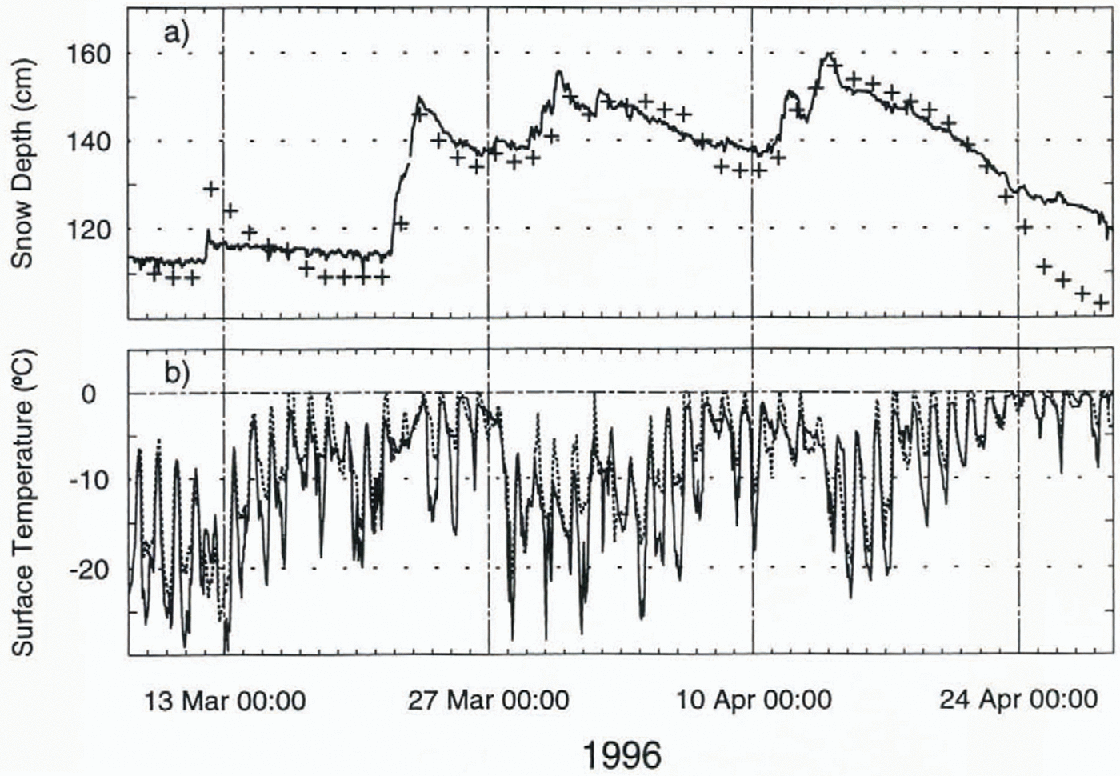
The energy balance at the snow–atmosphere interface is reflected in the surface temperature T s as long as T s <0°C (Kondo and Yamazaki, 1990). Thus, as a first check, the surface temperature calculated by the snow-cover model may be compared to measured values of T s . Indeed, thanks to a careful calibration of infrared thermometers (Weilenmann, 1996), the snow-surface temperature T s may accurately be measured on the study site at Weissfluhjoch. Figure 2b shows the comparison of the measured surface temperature to the simulated one using input data from the AEB model.
was characterized by air temperatures near 0°C and sustained gusty south winds.
The areal distribution of the predominant energy fluxes at the snow surface was modelled by the AEB model, using hourly automatic weather station data as input. The mean atmospheric transmission for clear-sky situations is calculated from the transmissivities of the most important aerosols and molecules in the atmosphere (see Reference DozierDozier, 1980), but neglecting the wavelength dependency. The influence of cloud cover was calculated from the ratio of measured global radiation to the top-of-atmosphere radiation. On inclined surfaces, the effects of the surrounding terrain are included for diffuse and direct radiation. For the calculation of longwave-radiation balance, the effects of cloud cover and the radiation from the surrounding topography are taken into account. The turbulent fluxes are calculated assuming an areal constant drag coefficient for each timestep. Wind speed was calculated from a mean gradient estimated from previously recorded wind speeds at Weissfluhjoch (2693 m a.s.l.) and Davos (1560 m a.s.l.). Figure 1 shows an AEB model output for daily mean global radiation.
The hourly output of the AEB model (air temperature, wind speed, relative humidity, incoming direct and diffuse shortwave radiation and incoming longwave radiation) as well as cloudiness and study site precipitation were used to run Crocus. It is a one-dimensional (1-D), physically based mass and energy-balance model of the snowpack (Reference Brun, David, Sudul and BrunotBrun and others, 1992), which simulates the internal evolution of the snow cover including the most important physical processes (temperature distribution, settling, metamorphosis, simplified percolation, etc.). According to prior studies of snow accumulation in the same area (Reference FöhnFöhn, 1980), precipitations inferred from the study site were reduced by 25% on the windy weather side (north, erosion) whereas they were increased by 25% for the lee side (south, deposition).
To check on the consistency of the model outputs, Crocus was also run with meteorological data measured automatically on the study site. Incoming shortwave and longwave radiation are measured separately, and may be directly used by Crocus. Cloudiness as well as separation into direct and diffuse incoming shortwave radiation were estimated using the parameterizations included in the model.
To initialise Crocus, as well as to verify its outputs, snow profiles were taken every 10–14 days over the test period on all three sites. Six profiles each were taken around 0800 h
UTC on the south-facing slope and around 1300 h UTC either the day before or the same day on the north slope. Profiles on the study site are usually taken around 0900 h UTC. Special care was given to the measurement of both temperature and density profiles. Stratigraphy was recorded, but will not be presented in this paper.
Results
Figure 2a shows the automatically recorded snow depth on the study site as compared to the simulation driven by the output of the AEB model. The simulated snow depth is calculated from the recorded water equivalent of precipitations, taking account of both air temperature and wind.
The energy balance at the snow-atmosphere interface is reflected in the surface temperature Ts as long as Ts <0°C (Reference Kondo and YamazakiKondo and Yamazaki, 1990). Thus, as a first check, the surface temperature calculated by the snow-cover model may be compared to measured values of Ts . Indeed, thanks to a careful calibration of infrared thermometers (Weilenmann, 1996), the snow-surface temperature Ts may accurately be measured on the study site at Weissfluhjoch. Figure 2b shows the comparison of the measured surface temperature to the simulated one using input data from the AEB model.
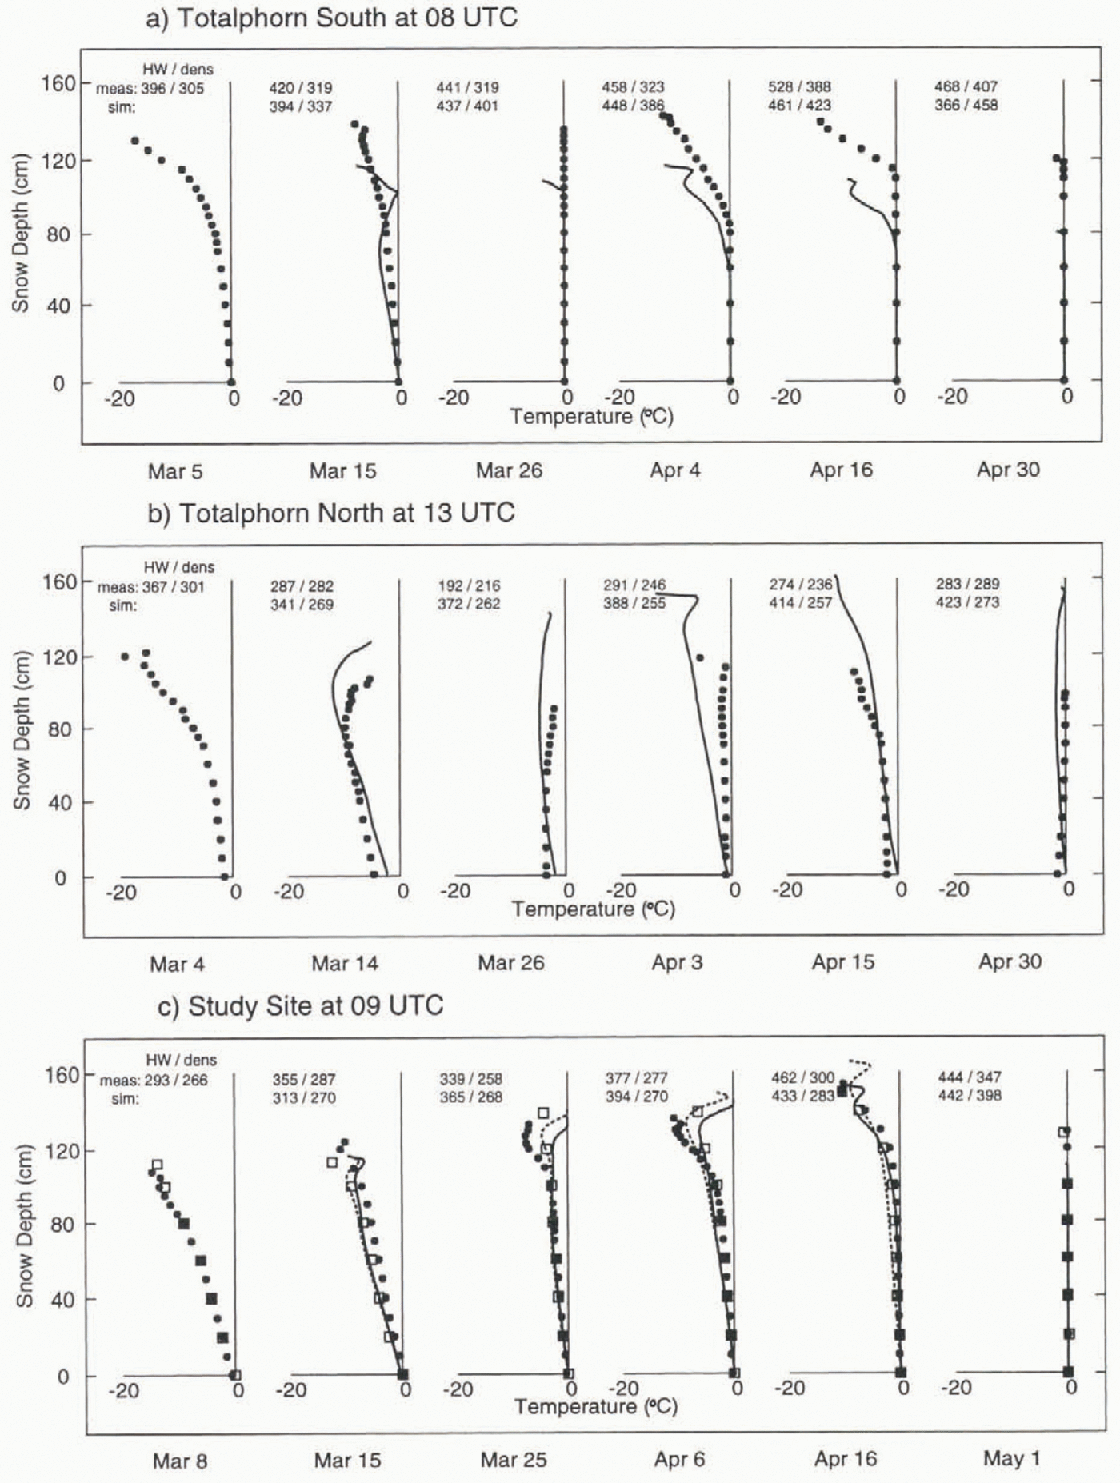
For all sites, measured profiles taken Irum snow pits are compared to simulated temperature profiles in Figure 3. The first profile on each site, including stratigraphy, was used to initialize Crocus. Also shown for the study site are the results of the simulation with Study site data as well as temperature profiles recorded automatically with evenly spaced (20 cm) fixed sensors. Furthermore, both measured and simulated values of the water equivalent and the mean density of the snow cover are given at the top of the corresponding profiles.
Temperature profiles on (a) Totalphorn south, (b) Totalphorn north and (c) the study site. The first profile on each site has used to initialise Crocus. Filled circles are measured profiles (snow pits); solid lines are simulations with AEB model data; hatched lines are simulations for the study site with study-site data; squares are automatically recorded profiles on the study site. Measured (snow pits) and simulated values of both the water equivalent HWin mm H2O and the mean density dens in kg m−3 of the snow cover are given on top of the corresponding profiles.
Discussion
Since the AEB model showed promising results for modelling the ablation of the snow cover in a complex topography (Reference PlüssPlüss, 1996), the purpose of this study was to assess the ability of the coupled AEB-Crocus models to simulate qualitatively the internal evolution of the snow cover in a complex Alpine topography. However, running the AEB-model with hourly input and output data may lead to difficulties with respect to the simulation of turbulent fluxes. Due to the high variability of wind speed in time and space, the bulk para-meterizations for hourly means of these fluxes may be biased by a considerable error (Reference Plüss and MazzoniPlüss and Mazzoni, 1994). For daily means, however, these errors are small with respect to the magnitude of the radiative fluxes. Thus the focus has been set on long-term properties such as water equivalent and the mean density of the snow cover, as well as the time evolution of the temperature gradient in the lower part of the snowpack.
The results for the study site are satisfactory. Even though the difference between simulated and measured temperature gradients on the lower part of the snowpack may be up to the order of 25%, the time evolution is correctly modelled. There is a problem, however, regarding the overnight cooling of the surface (Fig. 2b). Indeed, the model tends to overestimate the surface temperature Ts. Least squares tits of the modelled surface temperatures vs the measured one yielded R2 terms of 0.807 (slope = 0.73) for the AEB-driven run and 0.944 slope = 0.91) with study site data as input. This effect, however important for processes and temperature gradients near the surface, will not affect the long-term internal evolution of the lower part of the snowpack by much.
In terms of mass balance, measured and modelled water equivalents and mean densities agree within 13%. This scatter may be due to both small-scale inhomogeneities or the accumulation on the study site and measurement errors. Noteworthy is the strong simulated settling of snow cover during the warm period from 20–24 April (Fig. 2), probably as a result of an anticipatory simulated wet-snow meta-morphism of the lowest layers of the snowpack.
Larger discrepancies, however, arise for the- snow-cover simulation on sloped terrain, especially regarding mass balance. Problems may be due cither to overdensification (first four profiles or Totalphorn south) as described above for the study site or to large inhomogeneities in the accumulation that could not be correctly modelled due to a lack of accurate wind field data. Moreover, the collection of field data on slopes is problematic in itself and the exact location of the snow pits may vary by up to 20 m, or even more on the north-facing slope. The latter may be the main reason for the differences arising between simulated and measured profiles at Totalphorn north on 3 April. Substantial improvements are needed for both mass balance and settling. Whereas settling may be improved through detailed investigations of measurements on the study site, the areal variability of snow depth on slopes due to wind effects and local topography will remain a problem until better snow-drift models are available. Furthermore, water percolation on inclined terrain cannot be represented well enough with a 1-D model, influencing also the computation of mass balance.
Nevertheless, the obvious ability of the coupled models to simulate quite correctly the evolution of temperature gradients of the lower part of the snowpack on both south- and north-facing slopes is encouraging for future applications. Indeed, using “representative” snow depths for given aspects and altitudes, these models will be valuable for climatic and hydrological studies since there is no need for local calibrations. On the other hand, this short study underlines once more the need for accurate field data for verification and, at this Stage, cross-checks with simulations on flat and representative sites are essential to gain confidence in the performance of the models.
Conclusions
Satisfactory modelling of both the temperature and mass evolution of a snow pack in a complex Alpine topography over a 2 month period with models that do not require to be locally calibrated has been demonstrated. The importance of accurate field data to verify model outputs has been underlined. A better know ledge of the wind field, and hence of the accumulation and turbulent fluxes, as well as of physical processes like settling and water percolation, should lead to improved mass and energy balances. Such models may then be of value for climatic and hydrological studies in Alpine environments. Finally, the possibility of using energy-balance models at the snow–atmosphere interface to produce input data for physically based snow-cover models will also be of value for regional avalanche fore-casting.
Acknowledgements
We would like to thank P.M.B. Föhn for having initiated and supported this study. We are also indebted to A. Awlad. K. Mellini, M. Phillips, E. Beck, D. Bühlmann, C. Camponovo, P. Gauer, R. Meister, C. Oberschmied, M. Schär and P. Weilenmann who helped to collect the field data.



