1 Introduction
Although federal laws regulate private pensions by imposing specific funding requirements, these laws do not apply to public pensions. This lack of strict pension oversight means state legislatures can undercontribute to their defined benefit pension plans. This may be of particular concern when state governments face fiscal stress, as undercontributing can help governments mitigate politically unpopular spending cuts and tax increases.Footnote 1
State-administered pensions receive funds from four sources. In fiscal year 2011, state governments, employees, and local governments each contributed about $30 billion, or over $100 per capita (Figure A1). While quite volatile, investment returns averaged over $300 per capita annually between mid-1999 and mid-2008, an average annual return of 8%. Despite these large inflows, state pension assets have not kept up with growing liabilities. Many states contribute the actuarially recommended amount to their pensions, but state governments may undercontribute to their pensions more when they face fiscal stress. For example, following the 1992 fiscal crisis, California delayed annual contributions of about $500 million to CalPERS, its public employees’ retirement system (U.S. General Accounting Office, 1996).Footnote 2
This study answers two questions. First, how do state pension contributions respond to fiscal stress? As undercontributing to pensions provides an opaque means of deficit spending (and a way to sidestep balanced budget requirements), I expect fiscal stress to cause pension contributions to fall disproportionately more than other state spending. In fact, I find that fiscal stress is associated with states cutting their pension contributions at seven times the rate of other spending.
Second, what fraction of current pension underfunding was caused by past undercontributions? This fits into a current debate about the cause of pension underfunding. Munnell (Reference Munnell2012) argues that underfunding is not due to the discount rates used to calculate liabilities or union bargaining power, but that underfunding is ‘simply a story of fiscal discipline.’ In contrast, this study shows that lack of fiscal discipline, at least when proxied by undercontributions, only explains a third of actuarial underfunding.Footnote 3
This paper is structured as follows. In the next section, I review previous research of pension contributions and underfunding, and then explain how fiscal stress is estimated and used to model undercontributions. In Section 3, I describe various data sources. In Section 4, I present regression estimates of the effect of fiscal stress on pension contributions. Alternative measures of fiscal stress and alternative models demonstrate the robustness of my regression results. I also show how variation in state institutions helps explain pension undercontributions. For example, I find that stronger balanced budget requirements are correlated with pension undercontributions. In Sections 5 and 6, I review causes of actuarial underfunding and recent reforms to state pensions.
2 Modeling pension contributions
Previous research has investigated the causes of pension contribution levels and underfunding. Using a single year of data for about 40 pensions in the late 1980s, Mitchell and Smith (Reference Mitchell and Smith1994) estimate that lower state pension contributions are correlated with above average unemployment. Using 2006 data, Munnell et al. (Reference Munnell, Haverstick, Aubry and Golub-Sass2008) find that pension sponsors are more likely to undercontribute if a pension has more assets and if states have poor fiscal health, as measured by ratios of debt to gross state product. Chaney et al. (Reference Chaney, Copley and Stone2002) find that when fiscally stressed, as proxied by year-end general fund balances, states with balanced budget requirements both have more poorly funded pensions and choose discount rates that obscure actuarial underfunding. They use one year of data in the mid-1990s. Using three years of data, Giertz and Papke (Reference Giertz and Papke2007) find that tax revenues influence pension funding status and are correlated with actuarial assumption manipulation. Hence, previous research (1) relied on only a few years of data for a small number of pensions, (2) used indirect proxies for fiscal stress, such as unemployment and general fund balances, (3) used as dependent variables contribution levels, which do not adjust for actuarial requirements and so do not measure ‘undercontributions’, or used funding ratios, a ‘stock’ variable and hence a noisy measure of short-term contribution behavior, and (4) relied on cross-sectional comparisons of contribution-related ‘flows’ and underfunding ‘stocks’.
I extend previous research by (1) constructing a large panel of pensions over the last two decades including over a thousand pension plan observations (this number falls when plans are aggregated by state). (2) Using unexpected deficits provides a better measure of fiscal stress to study how state legislators respond to changes in budget constraints. (3) Using the fraction of actuarially required contributions (ARCs) made by a state, or contribution ratio, as the dependent variable means estimates rely on a ‘flow’ variable that is sensitive to actuarial recommendations.Footnote 4 (4) Estimating the cumulative effect of undercontributions on total underfunding provides a stronger link between the ‘flow’ and ‘stock’ perspectives.
2.1 Calculating unexpected deficits
To estimate the impact of fiscal stress on pension contributions, I first calculate unexpected deficit shocks following Poterba (Reference Poterba1994). Unexpected deficit shocks measure the estimated gap between forecasted and actual budgets when adjusting for within-fiscal-year changes to spending (ΔSpend) and tax revenue (ΔTax) resulting from legislation enacted after the initial budget or during the fiscal year, respectively.Footnote 5 This measure of fiscal stress captures the difference between what legislators think the budget will look like and how it actually turns out. This method continues to serve as a workhorse in the literature (e.g., Clemens and Miron, Reference Clemens and Miron2012).
Let DeficitShock it be the per capita unexpected deficit for state i in fiscal year t, where positive deficit shocks are deficits and negative shocks are surpluses. DeficitShock is calculated by subtracting RevenueShock from ExpenditureShock. In years of fiscal stress, positive expenditure shocks and negative revenue shocks both contribute to positive deficit shocks.
 $$ExpenditureShoc{k_{it}} = ActualExpenditur{e_{it}} - ExpectedExpenditur{e_{it}} - {\it \Delta} Spen{d_{it}}.$$
 $$RevenueShoc{k_{it}} = ActualRevenu{e_{it}} - ForecastRevenu{e_{it}} - {\it \Delta} Ta{x_{it}}. $$
 $$DeficitShoc{k_{it}} = ExpenditureShoc{k_{it}} - RevenueShoc{k_{it}}.$$
Deficit shocks are then separated into positive values (unexpected deficits) and negative values (unexpected surpluses). That is, if DeficitShock is positive, then UnexpDeficit equals DeficitShock and zero otherwise. Similarly, if DeficitShock is negative, then UnexpSurplus equals DeficitShock and zero otherwise.
2.2 Modeling pension contribution ratios and expected cuts
Pension contributions are measured by contribution ratios, which divide actual state government contributions by ARCs.Footnote 6 Undercontributions occur when pension contributions are less than ARCs, that is, the contribution ratio is less than 100%. To determine the effect of unexpected deficits on contribution ratios for state i in fiscal year t, I study linear models of the following form:
 $$\eqalign{{ContributionRati}{{o}_{it}} = & {a_0} + {a_1} \bullet {UnexpDefici}{{t}_{it}} + {a_2} \bullet {UnexpSurplu}{{s}_{it}} + {{\bi X}_{it}} \bullet \alpha \cr & + {{\bi A}_i} + {\varepsilon _{it}}.}$$
The coefficient of interest, a 1, is negative if unexpected deficits cause undercontributions, and a 2 is close to zero if unexpected surpluses do not cause extra contributions. Covariates ( X it ) include a number of controls. Lagged total end-of-year balances (which includes ending balances and budget stabilization funds), control for higher expected contribution ratios due to available funds from previous fiscal years. Fractions of workers in a state that are public employees (federal, state, and local) or public union members control for possible pressure to fund pensions with explicit state tax dollars through higher contribution ratios, rather than employee contributions (which are deducted from wages). Lagged funding ratios control for the persistence of contribution ratios.Footnote 7 A tax limitations dummy variable, which is one when raising any state taxes requires a legislative supermajority and zero otherwise, controls for an institution that may cause states to lower contribution ratios due to revenue constraints. State fixed effects ( A i ) control for other persistent state institutions that may affect contribution ratios, such as whether a state constitutionally protects pension benefits.
To estimate expected per capita pension contribution cuts – that is, the counterfactual cut in state contributions if they were cut proportionally with other spending in response to unexpected deficits – I first calculate expected contribution cuts for each year by multiplying a state's per capita budget cuts as a fraction of expenditures by its pension contribution. To estimate a more representative expected value, state contributions (StateContrib i,−t ) come from years other than t, specifically, an average of contributions from years t − 1 and t + 1.
 $${ExpContributionCu}{{t}_{it}} = {BudgetCu}{{t}_{it}}/{ Expenditure}{{s}_{it}} \bullet StateContri{b_{i, - t}}.$$
Expected contribution cuts are then regressed on unexpected deficits and the same controls used in (4), except for lagged funding ratios.
 $$\eqalign{{ExpContributionCu}{{t}_{it}} = & {b_0} + {b_1} \bullet {UnexpDefici}{{t}_{it}} + {b_2} \bullet {UnexpSurplu}{{s}_{it}} + {{\bi X}_{it}} \bullet \beta \cr & + {{\bi B}_i} + {\varepsilon _{it}}.}$$
Next, I convert the units of a 1 to dollars per capita (á 1). If states cut pension contributions more than other spending in response to unexpected deficits then the ratio of á 1 to b 1 will be greater than one.
3 Data
State-sponsored pension data comes from the Public Pension Coordinating Council's PENDAT database for even-numbered fiscal years from 1992 to 2000 and from the Public Fund Survey annually from 2001 to 2009. The Public Fund Survey includes more than 85% of state and local government pension assets and members. Pension plans exclusively for local government, county, or city level employees were removed. Relative to US Census data on state-sponsored pensions, this sample includes nearly all of plan assets in the 1990s and nearly 90% since 2001.Footnote 8 As most states have multiple pension plans and I am interested in the overall state response to pension contributions, state level actuarial funding ratios and contribution ratios were created by weighting plan values by their actuarial liabilities.
US Census data for pensions sponsored by state governments are used for state contributions and investment returns. State contributions were adjusted for funds originating from pension obligation bonds, which create large annual spikes in state contributions. Pension obligation bonds may contaminate the relationship between fiscal stress and state contributions, as they allow states a temporary and potentially risky means of exchanging pension underfunding for state debt. For example, in 2003 Illinois issued $10 billion in pension obligation bonds, of which at least $7.3 billion was contributed to pensions (Barro, Reference Barro2012). Applying this 73% ratio, I remove a fraction of pension obligation bonds from state contributions and adjust contribution ratios accordingly. This only applies to seven bonds totaling about $20 billion between fiscal years 1997 and 2008. In addition, $1.1 billion of tobacco settlement funds contributed to West Virginia pensions in 2007 were removed. The results in this paper are robust to not making these adjustments or dropping these observations.
Public employee and union statistics come from the Union Membership and Coverage Database (Hirsch and Macpherson, Reference Hirsch and Macpherson2010). Tax limitations came from Waisanen (Reference Waisanen2010). State fiscal data comes from various issues of the National Association of State Budget Officers’ (NASBO) Fiscal Survey of the States. Unexpected deficit observations are missing for three observations (TX 2001, MT 2003, and PA 2004). Following Poterba (Reference Poterba1994), Alaska and Massachusetts are dropped because of outlier unexpected deficits.Footnote 9 NASBO does not report data on the District of Columbia, so it is excluded from this study.
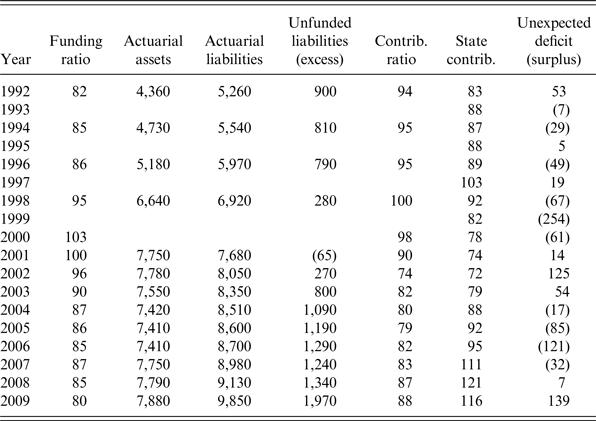
Pension funding status can be calculated either by the funding ratio, calculated by dividing the actuarial assets by liabilities, or the unfunded actuarial accrued liability, calculated by subtracting actuarial liabilities from assets. Note that actuarial asset values are smoothed, often over 5 years. Table 1 shows that the average funding ratio in the sample increased from 82% to 103% between 1992 and 2000, only to fall back to 80% in 2009. Although the funding ratio was at a similar level in 1992 and 2009, unfunded actuarial accrued liabilities grew from $900 to $1,970 per capita as assets did not keep up with a doubling of pension liabilities.Footnote 10 Table 1 also shows large unexpected deficits in the fiscal years immediately following the 1991, 2001, and 2008 recessions and surpluses in the expansionary years of the late 1990s and 2000s.
Summary statistics for included state-administered pension funds

Notes: Values in per capita fiscal year 2010 dollars (CPI-U-RS) for all 50 states and calculated by summing all values and dividing by US population. Pensions are first aggregated at the state level, where actuarial funding ratios and contribution ratios were weighted by the actuarial liabilities of each pension plan. State contributions adjusted as discussed in text and unexpected deficit excludes AK and MA. Assets and liabilities are not shown for 2,000 because of missing plans.
Sources: PENDAT, Public Fund Survey, US Census, NASBO, and author's calculations.
4 Estimating undercontributions caused by unexpected deficits
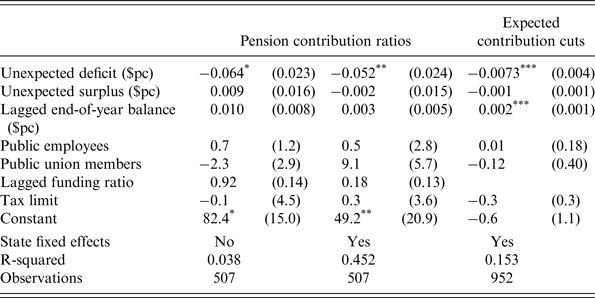
Unexpected deficits cause states to undercontribute to state pensions and unexpected surpluses do not seem to affect contributions. Regressing state contribution ratios on unexpected deficits between 1992 and 2007 results in coefficients for unexpected deficits that are negative and significant (Table 2). The coefficients for unexpected surpluses are near zero and insignificant, suggesting that unexpected surpluses do not lead to overcontribution to pensions.
Pension contribution ratios and expected contribution cuts

Notes: First two columns from equation (4): dependent variable is average state contribution ratio, weighted by each pension's liabilities, from 1992 to 2007 with missing years of 1993, 1995, 1997, and 1999. Third column from equation (6): dependent variable is expected pension contribution cuts from 1989 to 2008. AK and MA dropped for all columns. Linear model with errors clustered by state. $pc values are in per capita fiscal year 2010 dollars (CPI-U-RS). Significance ***p<0.01, **p<0.05, *p<0.10.
Sources: PENDAT, Public Fund Survey, US Census, NASBO, and Union Membership and Coverage Database.
We can interpret the regression coefficients by converting them into dollars of undercontributions per $100 of per capita unexpected deficit. Given a US average contribution ratio of 87% and state contribution of $88 per capita across all years of this sample, a one percentage point decrease in the contribution ratio implies undercontributions of about $1 per capita. So the coefficient of −0.052 (Table 2, second column) implies pension undercontributions of $5.20 per $100 of per capita unexpected deficit. This is seven times the expected contribution cut of $0.73 per $100 of unexpected deficit (Table 2, last column).Footnote 11
4.1 Cumulative effect of undercontributions on underfunding
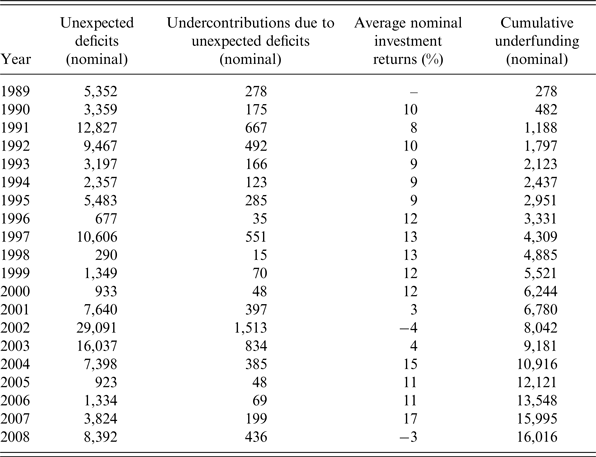
How much pension underfunding has actually occurred due to unexpected deficits? The cumulative unexpected deficit for all states except AK and MA was about $170 billion between 1989 and 2008 (in 2008 dollars); meaning $5.20 of undercontributions per $100 of per capita unexpected deficits implies cumulative underfunding of $9 billion. But if the investments had been made in the past then they would have grown with investments. Using each state's average nominal pension returns on investment, Table 3 shows that unexpected deficits explain $16 billion of underfunding, or 4% of mid-2008 actuarial underfunding.Footnote 12
Estimated cumulative state pension underfunding from positive unexpected deficit undercontributions (millions dollars)

Notes: Annual compounding and assumed $5.20 of undercontributions per $100 of unexpected deficit. US aggregate returns were shown but state specific returns based on US Census data were used in the calculation of cumulative underfunding, where five observations had rates of return top-coded at 30% and three missing values were replaced with average returns. Returns calculated by dividing state investment earnings by previous year assets. Before 2002, US Census reported assets were book values, rather than market, and investment earnings were only realized earnings, suggesting an upward bias to returns. AK and MA excluded.
Sources: PENDAT, Public Fund Survey, US Census, and NASBO.
States may underfund pensions for reasons other than temporary fiscal stress, such as structural issues making it difficult to increase revenues or cut expenditures. Total state undercontributions excluding New Jersey were estimated as in Table 3, where annual undercontributions were estimated with weighted ARCs and state contributions, as reported by the US Census.Footnote 13 ARCs for 1993, 1995, 1997, and 1999 were interpolated, and ARCs for 1989–91 were set to the 1992, 1994, and 1996 average. Note that these assumptions mean this is an imprecise estimate; moreover, this is likely an overestimate, as a fraction of these undercontributions represent amortization of previous undercontributions, causing some double-counting. I estimate total cumulative undercontributions between 1989 and mid-2008 of $125 billion, implying that about a quarter of total underfunding was due to state undercontributions for reasons other than fiscal stress [(125–16)/400 = 0.27].
4.2 Alternative measures of fiscal stress
The measure of fiscal stress used thus far, unexpected deficit shocks, may suffer from a number of flaws. Expected revenues and expenditures may be distorted by state budget officers.Footnote 14 For example, Boylan (Reference Boylan2008) shows that budget forecasts have an upward bias near elections. To control for potential manipulation of forecasts, I estimate how dampened tax revenues affect pension contributions by estimating trend tax shocks as in (2), but replacing the difference between actual and forecasted revenues with quadratic-year actual revenue trend residuals.Footnote 15 This is similar to Sobel and Holcombe (Reference Sobel and Holcombe1996) and Stansel and Mitchell (Reference Stansel and Mitchell2008). The results of regressions using this alternative measure of fiscal stress suggest similar effects on pension contributions. States cut pension contributions over five times more than other spending in response to positive trend tax shocks (i.e., deficits). Following the same procedure shown in Table 3, over the preceding two decades positive trend tax shocks caused $13 billion of underfunding, similar to the underfunding estimated due to unexpected deficits.
Another issue is possible endogeneity of pension contributions in expenditures. I calculate contribution neutral fiscal stress by subtracting actual pension contributions from actual expenditures and 2-year lagged contributions from expected expenditures. This measure of fiscal stress gives an identical result as the fixed effects model in Table 2, with a significant coefficient of −0.052.
4.3 Institutional differences between states
While all states have laws regarding fiduciary standards for state pensions, institutional differences between states may affect pension contributions. According to the United States General Accounting Office (1996, pp. 3–4):
‘…annual contributions to 56% of state and local pension plans are required to be actuarially based; for 40% of these plans, statutes set a specific contribution level, which in most cases is periodically adjusted to achieve actuarial balance, according to a state pension official.’
States with contributions constrained by statute, e.g., a fixed percentage of tax receipts, may undercontribute both because of temporary declines in the tax base or persistently low statutory tax rates.Footnote 16 For example, the statutorily constrained Oklahoma state teachers’ pension had a contribution ratio of only 56% in 2005. The contribution ratio increased to 86% the next year as dedicated sources increased from 4.0 to 4.5% of state tax revenues and 5.0% of lottery proceeds began going to the pension (Oklahoma Office of State Finance, 2010, FY-2011 Executive Budget, Volume 1).
States with contributions not constrained by statute may use their flexibility to undercontribute more in years of fiscal stress. Similarly, states with annual legislatures may undercontribute more in reaction to unexpected deficits because they have more frequent opportunities to respond. To test these two hypotheses, I add interaction terms for statutory constraints (using state status from Munnell et al. Reference Munnell, Haverstick, Aubry and Golub-Sass2008) and annual state legislatures. For states that were either statutorily constrained or had annual state legislatures there were no significant impacts on contribution ratios.
Balanced budget requirements are another institutional difference between states that may affect how they contribute to pensions. As states with stronger balanced budget requirements have less budget flexibility, I expect a negative effect of balanced budget requirements on pension contributions.
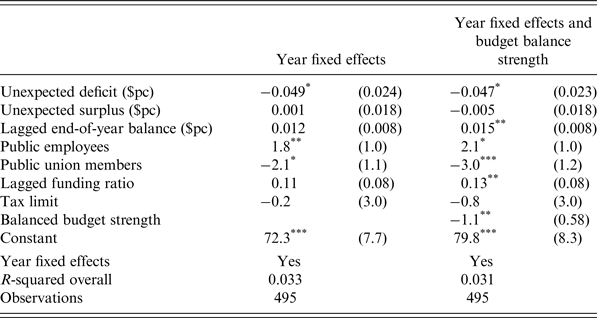
I use an index measuring the strength of budget balance rules from Clemens and Miron (Reference Clemens and Miron2012), which considers if a state's governor must submit or the legislature must pass a balanced budget and limitations on carrying over deficits. A year fixed effects model is used for this analysis because balanced budget requirement measures are constant across the study for each state. The significant coefficient on balanced budget strength is −1.1 (Table A1). This suggests that stronger balanced budget requirements are correlated with pension undercontributions. Specifically, these requirements are correlated with a 10% point drop in contribution ratios among the half of states with the most stringent balanced budget requirements. This translates into almost $1 billion in annual undercontributions nationwide.
Year fixed effects results, shown in Table A1, look similar to the cross-sectional analysis of Mitchell and Smith (Reference Mitchell and Smith1994), who also found a persistence of funding behavior and that higher unionization of covered employees led to less state contributions. They suggest that this counterintuitive negative effect of unions may be ‘due to the upward pressure on salaries associated with collective bargaining, to which employers respond by reducing pension contributions.’ (p. 286) Note that the negative effect of unions on pension contribution ratios is more than offset by the positive effect of public employees, which is three times larger on average.
4.4 Robustness checks
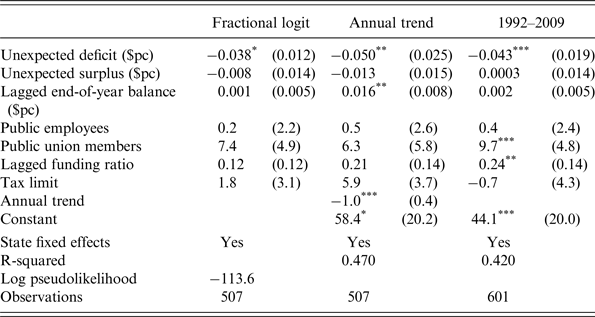
A number of alternative models demonstrate the robustness of the regression results. As states pay their full ARC in two-thirds of fiscal years, this bunching of contribution ratios at 100% may lead to non-linear effects. A fractional logit model gives similar results. The average marginal effect for unexpected deficits is −0.038 and significant, while the coefficient for unexpected surpluses is near zero and insignificant (Table 4, column 1).
Robustness checks: unexpected deficits and state pension contribution ratios

Notes: The dependent variable is the annual state contribution ratio, weighted by each pension's liabilities. For the fractional logit and annual trend models, the years in sample are 1992–2007, where missing years are 1993, 1995, 1997, 1999. AK and MA dropped. Linear models used for annual trend and 1992–2009. For fractional logit model, contribution ratios are divided by a hundred and topcoded so that they range between zero and one, and average marginal effects times a hundred are reported. Contribution ratio adjustments are described in the text. Errors clustered by state. $pc values are in per capita fiscal year 2010 dollars (CPI-U-RS).
Significance ***p<0.01, **p<0.05, *p<0.10.
Sources: PENDAT, Public Fund Survey, US Census, NASBO, and Union Membership and Coverage Database.
Contribution ratios tend to decline over the sample. To control for this, I add an annual trend that grows from 0 to 15 between 1992 and 2007. The coefficient on unexpected deficits (−0.050) is similar and the negative coefficient on the decade dummy suggests that all else equal, states lowered their contribution ratios about one percentage point each year over the sample. The fractional logit coefficient is unchanged when adding the annual trend.
So far, this study has only considered pension contributions through fiscal year 2007. Extending the data through 2009 attenuates the effect of unexpected deficits, with a coefficient for unexpected deficits of −0.043. The Recovery and Reinvestment Act of 2009 significantly boosted state government inflows, perhaps temporarily breaking the link between estimated unexpected deficits and true fiscal stress. Referring to the end of state fiscal year 2009, Cauchon (Reference Cauchon2009) writes that the ‘flood of federal money lifted total revenues by 7.5%, overcoming an 8% drop in tax collections.’
5 Causes of public pension underfunding
This study helps answer questions about the causes of public pension underfunding, specifically, the impact of fiscal stress. As legislators become aware of fiscal stress during the legislative session, they can adopt policies to undercontribute to pensions before the end of the fiscal year. I estimate that pension undercontributions due to fiscal stress explain $16 billion of underfunding, or 4% of mid-2008 actuarial underfunding. Total state undercontributions – due to fiscal stress or not – explain only a third of underfunding ($125 of $400 billion). So what caused the remaining unfunded liabilities?
Underfunding may also be caused by insufficient inflows from investment returns or local government contributions. Annual investment returns do not seem to explain a significant amount of pension underfunding. Giertz and Papke (Reference Giertz and Papke2007) report that between 1989 and 2006 cumulative state and local pension returns were well above the average assumed return of 8%. Meanwhile, inflation over this period was below the standard 3% assumption. The National Association of Retirement Administrators (2012) shows that between 1986 and 2011 – which includes the recent market downturn – aggregate investment returns were 8.3%.
The majority of local government employees also participate in state-run pensions (Clark et al. Reference Clark, Craig and Sabelhaus2011), and so some underfunding may be explained by local government contributions. However, local contributions to these multiple-employer systems should be less sensitive to fiscal stress than state contributions.Footnote 17
A fraction of current underfunding may also be due to previous underfunding that originated before the two decade window considered in this study, although most of this underfunding should have been amortized into subsequent required contributions. Finally, underfunding may be due in part to the gap between increasing actuarial liabilities, which doubled over the last two decades (Table 1), and insufficient inflows from employee contributions and ARC levels.
5.1 Growing liabilities and recent reforms
Liabilities have grown in part because of increasingly generous benefits. New promises often slowly accrue as actuarial liabilities over many years. If these liabilities are in excess of pension assets then this underfunding is amortized, usually over 30 years. This means increases in pension benefits can appear and persist as underfunding long after new promises are made. Johnson (Reference Johnson1997) finds that state and local pensions take advantage of this temptation, as pensions more able to shift costs to future taxpayers through underfunding are more likely to increase the relative generosity of promised benefits.
Increased benefits may be catalyzed by the cyclicality of investment returns. Instead of smoothing out returns over the long-run, temporary pension surpluses may be dispersed to public employees through reduced employee contributions or increased benefits (Peskin, Reference Peskin, Mitchell and Hustead2001; Bader and Gold, Reference Bader and Gold2007). This can lead to a ratchet effect, where during economic expansions states make benefits more generous, but during downturns these benefits persist and eventually lead to underfunded pensions.
Pension liabilities have also increased with changing actuarial assumptions. For example, Rhode Island recently changed its actuarial assumptions to reflect workers retiring earlier and living longer, resulting in an increase of $50 million in liabilities. But Rhode Island is one of many states trying to limit the growth of liabilities with a number of reforms: making workers wait until age 62 to collect benefits, reducing the maximum pension to 75% of average pay near retirement, and limiting annual cost-of-living adjustments (COLAs) for new retirees (Gregg, Reference Gregg2011). Snell (Reference Snell2012) gives many examples of recent reforms tightening eligibility conditions and reducing benefits. However, Novy-Marx and Rauh (Reference Novy-Marx and Rauh2011a ) estimate that even implementing extreme versions of some of these policy changes, such as the complete elimination of COLAs, would only eliminate half of the underfunding they estimate with Treasury discounting. Underfunding can also be addressed by raising employee contributions, which half of states have done since 2008 (U.S. Government Accountability Office, 2012).
6 Conclusion
Fiscal stress pressures legislators to either raise taxes or cut spending, but state pensions provide a vehicle to postpone tax increases and maintain current spending. This process works like a rainy day fund in reverse – instead of first accumulating reserves to deal with fiscal stress, state governments ‘go in the red’ by undercontributing to pensions and presumably make up the difference in the future.
Public pension underfunding results from many factors. This study shows that over the past two decades state undercontributions due to unexpected deficits explain only 4% of unfunded liabilities as of mid-2008, and state undercontributions for other reasons explain an additional quarter. Meanwhile, aggregate investment returns have actually been in excess of assumed returns. Thus a significant source of pension underfunding was an increase in liabilities that was not matched by sufficient employee or required government contributions.
Appendix
Per Capita State Pension Inflows by Source (2010 dollars). Notes: All inflows for state-administered pension plans divided by US population. Fiscal year data are shown. Employee contributions smoothed in 1973 for CA and state contributions were adjusted for pension obligation bonds and a contribution by WV in 2007, see text for details. Fiscal year 2010 dollars (CPI-U).

Year fixed effects: unexpected deficits and state pension contribution ratios

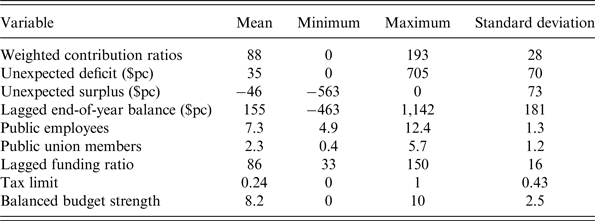
Data summary: 1992–2009