INTRODUCTION
Conservationists are reassessing the rationales and outcomes of conventional approaches to conserving biodiversity. Since the 1800s, the USA and much of the world has focused on large-scale government land acquisition as a means to prevent land conversion and protect natural resources for the national good (Merenlender et al. Reference Merenlender, Huntsinger, Guthey and Fairfax2004). Protected areas remain the most commonly used tool for in situ conservation (Reyers et al. Reference Reyers, Polasky, Tallis, Mooney and Larigauderie2012) and currently cover 12% of the global land surface (Chape et al. Reference Chape, Harrison, Spalding and Lysenko2005). Even so, growth in protected areas and protective management policies has not slowed the rate of global biodiversity loss (Butchart et al. Reference Butchart, Walpole, Collen, van Strien, Scharlemann, Almond, Baillie, Bomhard, Brown and Bruno2010).
Many of the large protected areas in the USA were designed and acquired with little regard for protecting biodiversity, imperilled species or critical ecosystem services (ESs). About 95% of imperilled species habitat in the USA occurs on private land (Turner et al. Reference Turner, Wilcove and Swain2006) and most ecosystem types do not occur on public protected areas (PPAs, such as national and state parks and forests) (Scott et al. Reference Scott, Davis, McGhie, Wright, Turner and Estes2001). However, PPAs protect land from conversion and most highly degrading uses, and they therefore also protect a suite of ESs that potentially convey great benefit to society. These benefits vary in scale from local services, like surface water regulation, to global services, like carbon sequestration and climate regulation. For example, the United States (US) National Forest system is thought to generate 14% of the USA's clean water, valued at US$ 3.7 billion per year (Dissmeyer Reference Dissmeyer2000). Likewise, at least US$ 26.9 billion worth of ESs are generated annually within the US National Wildlife Refuge system (Ingraham & Foster Reference Ingraham and Foster2008). A fuller understanding of the magnitude, scale and beneficiaries of these ESs can help bolster public support to maintain existing PPAs and acquire new ones, which, in turn, will contribute further to biodiversity conservation.
Growth in the USA's system of public lands has stagnated since 1970, despite substantial growth at the global scale (USGS [US Geological Survey] 2012). The lack of PPA growth in the USA may be attributed to greater focus on regulatory conservation strategies, such as the Clean Water Act and Endangered Species Act, non-environmental spending priorities, including extensive military and diplomatic involvement overseas, and expanding residential development, especially in the south-eastern USA For example, national forests in Virginia and North Carolina are expected to experience residential development on 10–42% of adjacent private lands over the next 30 years (Stein et al. Reference Stein, Alig, White, Comas, Carr, Eley, Elverum, O’Donnell, Theobald, Cordell, Haber and Beauvais2007). Further, the downgrading, downsizing and degazetting of protected areas is becoming an increasing concern in some areas (Mascia & Pailler Reference Mascia and Pailler2011), which may have residual effects on ESs and human well-being.
Given such trends, conservationists increasingly recognize that the approach to conservation planning may require a shift. Proposed changes include rather extreme measures, such as degazetting conservation areas that are found to be ineffective and replacing them with areas of greater cost effectiveness (Fuller et al. Reference Fuller, McDonald-Madden, Wilson, Carwardine, Grantham, Watson, Klein, Green and Possingham2010), and more subtle enhancements to the network by increasing private land conservation. Conservation easements on private lands are a common and growing land management tool in the USA, as well as in the UK (Jackson & Gaston Reference Jackson and Gaston2008), Colombia (for example civil society private reserves; Bonnells Reference Bonnells2012), Australia (Figgis Reference Figgis2004; Gordon et al. Reference Gordon, Langford, White, Todd and Bastin2011), South Africa (Von Hase et al. Reference Von Hase, Rouget and Cowling2010), and Costa Rica (Langholz & Lassoie Reference Langholz and Lassoie2001). Compared to PPAs, easements are distinctive in spatial distribution, parcel size, purpose, and function. Since 1990, the area of easements in the USA has grown from 202 342 ha to > 12 million ha (NCED [National Conservation Easement Database] 2013). For many landowners in the USA, the impetus to establish easements in the USA is typically to protect personal landowner values rather than to conserve biodiversity or public benefits. Nevertheless, easements have great potential to provide a range of benefits for people other than the landowners, especially in areas where PPAs do not exist or are impractical to develop. To date, it is largely unknown whether conservation easements, which are typically smaller and more diffuse, maintain ES capacities (per unit area) equivalent to PPAs.
To compare ES capacity between PPAs and conservation easements and evaluate the potential for conservation easements to provide ES protection, we evaluated the service capacity of federal and state protected areas and conservation easements in the mid-Atlantic and south-eastern USA. Herein, we define capacity as the ability of the landscape to provide an ES. This is considered the maximum potential ES that could be provided, rather than a measure of the flow of the service, which varies with societal demand and ecological pressure (Villamagna et al. Reference Villamagna, Angermeier and Bennett2013 a). Using spatially-explicit ES models and publicly available data on land conservation, we mapped and compared capacity measures of seven ESs. We focused on a diverse suite of local, regional and global services: surface water regulation, groundwater protection, (surface) water quality regulation, erosion control, recreational fishing, carbon storage, and biodiversity support. This assessment will provide a current assessment of ES conservation in the south-east USA and help identify areas of future conservation investment.
METHODS
Study region
We focused our comparison of ES capacity in public and private conservation areas within the mid-Atlantic and south-east USA, namely Virginia (VA) and North Carolina (NC). This region, which includes four ecoregions (namely the Mid-Atlantic Coastal Plain, South-eastern Plains, Piedmont, and Blue Ridge Mountains) (Griffith et al. Reference Griffith, Stehman and Loveland2007), provides a relevant current synopsis of public and private conservation within the USA, where private land development is increasing adjacent to public lands and where public land acquisition has slowed. Although the spatially-explicit models we use to quantify ESs are highly transferable across landscapes because they use nationally available public data, they were initially developed for use in the Albemarle-Pamlico Basin which, being located within the same region, comprises the same diversity of geophysical and biological features.
Mapping conservation areas
Conservation easement boundaries were derived from the National Conservation Easement Database which contains records of more than 95 000 easements covering more than 7 million ha (18 million acres) in the USA (NCED 2013). The database provides information regarding the holders of the easement, the landowner type, the purpose of the easement, and the location. We constrained our study to only include easements with the stated purpose of: environmental systems, recreation and education, open space forest, and open space farm and with gap status code (namely a measure of the management intent for the long-term protection of biodiversity) of status 1 (permanent protection from land conversion and maintenance of a natural disturbance regime), status 2 (protected from land conversion, but allows uses or management practices that may ‘degrade the quality of existing natural communities, including suppression of natural disturbance’), and those with unknown status (USGS [US Geological Survey] 2012). We excluded easements with historical preservation, unknown purpose and those preserving open space without specifying forest or farm. The remaining 230 easements are held by non-governmental organizations (NGOs), and state and federal government agencies.
We used geospatial boundary data for state and federal lands provided by the USGS National Inventory Protected Areas Database of the US (PADUS; USGS 2012). This database provides extensive information about each protected area, including land owner, management type, the purpose, and gap status. To focus on lands with an environmental conservation purpose, we restricted our analysis to state and federal lands with a gap status classification code of 1 or 2. We excluded federal land holdings that were classified as memorial parkways, national battlefields, national monuments, and several other classes that did support environmental conservation. Easements managed by state and federal agencies were excluded to avoid overlap with NCED records.
Capacity
We used geospatial models to quantify the mean capacity of seven ES for each conservation easement and federal and state PPA in NC and VA. Geospatial capacity models were initially developed for ES analyses in the Albemarle-Pamlico basin (Villamagna & Angermeier Reference Villamagna, Angermeier, Chicara, Mueller and Fohrer2015), which flows from central and south-west VA to the eastern shore of NC.
Surface water regulation includes the hydrologic and biological processes that prevent precipitation from becoming surface run-off. These processes include interception, infiltration and uptake. The surface water run-off algorithm published by the US Department of Agriculture Natural Resources Conservation Service (NRCS 1972) estimates expected run-off based on precipitation and a curve number that integrates the soil's hydrologic group classification and land cover. We developed and applied a geographic information system (GIS) model that integrated these factors using the curve number approach to map and summarize daily surface water run-off from each conservation area (see supplementary material, Table S1). Since surface water regulation implies the abatement of run-off, we calculated the standardized inverse of summary run-off values for each conservation area so that values closer to 1 suggest greater regulating capacity.
To evaluate groundwater protection, we developed a GIS model that calculates the mean New York nitrate leaching index (Czymmek et al. Reference Czymmek, Ketterings, van Es and DeGloria2003) for each conservation area (see supplementary material, Table S1). The leaching index integrates soil hydrological group classification and monthly precipitation amounts to calculate a percolation and seasonality index. Given a consistent soil type, areas with less rainfall in winter, when evapotranspiration is low, have a lower probability of leaching nitrate to groundwater. These areas are considered to have a high groundwater protection capacity. Like the surface water regulation service, we calculated the standardized inverse of the leaching index for each conservation area, in which values closer to 1 suggest greater regulating capacity.
Riparian filtration was evaluated using a GIS model we developed to assign the land cover-based per cent effectiveness values of Mayer (Reference Mayer, Reynolds, McCutchen and Canfield2007) to land cover parcels within the riparian area of all surface waters. Land cover-based per cent effectiveness values range from 0 for barren land and cropland to 85 for woody wetlands. Conservation areas that lacked surface waters were not included in the riparian filtration assessment. Thus, the riparian filtration comparison was based on a subset of conservation areas that contained or were immediately adjacent to surface water features, including 263 state PPAs, 351 federal PPAs, and 71 private conservation easements.
Mapping erosion control required the development of an intricate model based on the principles and equations of the NRCS revised universal soil loss equation (NRCS 2003) and Lim et al. (Reference Lim, Sagong, Engel, Tang, Choi and Kim2005). This equation was designed to integrate five key factors that influence soil loss: soil erodibility, rainfall erosivity, the slope angle and length, land cover, and management practices to keep soil on site (see supplementary material, Table S1). We evaluated the likelihood that erosion would occur by assuming all conservation areas practised the same erosion best-management practices (such as silt fences). Erosion control was measured by calculating the standardized inverse of estimated total soil loss (t ha−1 yr−1).
We used predictive measures of soil organic carbon (SOC) and above and below ground carbon (biomass) to calculate total carbon storage per hectare. Land cover-based SOC values were derived from the NRCS Rapid Assessment of US Soil Carbon (West et al. Reference West, Wills and Loecke2013). The SOC values in this report are categorized by major land resource areas (MLRAs). Therefore, we developed a model that assigned SOC values to specific land cover classes within each MLRA according to the NRCS report. Forest carbon stocks of the contiguous USA in Wilson et al. (Reference Wilson, Woodall and Griffith2013) provided estimates for above ground and below ground carbon storage capacity within the woody biomass of forests through the contiguous USA. We summed these stocks and multiplied values by the area of each conservation area to produce a total carbon estimate for each conservation area in tonnes (t). However, we must again acknowledge the carbon storage and sequestrations are different metrics. Although carbon sequestration is the active measure of carbon uptake from the atmosphere, protecting areas of high storage may be of equal or greater importance to climate regulation.
Biodiversity support included the predicted species richness of birds, amphibians, reptiles, and mammals throughout NC and VA. This data was derived from the NC and VA Gap Analysis Projects and included mammalian, reptilian, amphibian, and avian diversity (USGS 2013). Species richness was summarized for all taxa and the maximum species richness value within a given conservation area was chosen as the biodiversity support capacity value.
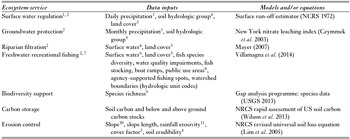
Freshwater recreational fishing capacity was assigned to each conservation area based on the results from a previously conducted assessment at the 12-digit hydrologic unit-scale for all of NC and VA (Villamagna et al. Reference Villamagna, Mogollon and Angermeier2014) within which capacity was calculated using a multi-indicator framework that included biophysical (such as water availability) and social factors known to contribute to the fishing experience (for example boat ramps). The freshwater recreation fishing index ranges from 0 to 1 and the values assigned to PPAs and easements represent a weighted average based on the value assigned at the 12-digit hydrologic unit watershed scale. We used the data (Table 1) to map ES capacity throughout the region.
Summary of data inputs, models, and equations used to generate ecosystem service capacity maps for Virginia and North Carolina, USA. 1Surface water regulation is inferred from taking the inverse of surface water run-off; 2according to Villamagna and Angermeier (Reference Villamagna, Angermeier, Chicara, Mueller and Fohrer2015); 3calculated from 30-year normal monthly precipitation (30 m) (PRISM Climate Group 2010); 4data provided by SSURGO (30 m) (Soil Survey Staff 2010); 5US national land cover dataset (30 m) (Fry et al. Reference Fry, Xian, Jin, Dewitz, Homer, Yang, Barnes, Herold and Wickham2011); 6US national hydrography dataset (NHD) flowline and waterbody (USDA et al. 2010); 7according to Villamagna et al. (Reference Villamagna, Mogollon and Angermeier2014); 8USGS national inventory protected areas database of the US (USGS 2012); 9USGS (2013) Gap analysis programme species data (30 m) (USGS 2013);10USGS national elevation dataset (30 m) (Gesh et al. Reference Gesch and Maune2007); 11revised universal soil loss equation 1.06: bulletins (USDA Agriculture Research Service 2007).

We summarized capacity for each conservation area by calculating: (1) the area-weighted mean of index-based metrics (groundwater protection and freshwater recreational fishing), (2) percentage-based metrics (riparian filtration), and (3) model-derived metrics (surface water regulation, biodiversity support, erosion control, and carbon storage). For services in which the capacity metric reflects the composite of several data factors with different units of measure (such as freshwater recreation fishing) and for regulating services (groundwater protection, surface water regulation, and erosion control) for which we infer regulation from the inverse of leaching, surface run-off, and erosion estimates (for example soil loss derived from the revised universal soil loss equation is the inverse of erosion control), we standardized capacity metrics to range from 0 for the lowest relative capacity observed for all conservation areas to 1 for the highest relative capacity. The unstandardized statistical summaries for surface water run-off, ground water leaching, and soil loss and the equation used to standardize these values is provided in online supplementary material. We quantified the capacity for each conservation area, calculated a composite metric of all seven ESs by averaging the standardized values, and compared mean ES capacity among conservation area types (federal PPA, state PPA, and easement), owner/holder (for example the US Forest Service), and gap status (1, 2, and unknown) using Kruskal–Wallis analysis of variance and Wilcoxon signed rank tests, both non-parametric approaches since the ES capacity datasets did not meet parametric assumptions. Where a significant difference was detected, we compared means using the Wilcoxon test of pairs.
RESULTS
Geographic scope and size of conservation areas
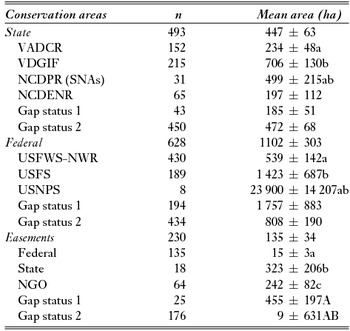
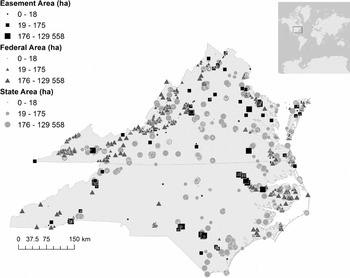
Federal (n = 628) and state protected areas (n = 493) with a gap status of 1 or 2 were, on average, significantly larger in area than conservation easements (n = 230; p < 0.0001). We found federal PPAs with gap status of 1 or 2 covered 692 925 ha (1 712 256 acres), state protected PPAs covered 220 714 ha (545 397 acres), and easements covered 31 219 ha (77 144 acres) throughout the study region. There were ten-fold more conservation areas with a gap status of 2 than gap status of 1 at the state level, more than two-fold at the federal level, and seven-fold for easements (Table 2). The majority of federal PPAs were located in the Ridge and Valley, Blue Ridge Mountains, and Coastal Plain ecoregions. State protected areas were widely distributed throughout VA, with larger parcels in Ridge and Valley, Blue Ridge Mountains, and Coastal Plain ecoregions, but were less common in NC. Conservation easements were much smaller, but evenly dispersed throughout VA (Fig. 1). There were fewer easements that met our study criteria in NC than VA, but they were substantially larger and generally located in the mountainous west and coastal plain. Conservation areas were largely absent near the large population centres of Winston-Salem, Greensboro, eastern Durham, Raleigh, Greenville, and Rocky Mount in NC and Richmond in VA.
Mean area (ha) ± standard error and the sample size (n) for all conservation areas within the study area of North Carolina and Virginia, USA. Federal and state public protected areas were significantly larger than private conservation easements (p < 0.0001). Conservation areas with the same superscript letter following the mean and standard error values are not significantly different. Significant differences among conservation area owners-holders are noted with a lower case letter and a capital letter for differences between gap status 1 and 2. Owners/holders of conservation areas are: Virginia Department of Conservation and Recreation (VADCR), Virginia Department of Game and Inland Fisheries (VDGIF), North Carolina Division of Parks and Recreation (NCDPR), US Fish and Wildlife Service National Wildlife Refuges (USFWS-NWR), US Fish and Wildlife Service (USFWS), US National Park Service (USNPS), and non-governmental organization (NGO). SNA = state natural area.

Location and size of conservation easements, and federal and state protected areas (PPAs) that have a gap status of 1, 2, or unknown (easements only) in North Carolina and Virginia. Bubble size corresponds to the relative area of the conservation area measured in hectares.

Ecosystem service capacities
Surface water regulation
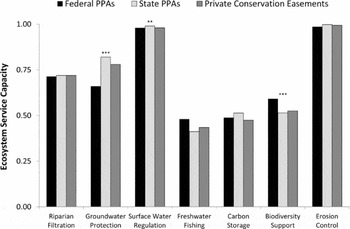
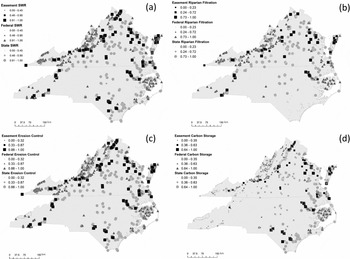
State and federal PPAs offered significantly greater surface water regulation than conservation easements (Fig. 2). Surface water regulation did not differ significantly among state lands, but regulation was significantly greater on US National Park Service (USNPS) and US Forest Service (USFS) lands than on US Fish and Wildlife Service (USFWS) managed National Wildlife Refuges (NWRs), although mean capacity was very high for all. Federally-held easements offered the least surface water regulation; about six times more run-off was expected than from state or NGO-held easements. Surface water regulation was significantly greater on easements with gap status of 1, but no other significant difference was detected among the state or federal protected areas considered (Table 3). Geographically, federal PPAs provide the greatest opportunity to regulate run-off in the mountain west, arguably the most important area since these headwaters contribute to all freshwater systems downstream. There is a paucity of gap status 1 or 2 conservation areas in west-central NC (Fig. 1). Although surface water regulation is relatively high throughout the region, pockets of low capacity can be found in and near urban areas where greater impervious surface area contributes to excessive run-off (Fig. 3 a).
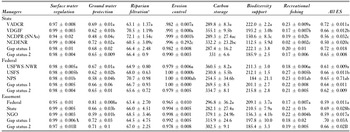
Statistical summary of mean (± standard error) ecosystem service (ES) capacities of conservation areas within North Carolina and Virginia. Riparian filtration, carbon storage, and biodiversity support are reported as absolute values, freshwater recreational fishing, ground water protection, surface water regulation, erosion control are standardized to range from 0 for lowest relative capacity to 1 for highest relative capacity. Statistically significant differences among conservation area owners-holders are noted with a lower case letter and a capital letter for differences between gap status 1 and 2. Owners/holders of conservation areas are: Virginia Department of Conservation and Recreation (VADCR), Virginia Department of Game and Inland Fisheries (VDGIF), North Carolina Division of Parks and Recreation (NCDPR), US Fish and Wildlife Service National Wildlife Refuges (USFWS-NWR), US Fish and Wildlife Service (USFWS), US National Park Service (USNPS), and non-governmental organization (NGO). SNA = state natural area.

Mean (± standard error) ecosystem service capacities among public (federal and state) and private conservation lands (easements). Statistical significance noted directly above each comparison: ***p < 0.0001, **p < 0.01, and *p < 0.05.

Location and relative capacity for (a) surface water regulation (SWR), (b) riparian filtration, (c) erosion control, and (d) carbon storage among conservation easements, federal protected areas, and state protected areas.

Groundwater quality protection
In general, all conservation areas in the study offered low groundwater protection capacity (Fig. 2), meaning there was high potential for nitrate leaching below the root zone (nitrogen leaching index values >10; Czymmek et al. Reference Czymmek, Ketterings, van Es and DeGloria2003). Groundwater protection capacity was significantly less within federal PPAs than other conservation areas (p < 0.0001; Fig. 2); with USNPS lands having the lowest mean capacity. At the state-level, the VA Department of Conservation and Recreation (VADCR), NC Department of Environment and Natural Resources (NCDENR), and some NC Department of Parks and Recreation (NCDPR) lands had the highest capacity for groundwater protection; however, state natural areas (SNAs) managed by NCDPR had the lowest capacity. There was no significant difference in groundwater quality protection capacity between gap statuses (Table 3). In addition to the lack of conservation areas in the aforementioned Catawba and Yadkin-PeeDee basins of west–central NC, state PPAs generally have greater groundwater protection capacity throughout the study region. In contrast, the geographic clumping of federal PPAs and easements reduces the extent of their service benefits. Within federal conservation areas there was a wide range in groundwater protection capacity, but hotspots of low capacity were detected in the western mountains of VA and NC, as well as along the Atlantic coast.
Riparian filtration
Among conservation areas with water features, federal, state PPAs and easements had significantly greater mean riparian filtration capacities than federal PPAs (p < 0.0001). Riparian filtration capacity was significantly different among state-owned properties; however, there was no difference among federal lands or easements and there was no significant difference in riparian filtration capacity between gap statuses for any of the conservation area types. Mean filtration capacity for all conservation areas was around 66% (Table 3). This means that, on average, about 34% of the nutrients and sediment flowing into the riparian corridor is loaded into surface waters. The map of riparian filtration (Fig. 3 b) suggests that there are many state PPAs and easements, particularly in the coastal plain of NC, that could greatly enhance their riparian filtration capacity. It should also be noted that only 51% of all conservation areas in the study contained or were immediately adjacent to surface water features. Overall, this suggests that existing conservation areas could increase their riparian capacity to enhance water quality protection and riparian filtration could be a priority for future conservation area development.
Erosion control
Several data sources were needed to estimate soil loss and some of these were not available for all conservation areas in the study. Missing data were largely attributed to areas not covered by the most current US Soil Survey Geographic Database (SSURGO) data, including some barrier islands and aquatic-dominated conservation areas. Only 2% of easements, 6% of federal PPAs, and 7% of state PPAs evaluated (97% of conservation areas in the study has sufficient data to assess soil loss) were expected to fully control erosion. Expected erosion control did not differ among conservation area types, nor did it differ among easement holders. Within the states of NC and VA, NCDPR SNAs and NCDENR lands have a significantly higher capacity to retain soil and prevent erosion. USFS lands have the highest capacity to prevent erosion and there was no difference between USFWS NWRs and USNPS lands. Erosion control was significantly greater in federal PPAs and easements with a gap status of 1 than in status 2 lands, but no difference was detected at the state-level (Table 3). We did not detect a clear geographic pattern in erosion control capacity within or among conservation area types (Fig. 3c )
Carbon storage
The data sources used did not provide carbon storage data for all of the conservation areas in NC and VA. Most of the conservation areas for which data were not available for all three data sources were located on barrier islands along the Atlantic coast. More than 100 federal conservation areas lacked carbon data, but only 19 state PPAs and one easement were excluded from the analysis due to insufficient data. Among the conservation areas for which data were available, state PPAs store significantly more carbon than federal PPAs or easements. Within state lands, the VA Department of Game and Inland Fisheries (VADGIF) and NCDENR lands stored the greatest carbon, and VA Department of Conservation and Recreation (VADCR) and NC Divisions of Parks and Recreation (NCDPR) lands in NC and VA stored the least. Surprisingly, USFWS NWRs stored significantly more carbon (329.1 ± 7.7 tC ha−1) than USFS lands attributed with greater soil carbon storage (158.7 ± 5.3 tC ha−1). Soil carbon comprised 91% of total carbon found on USFWS NWRs and 68% of that on USFS lands. Soil carbon storage was substantially higher in wetlands than forests throughout most of NC and VA (West et al. Reference West, Wills and Loecke2013). Also, NGO-held easements stored significantly more carbon per hectare than federal or state PPAs. Higher gap status did not positively affect carbon storage within any of the conservation area types (Table 3). Carbon storage capacity varied the most geographically among all the focal ESs (Fig. 3d ). It was relatively low in the mountainous west compared to much greater storage in the coastal plain. This acute disparity is largely attributed to much greater soil carbon storage in coastal wetlands.
Biodiversity support
Data from the NC and VA (terrestrial) gap analysis did not provide sufficient data for 28 federal PPAs, four state PPAs, and 11 easements. This is likely due to the location of conservation areas on barrier islands and conservation areas that included mostly aquatic ecosystems. Total species richness was significantly greater in federal PPAs, but there was no difference between state PPAs and easements. The USFWS NWRs and USFS lands were home to significantly more species than USNPS lands. At the state level, VADCR and NCDPR lands contained more species than other types. Species richness on easements was similar to state lands, but within easements federal and state PPAs were home to more species. Species richness was only significantly higher in gap status 1 lands at the state level (Table 3). Overall, biodiversity support differed by taxa and was greatest in the mountainous west and coastal plain. There was substantial geographic variation in biodiversity support capacity across the study region. Greater species richness was supported in the mountains of VA, attributable to the size of federal conservation areas (Table 2, Fig. 1). State PPAs throughout the region maintained relatively high support for biodiversity.
Freshwater recreational fishing
Mean freshwater recreational fishing capacity among conservation areas was low, but significantly higher on federal PPAs (p < 0.0001). Among federal PPAs, USFS lands had the highest capacity. At the state-level, VADCR and some NCDPR properties were within 12-digit watersheds with the highest capacity, significantly higher than VADGIF lands and NCDPR SNAs (p < 0.001). We did not detect a statistically significant difference in FRF capacity between gap statuses for any conservation areas considered, nor did we find a clear geographic pattern (Table 3).
All ecosystem service capacities
At the state level, VADCR PPAs (VA state parks and state natural area preserves) had significantly higher ES capacity than all other state-managed lands. North Carolina state parks were excluded from the analysis based on their gap status rating of 3. NCDENR coastal reserves and NCDPR special natural areas contained the lowest overall ES capacity. Although this may be partially expected because the ES we quantified were less common to coastal areas, it is surprising for the NCDPR SNAs, which are considered to represent some of NC's great diversity of resources and fragile ecological systems (NCDPR 2014). These same lands protected significantly less species richness than other state systems.
Although total ES capacity was significantly greater on USFS lands compared to USFWS NWRs, the magnitude of these differences was not substantial and total ES capacity on all federal lands was less than we found associated with VA state parks and natural area preserves (Table 3). The total ES capacity was significantly greater within easements managed by the states than those by the federal government or NGOs. This corroborates the aforementioned pattern in which total ES capacity was significantly greater within state PPAs than federal PPAs or private easements. The geography of ESs within all conservation areas suggests that VA is protecting a greater extent of land and that these lands are of greater ES capacity then their NC counterparts. In stark contrast to the overlap of high ES capacity conservation areas in VA, conservation areas in coastal and western NC did not appear to maintain high ES capacity. Also, federal PPAs of high capacity were often adjacent to low capacity PPAs.
DISCUSSION
Do conservation easements protect ES as much as PPAs?
Overall, we found that ecosystem service capacity in easements was equal to or greater than capacity within state or federal protected areas for six out of the seven services assessed. On average, conservation easements housed greater focal ES capacity (Table 3); ES capacity was only significantly greater in both state and federal PPAs for surface water regulation. Therefore, we suggest that private land protection is enhancing the regional conservation of ESs and improving the environmental quality in areas where public PPAs cannot. Given that easements are on average significantly smaller than state or federal PPAs, the number of easements needed to conserve the same amount of services as a larger PPA may be higher. With the exception of biodiversity support, which has been shown to have a positive relationship with contiguous area (Rosenzweig Reference Rosenzweig1995), the protection of most of the ESs we evaluated could be achieved through a conservation mosaic approach in which smaller parcels of protected land provide the same amount of an ES per unit area. Moreover, new easements with high erosion control capacity could be sought in and upstream of areas of high biodiversity and high freshwater recreational fishing capacity. Likewise, creating easements that focus on enhancing riparian filtration and erosion control downstream of high surface water run-off areas (such as urban and suburban areas) can help minimize the negative impacts of run-off on biodiversity. At the same time, easements that enhance vegetation to increase erosion control and riparian filtration will likely increase carbon storage potential. With these potential approaches in mind, we believe that ES conservation can be enhanced through private land conservation in NC and VA.
Enhancing ES on conservation areas
This assessment evaluated differences in the existing capacity to provide ESs among conservation area types; by doing so we can identify groups of conservation areas that could potentially enhance ES protection if and where demand and management objectives aligned. Many of the ESs assessed in this analysis could be enhanced through increased management efforts where appropriate. For example, based on the results of this assessment, state protected properties by agencies like NCDENR, VADCR and NCDPR and federally-held easements could fund riparian restoration projects to enhance riparian filtration. The results of this assessment provide valuable information to land managers that may be used in conjunction with knowledge of management objectives, societal demand, cost effectiveness, as well as other sociopolitical trade-offs and synergies, in order to prioritize funding for ES enhancement. It is important to recognize that it may not be possible to enhance all ES; there may be internal trade-offs. For example, enhancing freshwater recreational fishing capacity with an increase in accessibility (for example boat ramps) may decrease a conservation area's ability to regulate surface water. Likewise, stocking non-native game fish may reduce native biodiversity support. Thus, we highly recommend that the results of this and future assessments be considered in conjunction with an evaluation of potential trade-offs, synergies, ES demand, and conservation budgets.
Conservation easements in NC and VA protect lands with a higher overall ES capacity than PPAs. Thus, increasing ES protection through private land conservation is an important step towards protecting ecological resilience and human well-being throughout the region. We suggest that ES can be enhanced by means of landowner incentives or regulatory mechanisms. Incentive programmes could be modelled after USFWS or NRCS landowner-targeted conservation programmes (such as the landowner incentive programme, environmental quality incentive programme, or wildlife habitat incentive programme) or regulations could be developed as part of a comprehensive watershed plan (see for example the Chesapeake Bay total maximum daily loads).
Among the services considered here, riparian filtration, erosion control, carbon storage, and surface water regulation capacity are the easiest and least expensive services to enhance because land cover and land use play such an important role (Table 1). To enhance these services on easement properties: (1) easement contracts could require the establishment of a minimum vegetated area within the riparian zone within a set period of time (such as two years), (2) riparian vegetation could be incentivized by scaling the tax benefits and breaks to maximize riparian filtration effectiveness (based on state best-management practice guidelines), (3) a cap on allowable impervious surfaces can be set to increase surface water regulation, (4) well-placed and functioning retention ponds and other surface water retention strategies can be included in easement contracts to offset the effects of impervious surface, and (5) upland and riparian reforestation can be incentivized by allowing the stacking of tax benefits (Banerjee et al. Reference Banerjee, Secchi, Fargione, Polasky and Kraft2013). For the most part, these actions could be evaluated using remote imagery and GIS through time to ensure land owners maintain these attributes. By adding a premium to lands that will provide greater public benefit, landscape-level conservation would be invested in. For services that are more difficult to enhance, like groundwater protection, recruiting new easements of low capacity may be even more important than conserving high capacity conservation areas. For example, by offering landowners of low groundwater protection lands incentives to put their land into easement may reduce the ecological pressures on the system (such as introduction of contaminants to a high leaching area) and help prevent contaminants from leaching into the groundwater.
Land can be managed within easements and PPAs to maximize synergies among services and minimize the cost of management. For example, riparian vegetation may enhance water quality regulation, but it also provides habitat to a wide array of aquatic and terrestrial biodiversity that provides the basis for wildlife-based recreation (Villamagna et al. Reference Villamagna, Angermeier and Niazi2013 b). ES-based incentives could be structured such that all ESs are equally valued, or the landowner is rewarded for each additional service generated. The latter is an ES stacking approach that is used in payment for ecosystem service markets (PES) to increase compensation to the providers of ESs and to further incentivize ES conservation (Banerjee et al. Reference Banerjee, Secchi, Fargione, Polasky and Kraft2013).
Wise-ES management
Our assessment of ESs throughout NC and VA provided important information to identify conservation areas for which certain activities should be avoided. Although erosion control capacity did not vary between PPAs and easements, VADCR, VDGIF, and NCDPR lands are more likely to erode soil into their watersheds than SNAs or NCDENR lands. Likewise, USFWS NWRs are more likely to contribute sediment to local waterways than USFS or USNPS lands. Therefore, these conservation areas in particular might seek to reduce highly erosive activities. Likewise, conservation areas with low groundwater protection capacity could alter land use to avoid contaminants from leaching. This would be particularly relevant within easements that continue agricultural practices which may introduce excessive nitrogen. Such considerations should be addressed during the easement contract process, and the assessment of regulating services presented here can help inform this process. In general, areas with low regulating capacities that are difficult to enhance (such as groundwater protection) should have stricter land use requirements written into the contracts. This may include a change in the seasonal application of nitrogen or requiring additional vegetation to enhance the uptake of surface nitrogen, the latter of which may also enhance carbon storage, riparian filtration, and biodiversity support in some areas.
The future of ES conservation
Large-scale PPAs provide a significant opportunity to protect and enhance ESs and biodiversity. However, the critical need to protect ESs expands far beyond the reaches of traditional parks, reserves, and refuges. Likewise, the current political climate and residential development in the south-east USA (Stein et al. Reference Stein, Alig, White, Comas, Carr, Eley, Elverum, O’Donnell, Theobald, Cordell, Haber and Beauvais2007) make government-sponsored PPAs increasingly difficult to expand. It is therefore both logical and necessary to consider enhancing the protection of ESs and biodiversity across private landscapes in order to maintain ecological resilience in the face of amplified threats due to growing and shifting human populations and climate change. In order to do so, conservation efforts should: (1) continue to protect natural and uninhabited areas that provide ecosystem and biological diversity, (2) expand conservation efforts into private lands closer to current human population centres, (3) limit future development to resilient areas that can sustain new population growth and incorporate ES-wise landscape planning, and (4) increase protection status from gap status 3 or 4 to 1 or 2 for existing private or public lands in high utility areas. By taking human population density and land use into consideration, we can identify areas where an increase in protection status might provide greater collateral ES benefits. For example, the lack of gap status 1 or 2 conservation areas in west-central NC (Fig. 1) limits the current opportunity to prevent or mitigate the storm water and water quality issues that are increasing in this region (the Catawba River basin) due to rapid population growth and land-use changes (Kramer & Eisen-Hecht Reference Kramer and Eisen-Hecht2002; Gage et al. Reference Gage, Spivak and Paradise2004). We expect an expansion of ES benefits from conservation areas to more beneficiaries in currently underrepresented areas by shifting conservation efforts to address these aforementioned priorities.
Private conservation easements offer extraordinary potential for expanding biodiversity and ES protection because they include the most productive lands (Scott et al. Reference Scott, Davis, McGhie, Wright, Turner and Estes2001), currently protect areas of relatively high capacity, and could protect diverse habitats from land conversion. When considering public land acquisition as the alternative, conservation easements cost at least 40% less per unit area than the outright purchase of the land (fee simple; Fishburn et al. Reference Fishburn, Kareiva, Gaston and Armsworth2009) and current conservation easements have a similar capacity to provide ES to federal and state PPAs. Perhaps more importantly, due to the flexibility of their geographic scope, their relative size, and the economic and cultural appeal to private landowners (WRI [World Resources Institute] 2007), easements can be established in areas where PPAs are limited and where larger human populations are in need of high regulating service capacities. A mosaic of broadly dispersed, albeit relatively small, conservation easements held by a variety of managers could provide a more resilient and synergistic network of biodiversity and ES conservation that is not currently achievable by public conservation efforts alone in the developed and densely populated mid-Atlantic and south-east USA, as well as other developing areas worldwide.
CONCLUSIONS
This assessment has highlighted several globally important messages. First, private conservation strategies may be the most efficient and cost-effective approach to conserving ESs for the most people. Given their location and relative flexibility, private conservation easements may enhance ES conservation throughout working landscapes thereby providing benefits to a broader array of beneficiaries in areas outside of the reach of federal and state PPAs. Second, there are clear differences in current ES capacities among different public and private entities. Some of the differences may be attributed to landscape-scale management objectives. For example, biodiversity-centric conservation areas such as the USFWS wildlife refuges were likely established in areas of greater species richness than the USFS national forests, which focused more on timber production, aesthetics, recreation and, more recently, water quality. However, despite inherent differences in conservation goals, a baseline assessment of ES capacities across all levels of conservation provides a starting point for evaluating potential trade-offs associated with land-use and policy changes. This assessment also integrates ESs into the on-going conversation of global conservation priorities, including where and how biodiversity and ES conservation can be synergized.
Public and private conservation areas can and should work together to protect a wider array of ESs. Efforts to enhance conservation should explicitly consider: (1) current capacity of ESs, (2) trade-offs or synergies among ESs, (3) the geographic scope and magnitude of benefits, and (4) potential beneficiaries of current and new conservation areas (A. Villamagna et al., unpublished data 2014). Private land conservation offers an exciting opportunity to protect ES in areas outside of PPAs, however such strategies are hinged on the ability to provide sufficient compensation to a landowner. Compensation for ES generation on easement lands can be structured in a variety of ways, including a bundled service or stacked service approach (Banerjee et al. Reference Banerjee, Secchi, Fargione, Polasky and Kraft2013) in order to incentivize ES conservation on private lands.
The spatial juxtaposition of conservation areas with high and low total ES capacity suggest fine scale heterogeneity in natural or anthropogenic features (such as land use) across VA and NC. This level of spatial variability supports our suggestion that ES conservation move toward enhancing a broad, landscape-scale network of private conservation areas to achieve ES protection in more areas across the states. Ultimately, a comprehensive conservation network that protects and enhances the flow of critical ESs, including biodiversity, should be achievable by combining existing PPAs with current and future conservation easements on private lands.
ACKNOWLEDGEMENTS
We thank B. Rollison for his contributions to the GIS analysis and to B. Mogollón and P. Angermeier for their valuable feedback on earlier drafts. Also thanks to S. Prisley for assistance locating data and to the departments of Fish and Wildlife Conservation and Crop and Soil Environmental Science at Virginia Tech for supporting this research.
Supplementary material
To view supplementary material for this article, please visit http://dx.doi.org/10.1017/S0376892914000393.