Implications
Development of methodologies that could improve the knowledge of diet selection of herbivore species grazing in heathland vegetation areas is determinant to the development of sustainable animal production systems on these areas, providing an economical and environmental benefit that will contribute to the improvement of life condition of rural populations. This article intends to evaluate the potential of long-chain alcohols as markers for estimating the diet composition of goats grazing heathland areas.
Introduction
Heathlands are semi-natural vegetation communities covering mountain areas of the northwest of the Iberian Peninsula that are grazed by different domestic herbivore species (i.e. goats, sheep, cattle and horses) with minimal management. These animal species demonstrate different abilities to exploit these low nutritive feed resources as a result of their different morpho-physiological characteristics (Illius and Gordon, Reference Illius and Gordon1993; Lechner-Doll et al., Reference Lechner-Doll, Hume and Hofmann1995). Studies conducted in these areas (Celaya et al., Reference Celaya, Oliván, Ferreira, Martínez, García and Osoro2007 and Reference Celaya, Benavides, García, Ferreira, Ferre, Martínez, Ortega-Mora and Osoro2008; Osoro et al., Reference Osoro, García, Jáuregui, Ferreira, Rook and Celaya2007) indicated that goats use them more efficiently, as they are able to complement higher quality herbage (from adjacent semi-natural grasslands or improved pastures) with browse species (Erica spp., Calluna vulgaris and Ulex gallii), especially when the availability of herbage decreases. Knowledge on how livestock species use and influence different plant communities is important to improve their management, enhancing simultaneously livestock production and biodiversity (Rook et al., Reference Rook, Dumont, Isselstein, Osoro, Wallis, Parente and Mills2004; Mandaluniz et al., Reference Mandaluniz, Aldezabal and Oregui2009).
The evaluation of diet selection of goats has been carried out using n-alkanes as markers. However, previous studies (Ferreira et al., Reference Ferreira, Oliván, Celaya, Garcia, Rodrigues and Osoro2007a; Oliván et al., Reference Oliván, Ferreira, García, Celaya and Osoro2007) pointed out difficulties in distinguishing several plant species (Lolium perenne, Trifolium repens, Pseudarrhenatherum longifolium, Agrostis capillaris and U. gallii) normally found in these vegetation communities. Moreover, these plant species are known to possess very low alkane concentrations, which could limit the applicability of alkanes, both in terms of number of plant species to be discriminated and of a negative influence on the accuracy of diet composition estimates (Brosh et al., Reference Brosh, Henkin, Rothman, Aharoni, Orlov and Arieli2003). The use of long-chain fatty acids (LCFA; Ferreira et al., Reference Ferreira, Carvalho, Falco, Celaya, García, Santos, Rodrigues and Osoro2009a), especially when combined with alkanes, seemed to improve the accuracy of estimates. Nevertheless, results indicated a higher capability of alkane markers to discriminate diet components. Other epicuticular wax compounds (i.e. long-chain alcohols, LCOH) have been tested with success as an alternative or as a complement to alkanes (Kelman et al., Reference Kelman, Bugalho and Dove2003; Dove and Charmley, Reference Dove and Charmley2008; Lin et al., Reference Lin, Luo, Zhang, Wang, Shu and Hong2009).
The aim of this study was to assess the utilization of LCOH as faecal markers for estimating diet composition of goats fed with different plant species (herbage and browse species). The effect of combining LCOH with other markers (alkanes and LCFA) on the accuracy of estimates was also evaluated.
Material and methods
All the procedures used in this study were described in previous publications (Ferreira et al., Reference Ferreira, Oliván, Garcia, Rodrigues and Osoro2005 and Reference Ferreira, Carvalho, Falco, Celaya, García, Santos, Rodrigues and Osoro2009a); however, for the sake of clarity they are also summarized in this article. Trials were carried out during the grazing season (May to October) of 2003 at Carbayal Research Station, situated at 900 to 1000 m above sea level, at San Isidro's Mountain, Asturias, Spain (longitude 6°53′, latitude 43°21′), established on a natural shrubland of heather–gorse with areas of improved pastures (L. perenne and T. repens).
Experimental design, animals and diets
A total of seven diets were offered to seven different groups of four non-lactating goats, housed individually in metabolic crates to allow total collection of faeces and urine. Diets were distributed in three trials of 11 days each carried out in May (two diets), July (two diets) and October (three diets), and reflected the plant species availability and the grazing behaviour of goats on heathland areas during the summer grazing season (Celaya et al., Reference Celaya, Oliván, Ferreira, Martínez, García and Osoro2007). Each trial consisted of a 7-day period for adaptation of the animals to the diets and experimental conditions, followed by a 4-day period of collection of samples of faeces and diet components. One sample of the total faecal output was collected every 2 days, and a daily sample of each diet component was collected before the morning meal.
In May, eight crossbreed goats (22.9 ± 1.8 kg live weight – LW) were randomly distributed in two groups (D1 and D2). D1 received a diet composed of L. perenne (0.71) and U. gallii (0.29), and D2 animals were fed on L. perenne (0.70) and heather (0.30). During this trial, animals were offered a daily total amount of 1.0 kg dry matter (DM)/100 kg LW.
In July, eight crossbreed goats (27.3 ± 1.8 kg LW) were divided in two groups (D3 and D4) and received a daily total amount of 0.8 kg DM/100 kg LW. D3 received a diet composed of L. perenne leaf/stem (0.28), L. perenne spike (0.11), heather (0.30) and U. gallii (0.30). The D4 diet included L. perenne leaf/stem (0.39), T. repens (0.30) and heather (0.31).
In October, 12 crossbreed goats (24.9 ± 2.4 kg LW) were used and divided into three groups (D5, D6 and D7). These goats received a daily total amount of 0.8 kg DM/100 kg LW. D5 received a diet composed of meadow hay (0.40), heather (0.30) and U. gallii (0.30); the D6 diet included meadow hay (0.40), heather (0.30) and Erica arborea (0.30); D7 were fed with meadow hay (0.40), E. arborea (0.30) and U. gallii (0.30). The main plant species present in the meadow hay were L. perenne and T. repens.
During the trials, diet components were harvested from random sites within the Research Station and were offered twice a day (0900 and 1800 h) in equal proportions to the animals. The diet component called ‘heather’ represented the field proportion of different dwarf heather species, namely Erica umbellata, Erica cinerea and C. vulgaris, at the time that each trail was carried out. In October, E. arborea, a tall heather, was offered to the animals as, at this time of the grazing season, goats select this vegetation component (Osoro et al., Reference Osoro, Oliván, Martínez, García and Celaya2003). A low feeding level used in this trial (0.8 and 1 kg DM/100 kg LW) was selected to ensure that all diet components were completely consumed by the animals, preventing the existence of refusals (the botanical separation of the diet components in the refusals would be difficult to accomplish) and diet selection, and ensuring a uniform intake of the diet during the trial.
Chemical analysis
Sub-samples of the diet components and faeces collected during the trials were immediately dried on the day of collection, using a forced-air oven at 60°C for 72 h, for DM determination. Sub-samples for LCOH analyses were immediately frozen at −20°C and then freeze-dried and milled through a 1-mm screen. Alkanes (C25 to C33) were extracted using the method of Mayes et al. (Reference Mayes, Lamb and Colgrove1986) modified by Oliván and Osoro (Reference Oliván and Osoro1999), and their concentrations were determined using gas chromatography (for more details see Ferreira et al., Reference Ferreira, Oliván, Garcia, Rodrigues and Osoro2005). After the alkane analysis, all samples were stored in plastic containers in vacuum. Before LCOH analysis, the sub-samples of the diet components used in each experimental period and faeces of each animal were bulked, resulting in one bulk sample per diet component and per animal. Thus, only the bulk samples were analysed for LCOH.
LCOH analysis
The LCOH concentration of the diet components and faeces were analysed in duplicates according to the methods of Dove and Mayes (Reference Dove and Mayes2006). Briefly, the first stage involved treating 0.2 g of faeces or 0.5 g of diet components for 16 h with 3 or 4 ml of 1 M ethanolic KOH at 90°C, respectively, in a dry-block heater (Techne DB-3, Techne Ltd, Duxford, Cambridge, UK). Further, a hot extraction was performed with heptane and water at 60°C to remove alkanes and LCOH, and the extracts were evaporated to dryness. Extracts were then re-dissolved in 1 ml heptane, with warming, and were passed through a column containing silica gel and washed with 6 ml heptane to obtain the alkane extract. To obtain the crude LCOH extract, the silica-gel column was washed with 2 × 3 ml heptane/ethyl acetate (80 : 20, v/v), and the eluates were evaporated to dryness. The dried LCOH eluates were then re-dissolved in heptane with warming, and 0.05 ml were applied to an aminopropyl SPE column (Supelco, Bellefonte, PA, USA), preconditioned with 1 ml heptane placed in a positive pressure manifold, and then washed with 2 ml heptane. To obtain the purified LCOH extract, the aminopropyl SPE columns were washed with 1.8 ml of 95 : 5 (v/v) heptane/ethyl acetate followed by 1.8 ml of 90 : 10 (v/v) heptane/ethyl acetate, and the eluates were evaporated to dryness. To form acetate derivatives of the alcohols in the purified eluate, 3 ml of a freshly prepared mixture of acetic anhydride/pyridine (20 : 80 v/v) was added and was kept at 50°C overnight. After cooling, 0.6 ml water was added and the top layer of two extractions with 3 ml heptane was removed and evaporated to dryness. Alcohol acetate extracts were re-dissolved with 0.2 ml of heptane (kept at room temperature) for chromatographic analysis.
Analysis of LCOH (C20 to C32) was carried out by gas chromatography, using a Carlo Erba Mega Series 5160 (Carlo-Erba, Milan, Italy) fitted with a flame ionization detector. The target analytes were separated using a SGE Solgel 1 column, 30 m × 0.25 mm with 0.25 μm film thickness. Injection volume was 1 μl (splitless mode) and the injector temperature was 300°C. The column was maintained at 180°C for 3 min, ramped at 30°C/min up to 220°C, further ramped at 5°C/min to 325°C, and it was held at 325°C for 8 min. Helium was used as the carrier gas (inlet pressure 105 kPa).
All chromatographic analyses were carried out in duplicates for each extract, and a mixed standard was run regularly to enable corrections for variation in detector response, as suggested by Dove and Mayes (Reference Dove and Mayes2006). The LCOH concentrations were quantified relative to known amounts of the internal standard C27, added at the beginning of the extraction procedure.
Calculations
Faecal recovery (FR) of each LCOH was calculated for each animal as the proportion of marker consumed in the diet, which was recovered in the faeces.
The individual diet composition estimates were obtained using an iterative optimization procedure, which minimizes the sum of squared discrepancies between the actual LCOH, LCFA, alkane and their combined proportions in faeces (adjusted or not for incomplete FRs) and the estimated proportions (different combinations of diet components), according to Salt et al. (Reference Salt, Mayes, Colgrove and Lamb1994), using the Solver routine in Microsoft Excel. Estimates were based on LCOH alone, LCFA alone (C22 to C34), alkanes alone (C25 to C33) or a combination of markers (LCOH+LCFA, LCOH+alkanes, LCFA+alkanes and LCOH+LCFA+alkanes).
For these seven methodologies, different FR corrections were applied, being: (i) LCOH, LCFA and alkane faecal concentrations without any correction for incomplete faecal recovery (FR0); (ii) LCOH, LCFA and alkane faecal concentrations corrected using mean recovery rate of the dietary treatment that the animal belonged to (FR1); (iii) LCOH, LCFA and alkane faecal concentrations corrected using mean recovery rate across all experimental diets (FR2).
In vivo apparent DM digestibility (DMD) was calculated from total faecal collection using the equation:

where I is the total DM intake and F the total faecal DM output.
In order to assess the accuracy of diet composition estimates as a whole, overlap in diet composition between known values and those estimated using different sets of FR was calculated by the Kulczynski similarity index (KSI; Krebs, Reference Krebs1989) as KSI = 100 Σ2ci/Σ(ai + bi), where ci is the lesser percentage of i component in the two diets (known v. estimated) and (ai + bi) is the sum of percentages of each plant component in both the diets (known and estimated).
Statistical analysis
Statistical analyses were performed using GenStat (2008). Differences between diet components in LCOH, LCFA, alkane and their profiles combined were explored using principal components analysis (PCA). To assess whether the discriminatory information provided by the LCOH markers was additional to that provided by the alkanes, LCFA and alkanes+LCFA, principal component scores obtained with the two different classes of markers were compared by orthogonal Procrustes rotation (OPR) as suggested by Bugalho et al. (Reference Bugalho, Dove, Kelman, Wood and Mayes2004) and Dove and Charmley (Reference Dove and Charmley2008). The OPR rotates the axes of each PCA output to minimize the residual sum of squares between the PCA scores based on LCOH and those based on alkanes, LCFA and alkanes+LCFA. Large values for unexplained residual variance after OPR imply that the two classes of markers are providing different types of discriminatory information.
The effect of diet composition and carbon-chain length (CCL) on recovery of each LCOH in faeces was examined using ANOVA. Polynomial contrasts were applied to determine linear and quadratic effects of CCL and its interaction with diet composition effect.
The effects of diet composition, FR correction and marker type and their interactions on the KSI values were examined using ANOVA. Tukey's test was used for multiple comparisons among means. Differences among means with a P-value of less than 0.05 were considered significant.
The relationships between the FR of LCOH markers and their CCL or diet DMD were assessed by linear regression.
Results
LCOH profiles of the diet components
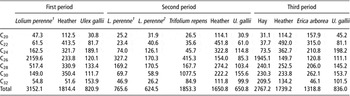
The LCOH profiles of the diet components used in the experimental diets are given in Table 1. Mean total LCOH concentrations vary from a minimum of 624 mg/kg DM (L. perenne spike fraction) to a maximum of 3152 mg/kg DM (L. perenne used in the first period). In general, U. gallii presented lower total concentrations, whereas the other woody species (i.e. heather and E. arborea) showed mean total concentrations above 1300 mg/kg DM.
Even- and long-chain alcohol concentrations (mg/kg dry matter) in the diet components offered to goats

1Leaf/stem.
2Spike.
The C26 alcohol predominated in the leaf/stem fraction of L. perenne and in the hay, representing more than 0.69 of the total LCOH concentration. It should be noted that the leaf/stem fraction of L. perenne used in the second period had almost 7 times lower C26 concentration than the L. perenne used in the first period. In heather, the individual LCOH with the highest concentration was C22, wheras in T. repens the highest concentration was in C30 alcohol, representing 0.58 of the total LCOH concentration. For U. gallii, C24 was the main LCOH, except in the second period where C30 had the highest individual concentration. It should be highlighted that U. gallii had the lowest total concentrations for all markers.
The heath species (i.e. heather and E. arborea) presented a predominance in the shorter LCOH (C20 to C24) with a mean value of 0.52 of the total LCOH concentration, whereas a very low concentration (0.05 to 0.16) in this type of LCOH was detected in vegetative parts of L. perenne and T. repens. The spike fraction of L. perenne showed a tendency to present a higher proportion for the shorter LCOH than its leaf/stem fraction.
The PCA results (data not shown) indicated that the first two principal components explained over 0.951 of between-species variation in terms of LCOH profiles, or when combined with other marker types (i.e. LCOH+LCFA, LCOH+alkanes or LCOH+LCFA+alkanes) in all experimental periods. In the first and third periods, all diet components were clearly discriminated when using LCOH individually or combined with the other marker types. By contrast, L. perenne leaf/stem and its spike, and U. gallii used in the second period showed similar LCOH profiles, whereas T. repens and heather were clearly discriminated. Similar results were obtained when using LCOH in combination with the other markers (i.e. LCOH+alkanes, LCOH+LCFA and LCOH+LCFA+alkanes).
The OPR results indicated that LCOH offered an additional discriminatory information to that provided by alkanes, LCFA and alkanes+LCFA. In fact, when their PCA scores were compared, a mean of 0.700 of the residual variance remained after rotation, ranging between a minimum of 0.332 (LCOH+LCFA in the third period) and a maximum of 0.895 (LCOH+alkanes in the third period).
FR of LCOH
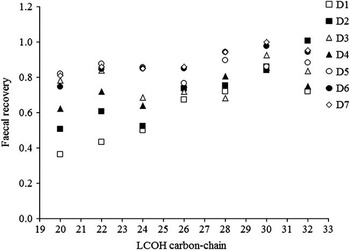
Results on the FR of LCOH are illustrated in Figure 1 and indicate an FR0 of these markers in goats, except for C32 that had an FR of 1.0. Overall data also showed that the FR tended to increase with CCL in a linear manner (P < 0.001, FR = 0.287 + 0.019 × CCL, R 2 = 0.253), varying between a minimum of 0.36 (C20 in D1) and a maximum of 1.00 (C32 in D2). The FR variability within diets was quite low with a mean coefficient of variation (CV) of 5.5%, whereas the variability of FR between diets was higher (16.0%) and varied with CCL. The variation in FR of LCOH between diets decreased with CCL from a maximum of 26.3% (C20 LCOH) to a minimum of 7.2% (C30 LCOH).
Effect of carbon-chain length on the faecal recovery of long-chain alcohols in goats fed seven experimental diets (D1: Lolium perenne (0.71)+Ulex gallii (0.29); D2: L. perenne (0.70)+heather (0.30); D3: L. perenne leaf/stem (0.28)+L. perenne spike (0.11)+heather (0.30)+U. gallii (0.30); D4: L. perenne leaf/stem (0.39)+Trifolium repens (0.30)+heather (0.31); D5: meadow hay (0.40)+heather (0.30)+U. gallii (0.30); D6: meadow hay (0.40)+heather (0.30)+Erica arborea (0.30); D7: meadow hay (0.40)+E. arborea (0.30)+U. gallii (0.30)).

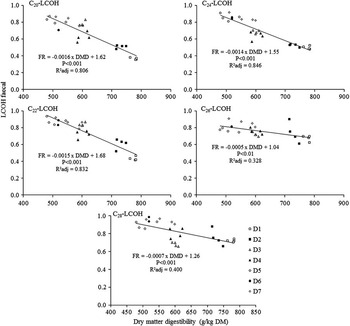
Diet composition influenced (P < 0.001) the FR of LCOH. Moreover, it seemed that FR was related with diet digestibility, as higher FR values were observed in diets with lower apparent DMD, except for C30 and C32. In Figure 2, the relationship between the FR of LCOH and diet digestibility is illustrated. The results also showed that the relationship between CCL and FR varied between diets. For diets used in the third period (i.e. D5, D6 and D7), a linear association between these two factors was observed. By contrast, the relationship between FR and CCL in the diets offered in the first two periods was better described by a quadratic function (P < 0.001 for D1 and D3; P < 0.05 for D2 and D4). As a result, an interaction between CCL and diet composition was observed in the FR of LCOH (P < 0.001).
Relationship between diet digestibility and faecal recovery of several long-chain alcohols observed in goats fed seven experimental diets (D1: Lolium perenne (0.71)+Ulex gallii (0.29); D2: L. perenne (0.70)+heather (0.30); D3: L. perenne leaf/stem (0.28)+L. perenne spike (0.11)+heather (0.30)+U. gallii (0.30); D4: L. perenne leaf/stem (0.39)+Trifolium repens (0.30)+heather (0.31); D5: meadow hay (0.40)+heather (0.30)+U. gallii (0.30); D6: meadow hay (0.40)+heather (0.30)+Erica arborea (0.30); D7: meadow hay (0.40)+E. arborea (0.30)+U. gallii (0.30)).

Diet composition estimation
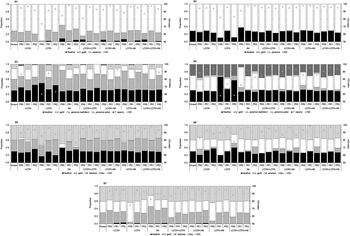
The comparison of known diet composition data with those estimated using different marker types (LCOH, LCFA or alkanes) and their combinations, and their respective KSI values are illustrated in Figure 3. The accuracy of diet composition estimates was influenced by the markers (P < 0.001) used in the calculations. The most accurate diet composition estimates were obtained using LCOH data alone or combined with other markers, ranging from a minimum KSI of 91.9% (LCOH) to a maximum of 93.7% (LCOH+alkanes). Similar (P > 0.05) high accuracy was observed when all the three marker types were combined (mean KSI value of 93.6%). Lower (P < 0.05) levels of accuracy were observed using alkanes (87.3%) and LCFA (81.8%) alone.
Comparisons of known and estimated proportions of dietary components obtained using different markers (LCOH, LCFA, alkanes, LCOH+LCFA, LCOH+alkanes, LCFA+alkanes and LCOH+LCFA+alkanes), and faecal recovery corrections (FR0, FR1 and FR2) for each experimental diet (D1 to D7).

Diet composition affected (P < 0.001) the accuracy of diet composition estimates, with D2 showing the highest KSI value (94.1%) and D3 showing the lowest value (85.2%). The worst estimate observed when using LCOH alone or combined was in D3 (LCOH, 87.3%), whereas the lowest KSI value was in D4 when using LCFA data. Thus, the accuracy of estimates obtained for each marker type or combination depended on the diets and, as a consequence, an interaction between these two factors was found (P < 0.001).
As expected, the accuracy of diet composition estimates were affected (P < 0.001) by the recovery corrections used in the calculations. The use of uncorrected faecal concentrations of markers (FR0) led to the poorest estimates of diet composition, with a mean KSI value of 86.5%, being lower (P < 0.05) than those obtained with FR2 (89.2%). For the same type of recovery correction (i.e. FR0, FR1 or FR2), accuracy of diet composition estimates was always higher for LCOH alone than for LCFA or alkanes alone. However, it seemed that the effect of recovery corrections on KSI values varied with diets as an interaction between these effects was observed (P < 0.001). The best estimates of diet composition were obtained when using more accurate estimates of FR1, with mean KSI values ranging from a minimum of 90.9% (LCFA alone) to a maximum of 97.1% (LCOH, LCFA and alkanes combined). It should be noted that the KSI value observed when using LCFA corrected with FR1 (90.9%) was lower than the KSI values of LCOH+LCFA, LCOH+alkanes and LCOH+LCFA+alkanes corrected with FR2, and LCOH+alkanes without recovery correction (FR0).
Discussion
LCOH profiles of the diet components
Results obtained in this study are consistent with results of previous studies (Ali et al., Reference Ali, Mayes, Hector and Ørskov2005a and Reference Ali, Mayes, Hector, Verma and Ørskov2005b; Dove and Charmley, Reference Dove and Charmley2008; Lin et al., Reference Lin, Luo, Wang, Zhang and Shu2008) that reported a trend for higher total LCOH concentrations than those of alkanes (Ferreira et al., Reference Ferreira, Oliván, Garcia, Rodrigues and Osoro2005) for the majority of the plant species, especially in the herbaceous species, which are known to possess very low total alkane concentrations (Oliván et al., Reference Oliván, Ferreira, García, Celaya and Osoro2007). Total LCOH concentrations were between 1.7 (L. perenne leaf/stem of the first period) and 4.7 (L. perenne leaf/stem of the second period) times greater than the alkane concentrations. Similarly, Dove and Charmley (Reference Dove and Charmley2008) observed higher total LCOH concentrations, between 2.4 (wheat straw) and 41.0 (Phalaris aquatica) times greater than those of alkanes. In addition, Lin et al. (Reference Lin, Luo, Zhang, Wang, Shu and Hong2009) found much higher total LCOH concentrations than those of alkanes in three native Chinese grass species, namely Leymus chinensis (14.9 times higher), Leymus dasystachys (62.4 times higher) and Elymus sibiricum (7.9 times higher). In our study, only the Ericaceae species (heather and E. arborea) had higher total alkane concentrations than those of LCOH, which is in opposition with the results obtained by Fraser et al. (Reference Fraser, Theobald and Moorby2006) for two heather species (C. vulgaris and Erica tetralix).
In comparison with the LCFA, LCOH showed lower total concentrations with the exception of L. perenne and hay used in the first and third period, respectively. A similar trend was observed by Ali et al. (Reference Ali, Mayes, Hector and Ørskov2005a) when comparing the concentration of these epicuticular wax compounds of 25 rangeland species of Sudan. By contrast, Lin et al. (Reference Lin, Luo, Wang, Zhang and Shu2008 and Reference Lin, Luo, Zhang, Wang, Shu and Hong2009) found a predominance of LCOH over the LCFA in several Chinese grass species (L. chinensis, L. dasystachys, E. sibiricum, Stipa daicalensis, Stipa grandis and Cleistogenes squarrosa).
The data showed large differences between plant species in their LCOH profile indicating the usefulness of these compounds for diet composition estimation. L. perenne presented a predominance of C26 and C28 LCOH, confirming earlier reports (Bugalho et al., Reference Bugalho, Dove, Kelman, Wood and Mayes2004; Ali et al., Reference Ali, Mayes, Hector, Verma and Ørskov2005b; Dove and Charmley, Reference Dove and Charmley2008) for various grass species. Concentration of C26 LCOH in the leaf/stem fraction of L. perenne used in the second period was almost 7 times lower than that of L. perenne used in the first period, and may indicate a possible maturity stage effect on the concentration of these compounds or can be only a result of different plant part (leaf and stem) proportions in the two experiments, as observed for the alkane markers (Dove et al., Reference Dove, Mayes and Freer1996; Smith et al., Reference Smith, Mayes and Raats2001). In addition, differences between the leaf/stem and spike fractions of L. perenne were detected with the reproductive part showing a higher proportion for the shorter LCOH than its vegetative tissues. A similar trend was observed for the alkanes (Dove et al., Reference Dove, Mayes and Freer1996; Ferreira et al., Reference Ferreira, Oliván, Garcia, Rodrigues and Osoro2005) and LCFA (Ferreira et al., Reference Ferreira, Carvalho, Falco, Celaya, García, Santos, Rodrigues and Osoro2009a).
In the case of T. repens, large amounts of C30 LCOH were detected and, as indicated by Dove and Charmley (Reference Dove and Charmley2008), this LCOH can be useful for a better discrimination of monocotyledon and dicotyledon species, known to posses very similar alkane profiles (Ferreira et al., Reference Ferreira, Celaya, Falco, Oliván, Santos, Guedes, Rodrigues and Osoro2010a). In the Ericaceae species, C22 was the individual LCOH with the highest concentration, as also observed by Fraser et al. (Reference Fraser, Theobald and Moorby2006), whereas for U. gallii no LCOH stood out as the predominant one.
In general, PCA results showed that all plant species were clearly discriminated when using LCOH data, as also observed for both alkanes (Ferreira et al., Reference Ferreira, Oliván, Garcia, Rodrigues and Osoro2005) and LCFA (Ferreira et al., Reference Ferreira, Carvalho, Falco, Celaya, García, Santos, Rodrigues and Osoro2009a). By contrast, L. perenne leaf/stem and its spike, and U. gallii used in the second period showed similar LCOH and LCFA (Ferreira et al., Reference Ferreira, Carvalho, Falco, Celaya, García, Santos, Rodrigues and Osoro2009a) profiles, suggesting difficulties in discriminating these plant species in a mixture when using these markers. In the case of L. perenne spike, it seems that alkanes are able to discriminate better this fraction from the leaf/stem one. However, when all three markers were combined an improvement of the discrimination of L. perenne leaf/stem and its spike, and U. gallii was not achieved, although OPR results indicated that the discriminatory information provided by all the markers was complementary. It should be pointed that the Ericaceae species were clearly discriminated by all the markers as a result of specific marker profiles for these plant species. In the case of T. repens, previous results obtained in our laboratory (Ferreira et al., Reference Ferreira, Oliván, Garcia, Rodrigues and Osoro2005 and Reference Ferreira, Celaya, García, Rodrigues and Osoro2009b; Oliván et al., Reference Oliván, Ferreira, García, Celaya and Osoro2007) suggest great difficulties in distinguishing it from L. perenne when using only alkanes. Results showed that in situations where these plant species are selected together by grazing animals, a better discrimination could be achieved if LCOH and/or LCFA are used.
FR of LCOH
The results obtained in this study showed an incomplete recovery of LCOH in goat faeces, as also observed in previous studies for these markers (Ali et al., Reference Ali, Mayes, Lamb, Hector, Verma and Ørskov2004; Dove and Charmley, Reference Dove and Charmley2008; Lin et al., Reference Lin, Luo, Zhang, Wang, Shu and Hong2009), and others as alkanes (Ferreira et al., Reference Ferreira, Oliván, Garcia, Rodrigues and Osoro2005; Charmley and Dove, Reference Charmley and Dove2007; Elwert et al., Reference Elwert, Dove and Rodehutscord2008) and LCFA (Ali et al., Reference Ali, Mayes, Lamb, Hector, Verma and Ørskov2004; Lin et al., Reference Lin, Luo, Zhang, Wang, Shu and Hong2009; Ferreira et al., Reference Ferreira, Carvalho, Falco, Celaya, García, Santos, Rodrigues and Osoro2009a) in ruminant species. Comparison of FR of LCOH with that of alkanes and LCFA with equal CCL (i.e. C20, C22, C24, C26, C28, C30 and C32) suggests a generally lower disappearance of all LCOH in the digestive tract of goats. These results are consistent with those observed by Ali et al. (Reference Ali, Mayes, Lamb, Hector, Verma and Ørskov2004), whereas Lin et al. (Reference Lin, Luo, Zhang, Wang, Shu and Hong2009) reported higher FR of LCFA than LCOH. The fate of LCOH and LCFA in the digestive tract of ruminant species needs to be clarified. Assuming that LCOH and LCFA have the same behaviour pattern as alkanes, no significant losses in the rumen are expected. In fact, Keli et al. (Reference Keli, Mayes and de Vega2008) observed that rumen microorganisms are not able to metabolize alkanes to other compounds, indicating that their disappearance should mainly occur in the small intestine.
Results showed that the FR of LCOH in the faeces of goats increased with CCL in a linear manner, as also observed by Dove and Charmley (Reference Dove and Charmley2008) and Ali et al. (Reference Ali, Mayes, Lamb, Hector, Verma and Ørskov2004) in sheep. Previous studies also showed a positive association between CCL and FR of the other plant wax markers. In some studies, this association was better described by curvilinear functions for both alkanes (Charmley and Dove, Reference Charmley and Dove2007; Elwert et al., Reference Elwert, Dove and Rodehutscord2008; Ferreira et al., Reference Ferreira, Celaya, García, Rodrigues and Osoro2009b) and LCFA (Ferreira et al., Reference Ferreira, Carvalho, Falco, Celaya, García, Santos, Rodrigues and Osoro2009a and Reference Ferreira, Celaya, Falco, Oliván, Santos, Guedes, Rodrigues and Osoro2010a), whereas linear ones were reported by Elwert et al. (Reference Elwert, Kluth and Rodehutscord2004) and Lin et al. (Reference Lin, Luo, Zhang and Shu2007) for the alkane markers. It should be pointed out that in this study, the trend was not consistent across diets, that is, for the diets used in the first two experiments the association was rather curvilinear than linear, resulting in an interaction between diet composition and CCL. Moreover, these results also indicate that the relative recoveries of LCOH (i.e. recovery of one LCOH relative to another LCOH) varied between diets, which could influence negatively the accuracy of diet composition estimation if calculations are made using different sets of LCOH FR.
Data also indicate a diet composition effect on the FR of LCOH. These results are not consistent with those reported by Dove and Charmley (Reference Dove and Charmley2008) and Ali et al. (Reference Ali, Mayes, Lamb, Hector, Verma and Ørskov2004). These discrepancies may be because of different plant species composition of the diets (Ferreira et al., Reference Ferreira, Oliván, Celaya, Garcia, Rodrigues and Osoro2007b). In fact, Lin et al. (Reference Lin, Luo, Zhang and Shu2007 and Reference Lin, Luo, Zhang, Wang, Shu and Hong2009) found differences in the FR of LCOH, LCFA and alkanes in sheep fed one of the three native Chinese grass species (E. sibiricum, L. chinensis or L. dasystachys). These authors related this herbage effect to different plant cuticular wax morphology among plant species that could determine the level of extraction and the absorption of these compounds in the digestive tract of animals. In addition, one must also refer that differences between diets in the FR of alkanes could also be attributed to different diet digestibilities. This issue has also been previously discussed by Ferreira et al. (Reference Ferreira, Oliván, Garcia, Rodrigues and Osoro2005) who suggested that these differences may only be observed when comparing diets with a wide range of digestibility values. This was also observed in this study for the LCOH, where a negative association between their FR and diet digestibility was found (Figure 2).
Comparison of LCOH FR data with that obtained for alkanes (Ferreira et al., Reference Ferreira, Oliván, Garcia, Rodrigues and Osoro2005) and LCFA (Ferreira et al., Reference Ferreira, Carvalho, Falco, Celaya, García, Santos, Rodrigues and Osoro2009a) also indicates that variability between diets, expressed as the CV, was lower for LCOH (16.0%) than for other markers (19.7% and 20.9%, respectively). Moreover, this variation tended to decrease with CCL from a maximum of 26.3% (C20 LCOH) to a minimum of 7.2% (C30 LCOH). This lower between-diet variation of LCOH FR could suggest that differences in the accuracy of diet composition estimates obtained using recovery data of one dietary treatment (FR1) or mean recovery rate across all experimental diets (FR2) will be lower when using LCOH than LCFA or alkanes.
Diet composition estimation
The results indicated a greater capacity of LCOH for distinguishing the plant species used in the present trial. Estimates based on LCOH alone were more accurate than those obtained with the other markers, regardless of the FR correction used in the calculations. In addition, Ali et al. (Reference Ali, Mayes, Lamb, Hector, Verma and Ørskov2004) and Lin et al. (Reference Lin, Luo, Zhang, Wang, Shu and Hong2009) found lower discrepancies between known and estimated diet proportions when using LCOH than alkanes or LCFA markers.
In the case of alkanes, Ferreira et al. (Reference Ferreira, Celaya, Santos, Falco, Guedes, Rodrigues and Osoro2010b) suggested that low concentrations in some plant species can make their discrimination more difficult, as more analytical errors are expected from their analytical quantification. For example, Charmley and Dove (Reference Charmley and Dove2007) found difficulties in obtaining accurate estimates of diet composition when P. aquatica was a component of the diets, because of the very low alkane concentrations present in that bunch grass (total alkane concentration of 75 mg/kg DM). Nevertheless, in a latter study, these authors (Dove and Charmley, Reference Dove and Charmley2008) compared the accuracy of diet composition estimates obtained with LCOH markers with those observed previously with alkanes (Charmley and Dove, Reference Charmley and Dove2007), and found better estimates using the latter ones, because of a poorer discrimination of P. aquatica and Lolium rigidum when using LCOH markers. By contrast, a greater ability of LCOH than alkanes was observed in previous studies performed by Lin et al. (Reference Lin, Luo, Zhang, Wang, Shu and Hong2009). These contradictory results could be related to a different ability of markers to discriminate different diet components (Ferreira et al., Reference Ferreira, Celaya, Falco, Oliván, Santos, Guedes, Rodrigues and Osoro2010a). In this study, although LCOH showed a generalized trend for producing better estimates of diet composition (i.e. D1, D3, D4, D5 and D7), for some diets (i.e. D2 and D6), estimates were more accurate when using the alkane markers. These findings are consistent with those reported in earlier studies by Ali et al. (Reference Ali, Mayes, Lamb, Hector, Verma and Ørskov2004) and Ferreira et al. (Reference Ferreira, Celaya, Falco, Oliván, Santos, Guedes, Rodrigues and Osoro2010a). In our opinion, the option for one type of marker should depend on their concentrations in the possible diet components, and its capability of discriminating between them.
The results showed that the combination of LCOH with the other markers (i.e. alkanes, LCFA and alkanes+LCFA) resulted in an increase in the accuracy of diet composition estimates, suggesting that LCOH provided different and complementary information about the diet components. The best diet composition estimates were obtained when combining LCOH with either alkanes (93.9%) or alkanes+LCFA (93.6%). Combination of markers is normally suggested for situations where the discrimination of plant species with similar profiles in one type of marker is difficult to accomplish. Lin et al. (Reference Lin, Luo, Zhang, Wang, Shu and Hong2009) found resemblances in the alkane profiles of L. sasystachys and L. chinensis, whereas problems were observed by Ferreira et al. (Reference Ferreira, Oliván, Garcia, Rodrigues and Osoro2005) in differentiating L. perenne, T. repens and U. gallii. In all studies, the combination of markers resulted in an increase of the discriminatory power between those plant species, and more accurate estimates of diet composition were obtained. Nevertheless, according to Bugalho et al. (Reference Bugalho, Dove, Kelman, Wood and Mayes2004) and Dove and Charmley (Reference Dove and Charmley2008), the combination of markers may not always result in better estimates of diet composition than those obtained using each marker individually.
As expected, the lowest level of accuracy of diet composition estimates was observed when less precise sets of recovery correction (i.e. FR0) were used, tending to overestimate those plant species with higher proportions on LCOH characterized by greater FR values. In the first and the second experimental periods, the use of FR0 led to an overestimation of L. perenne and T. repens, that is, the diet components with the highest proportion (0.914 and 0.942, respectively) on the LCOH (C26 to C32) with higher FR (mean of 0.787 and 0.791, respectively). However, in the third experimental period, although the meadow hay was the diet component with the highest proportion of the C26–C32 LCOH (0.949), the use of FR0 led to an overestimation of U. gallii. In our opinion, a lower difference between the FR of shorter (C20 to C24; mean of 0.833) and longer (C26 to C32; 0.905) LCOH may have decreased the importance of chain-length bias on the estimates. Thus, it seems that diet composition estimates will be a balance between the effect of concentration, the bias toward the longer markers (Ferreira et al., Reference Ferreira, Carvalho, Falco, Celaya, García, Santos, Rodrigues and Osoro2009a), and the effect of CCL on marker FR. These results are consistent with those reported by our laboratory for alkanes (Ferreira et al., Reference Ferreira, Oliván, Garcia, Rodrigues and Osoro2005) and LCFA (Ferreira et al., Reference Ferreira, Carvalho, Falco, Celaya, García, Santos, Rodrigues and Osoro2009a), and by other authors (Ali et al., Reference Ali, Mayes, Lamb, Hector, Verma and Ørskov2004; Dove and Charmley, Reference Dove and Charmley2008; Lin et al., Reference Lin, Luo, Zhang, Wang, Shu and Hong2009), and highlight the need of using accurate estimates of LCOH FR to obtain better estimates of diet composition.
For all markers and their combinations, the highest accuracy of diet composition estimates was observed when using marker faecal concentrations corrected FR1. It should be noted that for FR1 correction, the KSI values obtained with LCOH alone (95.1%) were higher than those found with alkanes (94.4%) or LCFA (90.5%), as a result of a lower variability between individuals in the level of absorbance of LCOH along the digestive tract. For all markers, the use of FR2 resulted in a decrease (P < 0.05) on the accuracy of estimates, reflecting a diet composition effect on marker FR. It should be noted that these differences were lower for the LCOH markers (95.1% v. 90.9%, respectively) than those of alkanes (94.4% v. 86.7%) and LCFA (90.5% v. 79.7%), indicating a lower importance of diet composition on LCOH faecal recovery. These results suggest that for LCOH markers the use of a general set of FR correction obtained from metabolic cage studies conducted with animals fed on diets with similar botanical composition to that available in the field would have a less impact than that of alkanes and LCFA. Moreover, it was also observed that this dependence will decrease if LCOH are combined with alkanes, as the accuracy of diet composition estimates obtained when combining these two markers using uncorrected faecal concentrations was even higher (mean KSI value of 92.1%). As recognized in previous studies (Dove and Mayes, Reference Dove and Mayes2005; Ferreira et al., Reference Ferreira, Oliván, Garcia, Rodrigues and Osoro2005 and Reference Ferreira, Carvalho, Falco, Celaya, García, Santos, Rodrigues and Osoro2009a; Oliván et al., Reference Oliván, Ferreira, García, Celaya and Osoro2007; Lin et al., Reference Lin, Luo, Zhang, Wang, Shu and Hong2009), the major limitation of the application of faecal markers in grazing studies is their dependence on the use of accurate FR values to obtain accurate estimates of diet composition. An alternative approach to that used in this study (i.e. metabolism cage studies using animals fed on known diets) to measure the FR of LCOH could be the dosing of various synthetic LCOHs of different chain lengths, odd-chain ones (C21, C23, C25, C27, C29 and C31) as they are present in very low concentrations (Dove and Mayes, Reference Dove and Mayes2006), whereas the recoveries of other even-chain LCOH can then be calculated by interpolation. This approach has been used with success when using the alkane markers (Dove and Mayes, Reference Dove and Mayes2005), although its application with LCOH would be more complicated as several LCOHs are not commercially available.
Conclusions
Results obtained in this study show that LCOH can be used as markers for studying diet selection of goats grazing on complex vegetation communities such as heathlands with adjacent improved ryegrass–clover pastures, provided that an accurate correction of their faecal concentrations is applied before diet composition calculations. Similar to alkanes and LCFA, LCOH FR was positively related with CCL. Data also indicate that for this particular situation, LCOHs are better diet composition markers than alkanes and LCFA, and that its combination with alkanes and alkanes+LCFA will improve the accuracy of the diet composition estimates.
Acknowledgements
The authors thank the Carbayal Research Station staff for their help in the field work and to M.J. Martínez, V. Fernández and C. Moura for collaboration in the analytical procedures.