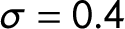
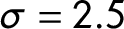
1 Introduction
Concerns about the cardinal treatment of ordinal dependent variables are well-known. Consider an ordinal scale measuring “satisfaction,” with the following four categories: “Very Dissatisfied,” “Dissatisfied,” “Satisfied,” and “Very Satisfied.” Suppose there are two groups of people, A and B, each consisting of two individuals. Group A has one person who is “Very Dissatisfied” and another who is “Very Satisfied.” Group B has one person who is “Dissatisfied” and another who is “Satisfied.” Which group is more satisfied?
The answer, in part, depends on the numerical values assigned to the response categories. It may seem reasonable to assign the integers 0, 1, 2, and 3 to each of the four categories. In this case, the groups are equally satisfied, with an average score of 1.5. Similar to utility functions, however, ordinal variables provide information about the rank of a specific concept, rather than representing a known or fixed interval. As such, any set of numerical values that preserve the ordering of the scale is also potentially valid. Therefore, another reasonable set of numerical values could be: 0, 1.75, 2.5, and 3. In this case, group B is more satisfied. Yet, another reasonable set of values could be: 0, 0.5, 1.25, and 3. In this case, group A is more satisfied.
Although ordinal response models (i.e., ordered logit or probit) are designed precisely for the situation where a researcher is interested in using an ordinal dependent variable,Footnote 1 there are numerous examples in applied empirical research where results using an ordinal response model are less preferred compared to results from a more simple and straightforward linear regression (see, e.g., Nunn and Wantchekon Reference Nunn and Wantchekon2011; Stevenson and Wolfers Reference Stevenson and Wolfers2013; Aghion et al. Reference Aghion, Akcigit, Deaton and Roulet2016; Bryson and MacKerron Reference Bryson and MacKerron2017; Deaton Reference Deaton2018, as well as numerous other examples listed in the Online Supplement). Despite the well-known concerns, justification for using a linear regression with an ordinal dependent variable often include the incidental parameter problem (Neyman and Scott Reference Neyman and Scott1948; Heckman Reference Heckman, Manski and McFadden1981; Lancaster 2000; Riedl and Geishecker Reference Riedl and Geishecker2014), debatable assumptions about the distribution of the error term (Bond and Lang Reference Bond and Lang2019), or the use of a more sophisticated identification strategy—such as, for example, fixed effects (Ferrer-i-Carbonell and Frijters Reference Ferrer-i-Carbonell and Frijters2004).
Most fundamentally, concerns associated with the cardinal treatment of an ordinal dependent variable can be characterized as a missing information problem. That is, the researcher does not know the form of the function characterizing the relationship between the ordinal scale and the latent variable (Oswald Reference Oswald2008). Recent work demonstrates this point in related but distinct ways. Focusing on transformations to the observed values of the ordinal scale, Schröder and Yitzhaki (Reference Schröder and Yitzhaki2017) demonstrate that valid empirical estimates must be robust to monotonic increasing transformations of the observed ordinal scale. Focusing on transformations to the unobserved latent variable, Bond and Lang (Reference Bond and Lang2019) point out that empirical results using ordered logit or probit regression analysis implicitly assume either a normal or logistic distribution on the error term, when alternative distributions of the error term are also theoretically permissible.
In this paper, I develop a partial identification method for testing how much the cardinal treatment of ordinal variables matters for any empirical specification. It is generally not possible to perform credible statistical inference without any assumptions. Although some of these assumptions are plausible and based on known economic principles, inevitably some of these assumptions are arbitrary—and at times esoteric—but necessary to interpret empirical estimates (Tamer Reference Tamer2010). In the context of ordinal variables, most studies make an assumption about the functional form of the reporting function which cannot be supported by known economic principles.Footnote 2 These sorts of assumptions are necessary to point-identify effect estimates. The method I describe allows for estimation of a set of estimates based on a range of plausible monotonic increasing transformations of the ordinal dependent variable. I apply this method to re-examine empirical estimates of Nunn and Wantchekon (Reference Nunn and Wantchekon2011) on the slave trade and trust in sub-Saharan Africa.Footnote 3
The method described in this paper first limits the universe of monotonic increasing transformations to be defined by a parameterized function representing a (relatively extreme) range of transformations. Next, based on this range of transformations, the researcher estimates a set of effect estimates. Finally, if effect estimates are not robust to this initial range of transformations and as demonstrated by Kaiser and Vendrik (Reference Kaiser and Vendrik2019), the researcher graphically assesses the plausibility of the transformation associated with specific effect estimates. This method, therefore, tests the sensitivity of the parameter of interest to a range of plausible monotonic increasing transformations.
The contribution of this paper is threefold. First, the method developed in this paper generalizes the work of Schröder and Yitzhaki (Reference Schröder and Yitzhaki2017) to cases using econometric specifications with multiple covariates. In practice, the sufficient conditions developed by Schröder and Yitzhaki (Reference Schröder and Yitzhaki2017) apply only to cases either comparing means between two groups or performing simple bivariate regression analysis.Footnote 4 The empirical application shows that the inclusion of additional covariates in a given econometric specification influences robustness of results to monotonic increasing transformations. That is, it is possible to fail the sufficient conditions developed by Schröder and Yitzhaki (Reference Schröder and Yitzhaki2017), and yet, when the full set of covariates are included in the empirical specification, the results can be robust to plausible monotonic increasing transformations.
Second, this method provides insight into the robustness of the sign, size, and statistical significance of effect estimates. Although the sufficient conditions of Schröder and Yitzhaki (Reference Schröder and Yitzhaki2017) provide tests for the robustness of the sign of effect estimates, these conditions are silent about the size and statistical significance of these estimates.Footnote 5 By calculating a set of effect estimates, this method allows researchers to fully assess the sensitively of the sign, size, and statistical significance of effect estimates. This is important because the sign is not the only important piece of information derived from effect estimates. Both the size and precision (i.e., statistical significance) of effect estimates are necessary inputs into cost-benefit analysis, policy evaluation, and the estimation of important economic parameters.
Finally, the recent work on the valid statistical treatment of ordinal variables, by Schröder and Yitzhaki (Reference Schröder and Yitzhaki2017) and Bond and Lang (Reference Bond and Lang2019), focus on ordinal variables measuring subjective well-being or happiness. These insights also apply to any variable that measures a latent concept using an ordinal scale. Therefore, concepts such as “satisfaction” (Frijters, Haisken-DeNew, and Shields Reference Frijters, Haisken-DeNew and Shields2004; Clark and Oswald Reference Clark and Oswald1996), “trust” (Nunn and Wantchekon Reference Nunn and Wantchekon2011; Putnam Reference Putnam2001), various measures of mental well-being and personality traits (Borghans et al. Reference Borghans, Duckworth, Heckman and ter Weel2008; Baird, de Hoop, and Oxler Reference Baird, de Hoop and Oxler2013; Cornaglia, Feldman, and Leigh Reference Cornaglia, Feldman and Leigh2014), measures of “affect” (Krueger et al. Reference Krueger, Kahneman, Schkade, Schwarz, Stone and Krueger2009; Krueger Reference Krueger2017), measures of “quality”—of political institutions (Acemoglu, Johnson, and Robinson Reference Acemoglu, Johnson and Robinson2001), for example—and even standardized test scores (Bond and Lang Reference Bond and Lang2013; Glewwe Reference Glewwe1997; Jacob and Rothstein Reference Jacob and Rothstein2016; Lang Reference Lang2010; Schröder and Yitzhaki Reference Schröder and Yitzhaki2016) are all measured with an ordinal scale. This paper extends existing theoretical insights to any empirical application using an ordinal dependent variable.
The next section briefly describes the theoretical framework motivating this research. In that section, I outline the potential theoretical consequences of the cardinal treatment of ordinal variables and summarize the sufficient conditions developed by Schröder and Yitzhaki (Reference Schröder and Yitzhaki2017). Section 3 introduces the methodology developed in this paper. Section 4 empirically illustrates this method. Finally, Section 3 concludes.
2 Theoretical Framework
Although ordinal variables are used to measure a variety of concepts with no natural quantitative unit of measure, I proceed here by briefly discussing the subjective well-being literature specifically. As discussed below, the following also applies to other ordinal variables, such as happiness, satisfaction, trust, measures of quality, standardized test scores, and other concepts that require measurement via the use of an ordinal scale. Nevertheless, it is helpful to draw a connection to the familiar concept of utility theory and the relevant implications for econometric analysis (Greene Reference Greene2012; Becker and Kennedy Reference Becker and Kennedy1992). Suppose an individual’s well-being is characterized by the following underlying relationship:
 $$ \begin{align} Y^{*} = X^{\prime}\beta + \epsilon. \end{align} $$
In this characterization,
 $Y^{*}$
is the unobserved latent well-being of the individual. The vector X represents observable variables that define an individual’s well-being and
 $\beta $
is a vector of regression coefficients. Since,
 $Y^{*}$
cannot be directly observed, subjective well-being, Y, is measured via an ordinal variable with the various values of
 $\mu $
corresponding to threshold points on the ordinal scale:
 $$ \begin{align} Y = \left\{ \begin{array}{ccc} 0 & \text{if} & Y^{*} \leq 0, \\ 1 & \text{if} & 0 < Y^{*} \leq \mu_{1}, \\ 2 & \text{if} & \mu_{1} < Y^{*} \leq \mu_{2}, \\ \vdots \\ N & \text{if} & \mu_{N-1} < Y^{*}. \end{array} \right. \end{align} $$
A fundamental problem, when estimating Equation (1) with ordinary least squares (OLS), is the values of
 $\mu $
are unknown.Footnote
6
Using the observed ordinal scale of Y as the dependent variable implicitly assumes that the values of Y have known and fixed intervals. Thus, OLS assumes the ordinal variable measuring well-being is cardinal.
2.1 The Reporting Function
Oswald (Reference Oswald2008) critiques the subjective well-being and happiness literature by arguing that this research has yet to establish the shape of the function relating reported subjective well-being to actual well-being. Oswald (Reference Oswald2008) states:
As an example, imagine that there is constant marginal utility of income, but that people as they feel cheerier, mark themselves happier on a questionnaire scale in a way in which they are intrinsically reluctant to approach the upper possible level on the questionnaire form. Then the reporting function itself is curved. In this case, we will have the illusion […] that true diminishing marginal utility of income has been established empirically.
A similar argument is easily applied to other ordinal variables, such as happiness, satisfaction, trust, and measures of quality. Standardized test scores perhaps require a brief explanation. As discussed in Bond and Lang (Reference Bond and Lang2013), standardized test scores may not have a known or fixed interval between values.Footnote 7 Consider a simple case where a test score simply assigns values based on the number of questions answered correctly by each student. If some questions are more difficult than others, then assuming a fixed interval or cardinal scale may not be valid. Since test scores approximate student “learning,” answering difficult questions correctly may signal a larger marginal gain in learning than answering the easier questions correctly (see, e.g., Reardon Reference Reardon2008; Nielsen Reference Nielsen2017). The reporting function for test scores, therefore, defines the relationship between actual student learning to performance on a test.
2.2 Sufficient Conditions for Robustness of Sign
Testing for the robustness of monotonic increasing transformations is complicated by the fact that there are an infinite number of ways to transform an ordinal variable. Precisely, due to this reality, Schröder and Yitzhaki (Reference Schröder and Yitzhaki2017) derive two theoretical conditions under which effect estimates will be robust in sign to monotonic increasing transformations. The first condition refers to the robustness of mean comparisons between groups, and the second condition refers to the robustness of OLS regression estimates.Footnote 8
These conditions draw from the literature on stochastic dominance (Hadar and Russell Reference Hadar and Russell1969). In particular, the first condition states that the mean of one group is larger than that of another mutually exclusive group if and only if the former first-order stochastically dominates the latter. This condition implies that if the cumulative distribution functions (CDFs) of each group intersect, then it is possible to find a monotonic transformation of the ordinal scale that will change which group has a larger mean.
The second condition introduces the concept of the line of independence minus absolute concentration (LMA) curve. As the name suggests, the LMA curve takes the difference between two curves: the line of independence (LoI) and the absolution concentration curve. The LoI is defined as the weighted mean of the dependent variable, Y, multiplied by the cumulative distribution,
 $F(X)$
, of the explanatory variable, X:
 $$ \begin{align} \textit{LoI}_{i} = \big[ \frac{1}{N} \sum^{N}_{i=1} w_{i} Y_{i} \big] \times F(X_{i}). \end{align} $$
The absolute concentration curve (ACC) is the cumulated product of the dependent variable, Y, and the frequency weight, w, divided by the sum of the frequency weights:
 $$ \begin{align} \textit{ACC}_{1} = \frac{Y_{1} w_{1}}{\sum^{N}_{i=1} w_{i}}, \ \ \ \ ACC_{2} = \frac{Y_{1} w_{1} + Y_{2} w_{2}}{\sum^{N}_{i=1} w_{i}}, ... \ \ , ACC_{N} = \frac{Y_{1} w_{1} + ... + Y_{N} w_{N}}{\sum^{N}_{i=1} w_{i}}. \end{align} $$
In both Equations (3) and (4),
 $Y_{1} \leq Y_{2} \leq \cdots \leq Y_{N}$
. Equation (4) can be interpreted as the generalized Lorenz curve. Finally, the LMA curve is defined as follows:Footnote
9
 $$ \begin{align} \textit{LMA}_{i} = LoI_{i} - ACC_{i} \ \ \ \ \ \ \ \ \forall \ \ N. \end{align} $$
The LMA curve is related to the concept of second-order stochastic dominance and the absolute Lorenz curve. Recall that second-order stochastic dominance states that if two Lorenz curves cross, then it is impossible to determine which of two mutually exclusive groups second-order stochastically dominates the other. Therefore, the second condition, derived by Schröder and Yitzhaki (Reference Schröder and Yitzhaki2017), states that if the LMA curve intersects the horizontal axis, then the absolute Lorenz curve intersect the LoI, and there is some monotonic increasing transformation that will change the sign of the OLS regression coefficient.Footnote 10 If the absolute Lorenz curves do not cross, then there does not exist a monotonic increasing transformation that can change the sign.Footnote 11
Stated more formally, the logic of the second condition is as follows. Consider two simple bivariate OLS regression coefficients,
 $\alpha _{1}$
and
 $\beta _{1}$
, from two separate specifications. One uses the raw ordinal variable, Y, and the other uses the transformed ordinal variable,
 $T(Y)$
. If the LMA curve of Y, with respect to X, intersects the horizontal axis, it is possible to find a monotonic increasing transformation of the dependent variable,
 $T(Y)$
, that can change the sign of the OLS regression coefficient. That is, if
 $\alpha _{1}$
is positive (negative), then
 $\beta _{1}$
will be negative (positive). This implies:
 $$ \begin{align} \frac{\alpha_{1}}{\beta_{1}} = \frac{\frac{Cov(X,Y)}{Var(X)}}{\frac{Cov(X,T(Y))}{Var(X)}} < 0. \end{align} $$
Although these sufficient conditions are instructive, important questions remain. First, suppose there exists a transformation
 $T(Y)$
that allows Equation (6) to hold, what is the shape of this transformation? Second, on the other hand, suppose there does not exist a transformation
 $T(Y)$
that allows Equation (6) to hold, does the magnitude of the coefficient meaningfully change? Similarly, how is statistical significance affected by these transformations? Finally, Equation (1) displayed an analytical example where there are multiple covariates, and Equations (3)–(6) only consider one X variable. This raises a final question. Since the existing tests of Schröder and Yitzhaki (Reference Schröder and Yitzhaki2017) only focus on simple bivariate examples, how are researchers to test robustness of more complicated specifications to monotonic increasing transformations of the ordinal scale? These are the questions that this paper now aims to address.
3 A Partial Identification Method
The method consists of three steps. First, the researcher defines a parameterized function representing a (relatively extreme) range of transformations. In this section, I discuss two possible parameterized functions representing distinct classes of transformations: (i) globally concave and convex transformations and (ii) transformations with an inflection point. Second, the researcher estimates a set of effects associated with this range of transformations. Finally, within this set of transformations, and given the specific empirical setting, the researcher defines a (more narrow) range of plausible transformations. Consistent with the “law of decreasing credibility” (Manski Reference Manski2003), as the strength of the assumptions used in this last step increases, the credibility of the effect estimate decreases.
3.1 Globally Concave and Convex Transformations
In the spirit of Oswald (Reference Oswald2008), the reporting function can be convex, concave, or linear in the raw ordinal rankings. The following parameterized function effectively allows the reporting function to be convex, concave, or linear depending on the value of the
 $\sigma $
parameter:
 $$ \begin{align} \textit{T({Y})} = Y_{Max} \times \left(\frac{\textit{Y}}{Y_{Max}}\right)^{\sigma} \ \ \ \ \ \ \ \ \ \ \ \ \forall \ \ \sigma> 0. \end{align} $$
In this transformation, Y is the linear ordinal scale ranging from zero to
 $Y_{Max}$
—where
 $Y_{Max}$
is the maximum value of the observed ordinal scale.Footnote
12
If
 $\sigma = 1$
, then the scale remains in its linear form. If
 $0 < \sigma < 1$
, then the scale will be concave to some degree, with the distances between relatively low levels being larger than the distances between relatively high levels. Finally, if
 $\sigma> 1$
, then the ordinal scale will be convex to some degree, with the distances between relatively low levels being smaller than the distances between relatively high levels.
Theoretically, values of
 $\sigma $
could exist within the positive infinite interval
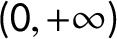 $(0, +\infty )$
. If some restrictions to this domain are acceptable, however, Equation (7) can help provide insight into the robustness of a particular effect estimate to plausible monotonic increasing transformations. Figure 1 shows Equation (7), assuming—for illustrative purposes—a 0–10 ordinal scale, with several values of
 $\sigma $
. Plotting these functions allows researchers to make a choice about restrictions to the domain of transformations.
Specific parameter values of globally concave and convex transformations. Notes: This figure shows various transformation functions, given specific parameter values. The functions map the original variable, Y, into a transformed ordinal variable, T(Y). In this figure, the ordinal scale is assumed to run from 0 to 10.

As argued by Kaiser and Vendrik (Reference Kaiser and Vendrik2019), graphically assessing plausibility may be the best and most transparent approach. Alternative ways for assessing plausibility could include benchmarking the shape of the distribution of the ordinal variable based on some other variable that measures a related concept. This is the approach used by Bond and Lang (Reference Bond and Lang2019) who argue that the distribution of subjective well-being can be just as skewed as the wealth distribution. Although this method of benchmarking can be potentially informative, it is still widely debated by empirical researchers. Kaiser and Vendrik (Reference Kaiser and Vendrik2019) demonstrate that the transformations used by Bond and Lang (Reference Bond and Lang2019) imply unrealistic assumptions about the way individuals reply to survey questions. Specifically, although the log-normal transformation used by (Bond and Lang Reference Bond and Lang2019) is theoretically permissible, it implies that small changes at low levels of true unobservable happiness are able to change responses on the observed ordinal scale by several categories and—at the same time—only large changes at high levels of true unobservable happiness are able to change responses on the observed ordinal scale. Moreover, Kaiser and Vendrik (Reference Kaiser and Vendrik2019) point out that it is unclear how knowing the predicted distribution of happiness is more or less skewed than the income distribution informs about the plausibility of a monotonic increasing transformation. If higher incomes are subject to decreasing marginal utility—as is assumed by many researchers and (arguably) empirically supported—then we should expect the distribution of true unobservable happiness to be less skewed than the income distribution.
For the subsequent empirical illustrations, I assume that
 $\sigma \in [0.1, 10]$
define the range of transformations. In each of the empirical illustrations, this range of transformations is relatively extreme. In the analysis of trust, shown in the main text, a transformation at each end of this range implies massive changes in latent trust associated with either only relatively low or relatively high reported trust levels. This range of transformations is purposefully extreme. It allows the researcher to compute a large set of effect estimates associated with this wide range of transformations. As I will discuss in Section 3.3, the final step of this method is to assess a (more narrow) range of plausible transformations.
3.2 Transformations with an Inflection Point
An alternative class of transformations are those with an inflection point. Rather than being either concave or convex, this class of transformations are convex below and concave above an inflection point. The motivation for this class of transformations extends the intuition of Oswald (Reference Oswald2008), where people are reluctant to report the highest values of some ordinal scale. If the “true” reporting function is one with an inflection point, this would imply that people are also reluctant to report the lowest values on the scale. Said differently, it takes a relatively large marginal gain or loss of some latent variable to move an individual off the midpoint of the observed ordinal scale.
One way to define such a class of reporting functions is to transform the observed ordinal scale as follows:
 $$ \begin{align} \textit{T({Y})} = Y_{Max} \times F\Big(\frac{X-Y_{Mid}}{\sigma}\Big). \end{align} $$
In Equation (8),
 $F(\cdot )$
is the CDF with a mean of
 $Y_{Mid}$
—the middle point on the ordinal scale—and a standard deviation of
 $\sigma $
. The domain of
 $\sigma $
is determined by the range of the ordinal scale. In general, if the scale is zero through
 $Y_{Max}$
and
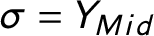 $\sigma = Y_{Mid}$
, then
 $F(\cdot )$
will essentially be linear.Footnote
13
If
 $\sigma $
is relatively close to zero, then
 $F(\cdot )$
will look increasingly like a step function, with the step at
 $Y_{Mid}$
. Therefore, limiting the domain of
 $\sigma $
is straightforward when using these CDF transformations with an inflection point. Defining
 $\sigma \in [0.1, Y_{Mid}]$
effectively characterizes all transformations from the nearly linear case to the relatively extreme step-function case. These details are visualized in Figure 2 for a 0–10 scale.
Specific parameter values of CDF transformations. Notes: This figure shows various transformation functions, given specific parameter values. The functions map the original variable, Y, into a transformed ordinal variable, T(Y). In this figure, the scale is assumed to run from 0 to 10.

3.3 Assessing Plausibility
The final step of this method—which is only necessary if effect estimates are not robust to the initial range of transformations—is to limit the set of effect estimates to those associated with a range of plausible transformations. As the work of Kaiser and Vendrik (Reference Kaiser and Vendrik2019) demonstrates, this assessment is best and most transparent when implemented graphically. This is not to say that other ways for assessing plausibility are inappropriate. Alternative ways such as (i) finding the range of transformations that preserve empirical results that must be true based on theory or (ii) benchmarking the shape of the distribution of the ordinal variable based on some other variable that measures a related concept could be effective in the appropriate context.Footnote 14 The present goal, however, is to provide a framework for assessing plausibility that could be reasonably applied in most empirical settings.
Graphically assessing plausibility first requires the researcher to examine the set of effect estimates associated with the relatively extreme range of transformations. If the estimated effects are qualitatively robust for the entire range of transformations, then the researcher can conclude that estimated effects are robust to extreme monotonic increasing transformations. Conversely, if the estimated effects are not robust in sign, statistical significance, and magnitude for the entire range of (relatively extreme) transformations, then the researcher must assess a range of plausible transformations, given the empirical context. I demonstrate this sort of analysis in the subsequent empirical illustration.
This final step may seem esoteric. It is important to acknowledge, however, that it is generally not always possible to perform credible statistical inference without any untestable assumptions (see, e.g., Conley, Hansen, and Rossi Reference Conley, Hansen and Rossi2012). As discussed by Tamer (Reference Tamer2010, p. 168), “the partial identification approach to econometrics views economic models as sets of assumptions, some of which are plausible and some of which are esoteric and are needed only to complete a model.” In this sense, partial identification allows for a way to test the sensitivity of effect estimates to these seemingly esoteric assumptions. Stronger assumptions (e.g., assuming a linear reporting function associated with an ordinal variable) will naturally allow for more information about a given effect estimate, however, as the strength of the necessary assumptions increases, the credibility of the effect estimate decreases (Coombs Reference Coombs1965; Manski Reference Manski2003).
Any assessment of plausible monotonic increasing transformations will critically rely on the specific elements of a given empirical application. Much like, for example, plausibly exogenous instrumental variables (Conley et al. Reference Conley, Hansen and Rossi2012). In the empirical applications discussed in this paper, I rely on existing research that specifically assesses the plausibility of various transformations of subjective well-being and happiness scales (Banks and Coleman Reference Banks and Coleman1981; Van Praag Reference Van Praag1991; Oswald Reference Oswald2008; Kaiser and Vendrik Reference Kaiser and Vendrik2019) and the cardinal properties of standardized test scores (Reardon Reference Reardon2008; Nielsen Reference Nielsen2017). Specifically, and as discussed in more detail in Section 4.2, if the reporting function of subjective well-being is curved at all, it is likely to be concave and the relationship between test scores and student learning is likely convex. Combining the general analytical approach developed in this paper with specific assessments of plausible transformations within a given empirical context provides useful structure for testing robustness of the cardinal treatment of ordinal variables.
4 Empirical Illustration
The primary empirical illustration re-evaluates the effect of the slave trade on present-day trust in sub-Saharan Africa. Using OLS, Nunn and Wantchekon (Reference Nunn and Wantchekon2011) find a negative and statistically significant relationship between their preferred measure of slave trade activity and various measures of trust with the following specification:
 $$ \begin{align} Trust_{iedc} = \psi_{c} + \varphi Slave \ \ Exports_{e} + X^{\prime}_{iedc}\Gamma + X^{\prime}_{dc}\Omega + X^{\prime}_{e}\Phi + \eta_{iedc}. \end{align} $$
In Equation (9), i represents individuals, e ethnic groups, d districts, and c countries. The dependent variable
 $Trust_{iedc}$
represents each of the variables measuring trust of relatives, neighbors, the local council, intragroup, and intergroup measured on a 0–3 ordinal scale—as measured in the Afrobarometer survey data.
 $\psi _{c}$
captures country fixed effects, and
 $Slave \ \ Exports_{e}$
indicates the number of slaves sold from a particular ethnic group e.Footnote
15
The various X vectors are individual, district, and ethnic group level control variables. Finally,
 $\eta _{iedc}$
is the error term.
Concerned about the possibility of omitted variables biasing these results, the authors undertake several strategies to identify the causal relationship between the slave trade and trust. One of these strategies is instrumental variable analysis, where the distance of an individual’s ethnic group from an ocean coast instruments for slave trade activity. The instrument approximates an ethnic group’s exposure to the slave trade and is unlikely to be correlated with factors that impact present-day trust. In this illustration, I will examine the results from the instrumental variable estimation strategy. The simulation results from the simple OLS specification do not change the core findings from this analysis and are shown in the Online Supplement.
In this section, I present three elements involved in performing this method to test for robustness to the cardinal treatment of ordinal variables. First, I comment on the results of the sufficient conditions derived by Schröder and Yitzhaki (Reference Schröder and Yitzhaki2017). These results are illustrated as graphs of LMA curves and shown in the Online Supplement. Second, I graphically report the set of effect estimates. These results are shown by plotting the point estimate and the associated confidence interval for a (relatively extreme) range of monotonic increasing transformations. Finally, I comment on calculating plausible bounds on the originally reported point estimates in the case that results are not robust to an extreme range of transformations.
Figure 3 shows the LMA curves for each of the five measures of trust and the variable of interest, the natural log of slave exports normalized by land area. In this figure, all but one of the LMA curves do not cross the horizontal axis. The LMA curve that does cross the horizontal axis, intergroup trust, does so for relatively high values of trust. For all other measures of trust, the LMA curves suggest a negative covariance with the natural log of slave exports over land area. Taken together, these graphical results suggest that, except for perhaps the effect on intergroup trust, the empirical findings of Nunn and Wantchekon (Reference Nunn and Wantchekon2011) pass the second theoretical sufficient condition of Schröder and Yitzhaki (Reference Schröder and Yitzhaki2017). Even so, the statistical significance of the findings or the overall magnitude of the results may be meaningfully affected by monotonic increasing transformations.
LMA curves with Afrobarometer measures of trust and the slave trade. Notes: This figure shows LMA curves between the five measures of trust gathered via the Afrobarometer survey and the natural log of slave exports normalized by land area (Nunn and Wantchekon Reference Nunn and Wantchekon2011). The y-axis is fixed between all graphs.

4.1 Graphical Results
Figures 4 and 5 show effect estimates for each of the two classes of transformations, for each of the five measures of trust in others, relating to the results reported in Table 5 of Nunn and Wantchekon (Reference Nunn and Wantchekon2011). The authors argue that the magnitudes of these estimated effects are economically meaningful. Specifically, a one standard deviation change in the intensity of the slave trade represents a
 $-$
1.10 to
 $-$
0.16 standard deviation change in each of the five different measures of trust in others. The authors also perform a variance decomposition to assess economic significance, as discussed below.
Effect sets for Nunn and Wantchekon (Reference Nunn and Wantchekon2011)—globally concave and convex transformations. Notes: The dark lines represent the point estimates for a given specification with the corresponding value of log(
 $\sigma $
). Logging the value of
 $\sigma $
allows for equal share of the graph to represent concave and convex transformations. Lighter lines represent 95% confidence interval calculated with standard errors clustered by ethnicity. Each panel refers to a different specification used in Table 5 of Nunn and Wantchekon (Reference Nunn and Wantchekon2011). Panel A refers to column (1) with the dependent variable trust of relatives. Panel B refers to column (2) with the dependent variable trust of neighbors. Panel C refers to column (3) with the dependent variable trust of local council. Panel D refers to column (4) with the dependent variable intragroup trust. Finally, Panel E refers to column (5) with the dependent variable intergroup trust.

Effect sets for Nunn and Wantchekon (Reference Nunn and Wantchekon2011)—transformations with an inflection point. Notes: The dark lines represent the point estimates for a given specification with the corresponding sigma value. Lighter lines represent 95% confidence interval calculated with standard errors clustered by ethnicity. Each panel refers to a different specification used in Table 5 of Nunn and Wantchekon (Reference Nunn and Wantchekon2011), presenting instrumental variable estimation results. Panel A refers to column (1) with the dependent variable trust of relatives. Panel B refers to column (2) with the dependent variable trust of neighbors. Panel C refers to column (3) with the dependent variable trust of local council. Panel D refers to column (4) with the dependent variable intragroup trust. Finally, Panel E refers to column (5) with the dependent variable intergroup trust.

4.1.1 Globally Concave and Convex Transformations
Figure 4 shows estimated effect sets based on globally concave and convex transformations of specifications using each of the five measures of trust as dependent variables. The central finding of Nunn and Wantchekon (Reference Nunn and Wantchekon2011) is that individuals whose ancestors were heavily impacted by the slave trade are less trusting today. This qualitative result largely persists for the entire range of these (relatively extreme) transformations. There is no alternative transformation that changes the sign on any of the estimated coefficients.
Moreover, for three out of five specifications, the effects remain statistically significant for the full range of transformations. The two exceptions are the effects of the slave trade on trust of the local council and intergroup trust, which both become statistically insignificant for convex transformations. While discussing magnitude, the authors perform a variance decomposition and find that, along with the other covariates, slave exports explain 5.4% of the total variation of trust in neighbors. Additionally, of this 5.4%, about 16% is explained by slave exports. Results from the simulation analysis show that over all values of log(
 $\sigma $
), along with the other covariates, slave exports explain between 4.2% and 5.4% of the total variation of trust in neighbors. Furthermore, of this 4.2%–5.4%, roughly 16% is consistently explained by slave exports. Therefore, despite concerns about the invalid cardinal treatment of ordinal variables, the results of Nunn and Wantchekon (Reference Nunn and Wantchekon2011) are robust even relatively extreme transformations of the ordinal scale measuring trust.
4.1.2 Transformations with an Inflection Point
As discussed above, an alternative class of transformations are those with an inflection point. Figure 5 shows estimated effect sets based on transformations with an inflection point for the instrumental variable estimates from Nunn and Wantchekon (Reference Nunn and Wantchekon2011). Similar to the effect sets based on globally concave and convex transformations, the empirical findings of Nunn and Wantchekon (Reference Nunn and Wantchekon2011) are robust to a class of transformations with an inflection point. For all transformations, none of the coefficient estimates change sign. This is consistent with the theoretical conditions of Schröder and Yitzhaki (Reference Schröder and Yitzhaki2017). Moreover, with the exception Panel A, referring to the effect on trust with neighbors, all coefficient estimates are statistically significant for all CDF transformations. In Panel A, the estimate becomes statistically insignificant for
 $\sigma $
values close to zero, when the transformation resembles a step function and is essentially a binary indicator variable identifying if respondents trust their relatives or not. Finally, the magnitude of the coefficient estimates themselves are also relatively robust to these (relatively extreme) transformations.
4.2 Plausible Effect Bounds
So far, the range of alternative transformations could be characterized as relatively extreme. In the case of the globally concave and convex transformations, the range is defined by any
 $\sigma \in [0.1, 10]$
. A transformation associated with
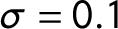 $\sigma =0.1$
implies that moving from a reported trust score of 1—on the 0–3 ordinal scale—measures a massive relative change in latent trust, while a transformation associated with
 $\sigma =10$
implies only moving from a reported trust score of 3 to a score of 4 measures any noticeable relative change in latent trust. In the case of transformations with an inflection point, the range extends from transformations suggesting a step function to transformations that are roughly linear. Step-function transformations imply that the only useful information embedded within the trust score relating to latent trust is whether or not the respondent reports a trust score of greater than 2. A roughly linear transformation, on the other hand, implies that each trust score represents an equal marginal gain in latent trust. In both of these cases, the range of alternative monotonic increasing transformations likely represent transformations that are implausible in this specific empirical setting.
As noted above, however, the estimated effect sets reported in Figures 4 and 5 show that the results of Nunn and Wantchekon (Reference Nunn and Wantchekon2011) are robust to these relatively extreme and likely implausible transformations. This finding of robustness to extreme transformations provides evidence supporting the cardinal treatment of ordinal variables.Footnote 16
This method requires one additional step in applications where estimated effects are not robust to a relatively extreme set of transformations—as is the case when reanalyzing the results from Aghion et al. (Reference Aghion, Akcigit, Deaton and Roulet2016) and Bond and Lang (Reference Bond and Lang2013), shown in the Online Supplement. The task then is to determine a plausible range of transformations and, therefore, plausible bounds on the estimated effects.
What is a plausible transformation of the ordinal scale in these empirical contexts? In the case of Aghion et al. (Reference Aghion, Akcigit, Deaton and Roulet2016), the work of Kaiser and Vendrik (Reference Kaiser and Vendrik2019), who focus on assessing the plausibility of transformations to subjective well-being and happiness scales, is instructive. Kaiser and Vendrik (Reference Kaiser and Vendrik2019) cite three studies that experimentally aim to identify the functional form of the reporting function defining the relationship between subjective feelings and objective reality. Empirical analysis reported by Oswald (Reference Oswald2008) cannot reject that the reporting function is linear—if it is curved at all, it is slightly concave. Additionally, results found by Van Praag (Reference Van Praag1991) and Banks and Coleman (Reference Banks and Coleman1981) cannot rule out the finding that individuals in their study use a linear reporting function on average. Although these cited studies provide some suggestive evidence that assuming a linear reporting function may indeed be valid, this likely will be considered a relatively strong assumption. Assuming linearity of the reporting function leads to more precise effect estimates, but ultimately with less credibility.
Based on this assessment, Table A1 in the Online Supplement reports plausible bounds on the effect estimates for the results of Aghion et al. (Reference Aghion, Akcigit, Deaton and Roulet2016) based on transformations associated with
 $\sigma \in [0.4, 2.5]$
. This range of plausible transformations allows for both concave and convex transformations, but only transformations such that response categories are only 10 times larger on opposite ends of the scale.Footnote
17
As shown in the Online Supplement, when limiting alternative transformations to this more limited plausible range, I find that the set of effects extend from a small and statistically insignificant effect to an effect that is statistically significant and almost 50% larger than that originally reported. Thus, the results of Aghion et al. (Reference Aghion, Akcigit, Deaton and Roulet2016) are not robust to even plausible transformations of the ordinal scale measuring subjective well-being.
In the case of Bond and Lang (Reference Bond and Lang2013), the work of Reardon (Reference Reardon2008), and specifically insights from applying IRT results to the Early Childhood Longitudinal Study-Kindergarten (ECLS-K) data, provide structure for an assessment of plausible transformations. In particular, Reardon (Reference Reardon2008) estimates IRT parameters indicating how each question on the ECLS-K test predicts student learning.Footnote
18
The author finds that roughly 40% of the questions in the ECLS-K have a relatively high likelihood of predicting no information about student learning. Most fundamentally, this suggests that the relationship between the observed test score and student learning is unlikely to be linear. It also suggests that at low (high) test score levels, the marginal gain in student learning is relatively small (high). Taken together, this suggests that transformations with an inflection point are less plausible in the context of test scores, and implies that a plausible reporting function is convex to some degree. To what degree? Assuming that 40% of the questions could be answered correctly by guessing suggests that a
 $\sigma $
value of 5 is relatively plausible.Footnote
19
Therefore, a plausible range of transformations extends from
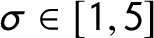 $\sigma \in [1, 5]$
. As shown in the Online Supplement, when limiting alternative transformations to this more limited plausible range, I find the set of estimates largely replicates the core findings of Bond and Lang (Reference Bond and Lang2013) and support the fragility of these results to transformations of the test score scale.
This discussion demonstrates how this method can be used to test for robustness of effect estimates to the cardinal treatment of ordinal variables. As the supplemental illustrations shown in the Online Supplement highlight, this method can apply to virtually any variable that cannot be directly observed and must be quantitatively measured on an ordinal scale.
5 Conclusion
This paper builds off recent contributions of Schröder and Yitzhaki (Reference Schröder and Yitzhaki2017) and Bond and Lang (Reference Bond and Lang2019) on the appropriateness of the cardinal statistical treatment of ordinal variables. I develop a partial identification method for testing the robustness of empirical estimates to a set of monotonic increasing transformations of the ordinal scale. This approach allows for the calculation of a set of plausible effect estimates based on a range of assumptions about the cardinal properties of an ordinal variable. To illustrate this method, I re-examine the effect of the slave trade on trust in sub-Saharan Africa (Nunn and Wantchekon Reference Nunn and Wantchekon2011). Supplemental illustrations include analysis on the effect of creative destruction on subjective well-being (Aghion et al. Reference Aghion, Akcigit, Deaton and Roulet2016) and the evolution of the black–white test score gap (Bond and Lang Reference Bond and Lang2013).
The empirical applications clarify three empirical points that extend existing theoretical insights (Schröder and Yitzhaki Reference Schröder and Yitzhaki2017). First, failing existing theoretical tests for the valid cardinal treatment of ordinal variables may not be a serious problem in practice, because it may be the case that only extreme monotonic increasing transformations substantially change empirical results. Second, passing existing theoretical tests does not necessarily imply that empirical results are robust, because the size of estimated coefficients could change dramatically for monotonic increasing transformations. Third, passing existing theoretical tests does not imply that the statistical significance of results is robust to monotonic increasing transformations of the ordinal scale, even if the size of the coefficient estimates are relatively robust.
These findings carry implications for future empirical research, which necessitates the use of ordinal variables. Inevitably, as social science research extends itself into realms of society, the economy, and politics where factors cannot be quantitatively measured or directly observed, the need to use ordinal variables becomes increasing frequent. This situation presents a challenge to researchers regarding empirical methodology. The research builds of the recent work of Schröder and Yitzhaki (Reference Schröder and Yitzhaki2017) and Bond and Lang (Reference Bond and Lang2019), who show that it is no longer valid to assume that the ordinality or cardinality of ordinal variables makes no qualitative difference. The cardinal treatment of ordinal variables can lead to incorrect empirical findings. Although some empirical findings may be robust to alternative monotonic increasing transformations, many will not be.
Acknowledgments
I thank the editor and three anonymous reviewers for constructive feedback on this paper. The findings and conclusions of this paper are mine and should not be construed to represent any official USDA or U.S. Government determination or policy. This research was conducted prior to my employment with the USDA. All remaining errors are my own.
Supplementary Material
For supplementary material accompanying this paper, please visit https://doi.org/10.1017/pan.2020.55. Replication code for this article has been published in Code Ocean, a computational reproducibility platform that enables users to run the code and can be viewed interactively at https://doi.org/10.24433/CO.2966972.v1 (Bloem Reference Bloem2020a). A preservation copy of the same code and data can also be accessed via Dataverse at https://doi.org/10.7910/DVN/VWURHG (Bloem Reference Bloem2020b).