1. Introduction
Initial subduction refers to the first sinking of oceanic lithosphere into the mantle, when the subduction zone still has the thermal structure of an unstable state (Agard et al. Reference Agard, Yamato, Soret, Prigent, Guillot, Plunder, Dubacg, Chauvet and Monie2016). With respect to the initial subduction of an ancient ocean, the oldest supra-subduction zone (SSZ-type) ophiolite, island-arc igneous rocks and subduction-related metamorphic rocks in accretionary complexes can provide important constraints on the timing of initial subduction (Guilmette et al. Reference Guilmette, Smit and van Hinsbergen2018; Stern & Taras, Reference Stern and Taras2018).
The Central Asian Orogenic Belt (CAOB) between the Siberian Craton and the Tarim–North China Craton is one of the largest accretionary orogenic belts on Earth, and its formation was closely related to the evolution of Neoproterozoic–Palaeozoic Palaeo-Asian Ocean (PAO) (Fig. 1a; Xiao et al. Reference Xiao, Windley, Hao and Zhai2003, Reference Xiao, Windley, Sun, Li, Huang, Han, Yuan, Sun and Chen2015; Kröner et al. Reference Kröner, Windley, Badarch, Tomurtogoo, Hegner, Jahn, Gruschka, Khain, Demoux, Wingate, Hatcher, Carlson, McBride and Martínez Catalán2007; Windley et al. Reference Windley, Alexeiev, Xiao, Kröner and Badarch2007). The subduction of the northern PAO was initiated prior to c. 1000 Ma, SSZ-type ophiolites at 1020–1017 Ma (Khain et al. Reference Khain, Bibikova, Kröner, Zhuravlev, Sklyarov, Fedotova and Kravchenko-Berezhnoy2002; Turkina et al. Reference Turkina, Nozhkin, Bibikova, Zhuravlev and Travin2004) and arc-complex at 972–826 Ma (Nekrasov et al. Reference Nekrasov, Rodionov, Berezhnaya, Sergeev, Ruzhentsev, Minina and Golionko2007; Gordienko et al. Reference Gordienko, Bulgatov, Lastochkin and Sitnikova2009; Kröner et al. Reference Kröner, Fedotova, Khain, Razumovskiy, Orlova, Anosova, Perelyaev, Nekrasov and Liu2015). Subduction of the southern PAO initiated later; the earliest SSZ-type ophiolites at 572–512 Ma (Kröner et al. Reference Kröner, Windley, Badarch, Tomurtogoo, Hegner, Jahn, Gruschka, Khain, Demoux, Wingate, Hatcher, Carlson, McBride and Martínez Catalán2007; Ryazantsev et al. Reference Ryazantsev, Degtyarev, Kotov, Sal’nikova, Anisimova and Yakovleva2009; Xu et al. Reference Xu, Han, Ren, Zhou, Zhang, Chen and Liu2012; Yang et al. Reference Yang, Li, Santosh, Gu, Yang, Zhang, Wang, Zhong and Tong2012 a; Liu et al. Reference Liu, Han, Xu, Ren and Chen2020), island-arc plutons at 572–495 Ma (Kröner et al. Reference Kröner, Windley, Badarch, Tomurtogoo, Hegner, Jahn, Gruschka, Khain, Demoux, Wingate, Hatcher, Carlson, McBride and Martínez Catalán2007; Alexeiev et al. Reference Alexeiev, Ryazantsev, Kröner, Tretyakov, Xia and Liu2011; Konopelko et al. Reference Konopelko, Kullerud, Apayarov, Sakiev, Baruleva, Ravna and Lepekhina2012, Reference Konopelko, Seltmann, Dolgopolova, Safonova, Glorie, De Grave and Sun2021; Xu et al. Reference Xu, Han, Ren, Zhou, Zhang, Chen and Liu2012, Reference Xu, Han, Ren, Zhou and Su2013 b; Ren et al. Reference Ren, Han, Xu, Zhou, Liu, Zhang, Chen, Su, Li, Li and Li2014; Zheng et al. Reference Zheng, Han, Liu and Wang2019) and subduction-related metamorphic rocks at 509–458 Ma (Zhang, Reference Zhang1997; Tagiri et al. Reference Tagiri, Takiguchi, Ishida, Noguchi, Kimura, Bakirov, Sakiev, Takahashi, Takasu, Bakirov, Togonbarva and Suzuki2010; Alexeiev et al. Reference Alexeiev, Ryazantsev, Kröner, Tretyakov, Xia and Liu2011; Meyer et al. Reference Meyer, Klemd and Konopelko2013; Konopelko & Klemd, Reference Konopelko and Klemd2016; Liu et al. Reference Liu, Han, Xu, Ren, Zhang, Zhou, Su and Li2016) in Kazakhstan–Kyrgyzstan Northern Tianshan and West Junggar region of China. The evidence of Ediacaran subduction has only been published more recently (Zheng et al. Reference Zheng, Han, Liu and Wang2019; Liu et al. Reference Liu, Han, Xu, Ren and Chen2020); it is therefore necessary to further explore the initial subduction of the southern PAO.
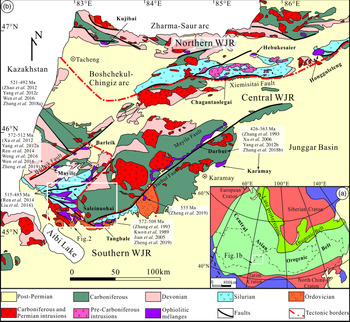
(a) Tectonic division of the CAOB (modified from Han et al. Reference Han, He and Guo2010) with the approximate location of (b) shown in inset. (b) Tectonic map of the West Junggar region (modified from BGMRXUAR, 1993) with the approximate location of Figure 2. WJR – West Junggar region.

The West Junggar region, northwestern China, is located in the southwestern part of the CAOB, and its accretionary process was closely related to the subduction of the Junggar Ocean, an important southern branch of the PAO (Fig. 1b; Han et al. Reference Han, Ji, Song, Chen and Zhang2006, Reference Han, He and Guo2010; Windley et al. Reference Windley, Alexeiev, Xiao, Kröner and Badarch2007; Xiao et al. Reference Xiao, Han, Yuan, Sun, Lin, Chen, Li, Li and Shu2008). The Barleik–Mayile–Tangbale accretionary complexes in southern West Junggar are thought to represent the earliest part related to subduction of the Junggar Ocean (Liu et al. Reference Liu, Han, Xu, Ren and Chen2020), with the oldest subduction-related amphibolite of 504 Ma and blueschist of 502 Ma (Liu et al. Reference Liu, Han, Xu, Ren, Zhang, Zhou, Su and Li2016), SSZ-type gabbro of 572 Ma (Yang et al. Reference Yang, Li, Santosh, Gu, Yang, Zhang, Wang, Zhong and Tong2012 a; Liu et al. Reference Liu, Han, Xu, Ren and Chen2020) and island-arc diorite of 572 Ma (Zheng et al. Reference Zheng, Han, Liu and Wang2019), suggesting the initial intra-oceanic subduction of the Junggar Ocean during the Ediacaran Period (Zheng et al. Reference Zheng, Han, Liu and Wang2019; Liu et al. Reference Liu, Han, Xu, Ren and Chen2020). However, there is no consensus about the subduction process and polarity, with possible S-directed (Liu et al. Reference Liu, Han, Xu, Ren, Zhang, Zhou, Su and Li2016; Wen et al. Reference Wen, Zhao, Liu and Liu2016; Zhang et al. Reference Zhang, Wang, Polat, Zhu, Shen, Chen, Chen, Guo, Wu and Liu2018 b) or N-directed (Choulet et al. Reference Choulet, Faure, Cluzel, Chen, Lin, Wang and Xu2016) subduction, which would result in three isolated intra-oceanic arcs (Xu et al. Reference Xu, Han, Ren, Zhou, Zhang, Chen and Liu2012, Reference Xu, Han, Ren, Zhou and Su2013 b; Ren et al. Reference Ren, Han, Xu, Zhou, Liu, Zhang, Chen, Su, Li, Li and Li2014) or one single intra-oceanic arc (Choulet et al. Reference Choulet, Faure, Cluzel, Chen, Lin, Wang and Xu2016; Liu et al. Reference Liu, Han, Xu, Ren, Zhang, Zhou, Su and Li2016; Wen et al. Reference Wen, Zhao, Liu and Liu2016; Zhang et al. Reference Zhang, Wang, Polat, Zhu, Shen, Chen, Chen, Guo, Wu and Liu2018 b).
In this paper, we present new whole-rock chemical data and zircon U–Pb ages from four adakitic and two non-adakitic igneous rocks as tectonic blocks in the Barleik–Mayile–Tangbale accretionary complexes, and one gabbro enclave in an adakitic block in order to further discuss the initial subduction and evolution of the Junggar Ocean during Ediacaran–Cambrian time.
2. Geological background
The West Junggar region is usually divided into northern, central and southern parts (Fig. 1b; Choulet et al. Reference Choulet, Cluzel, Faure, Lin, Wang, Chen, Wu and Ji2012; Liu et al. Reference Liu, Han, Xu, Ren and Chen2020). The northern West Junggar region is characterized by the E–W-striking Zharma–Saur arc in the north and Boshchekul–Chingiz arc in the south, separated by the Kujibai–Hebukesaier–Hongguleleng ophiolitic mélange belt (Chen et al. Reference Chen, Han, Ji, Zhang, Xu, He and Wang2010, Reference Chen, Han, Zhang, Xu, Liu, Qu, Li, Yang and Yang2015; Yang et al. Reference Yang, Zhao, Zheng and Xu2019 b). The Zharma–Saur arc may be traced for up to c. 600 km from northeastern Kazakhstan to northwestern China and is mainly composed of Late Devonian – Early Carboniferous arc igneous rocks, which was formed by S-wards subduction of the Irtysh–Zaisan Ocean, another southern branch of the PAO (Fig. 1b; Windley et al. Reference Windley, Alexeiev, Xiao, Kröner and Badarch2007; Chen et al. Reference Chen, Han, Ji, Zhang, Xu, He and Wang2010, Reference Chen, Han, Zhang, Xu, Liu, Qu, Li, Yang and Yang2015). The Boshchekul–Chingiz arc (Fig. 1b) extends W-wards to the Boshchekul region in central Kazakhstan and is characterized by the Cambrian – Early Devonian arc igneous rocks (Chen et al. Reference Chen, Han, Ji, Zhang, Xu, He and Wang2010; Xiao et al. Reference Xiao, Windley, Sun, Li, Huang, Han, Yuan, Sun and Chen2015) related to either N-wards subduction of the Junggar Ocean (Choulet et al. Reference Choulet, Cluzel, Faure, Lin, Wang, Chen, Wu and Ji2012; Chen et al. Reference Chen, Han, Zhang, Xu, Liu, Qu, Li, Yang and Yang2015) or S-wards subduction of the Irtysh–Zaisan ocean (Shen et al. Reference Shen, Shen, Li, Pan, Zhu, Meng and Dai2012; Yin et al. Reference Yin, Chen, Xiao, Yuan, Windley, Yu and Cai2015). The Kujibai–Hebukesaier–Hongguleleng ophiolitic mélange belt comprises gabbros and basalts with normal mid-ocean-ridge basalt (N-MORB) affinities (Du & Chen, Reference Du and Chen2017; Yang et al. Reference Yang, Zhao, Zheng and Xu2019 b) and island-arc tholeiitic diabases and basalts (She et al. Reference She, Deng, Liu, Gao and Di2016; Liu et al. Reference Liu, Han, Xu, Ren and Chen2020). The gabbros and plagiogranite yield zircon U–Pb ages of 515–472 Ma (She et al. Reference She, Deng, Liu, Gao and Di2016; Du & Chen, Reference Du and Chen2017; Yang et al. Reference Yang, Zhao, Zheng and Xu2019 b), implying the presence of a Cambrian–Ordovician ocean basin (Du & Chen, Reference Du and Chen2017; Yang et al. Reference Yang, Zhao, Zheng and Xu2019 b) or back-arc basin (She et al. Reference She, Deng, Liu, Gao and Di2016) between the Zharma–Saur and Boshchekul–Chingiz arcs. Both arcs and intervening ophiolitic mélange belt were intruded by Late Carboniferous – Permian plutons (Fig. 1b; Chen et al. Reference Chen, Han, Ji, Zhang, Xu, He and Wang2010).
The central West Junggar region is separated from the northern West Junggar region by the Chagantaolegai ophiolitic mélange along the Xiemisitai Fault (Fig. 1b; Chen et al. Reference Chen, Han, Zhang, Xu, Liu, Qu, Li, Yang and Yang2015; Liu et al. Reference Liu, Han, Xu, Ren and Chen2020) and composed of the Devonian – Early Carboniferous subduction-related volcano-sedimentary rocks (Xu et al. Reference Xu, Han, Ren, Zhou and Su2013 b), which are intruded by Upper Carboniferous – lower Permian plutons (Fig. 1b; Han et al. Reference Han, Ji, Song, Chen and Zhang2006). The Late Silurian – Devonian Karamay and Darbut ophiolitic mélanges are dispersed along the NE-trending faults near the NW margin of the Junggar Basin (Fig. 1b; Zhang et al. Reference Zhang, Xiao, Luo, Chen, Windley, Song, Han and Safonova2018 a) and dominated by diverse tectonic blocks, including N-MORB, enriched mid-ocean-ridge basalt (E-MORB) and arc-like gabbros of age 426–363 Ma (Xu et al. Reference Xu, He, Li, Ding, Liu and Mei2006; Yang et al. Reference Yang, Li, Santosh, Yang, Yan, Zhang and Tong2012 b; Zhang et al. Reference Zhang, Wang, Polat, Zhu, Shen, Chen, Chen, Guo, Wu and Liu2018 b) and Late Devonian radiolarian-bearing cherts (Zong et al. Reference Zong, Wang, Jiang and Gong2016). These blocks are considered to have been welded together during the terminative oceanic subduction (Xu et al. Reference Xu, Ji, Zhao, Gong, Zhou and He2013 a; Li et al. Reference Li, He, Qi and Zhang2015).
The southern West Junggar region consists mainly of Ordovician–Silurian accretionary complexes (Fig. 1b; Windley et al. Reference Windley, Alexeiev, Xiao, Kröner and Badarch2007; Xiao et al. Reference Xiao, Han, Yuan, Sun, Lin, Chen, Li, Li and Shu2008; Han et al. Reference Han, He and Guo2010), including SSZ-type ophiolitic mélanges scattered in Barleik, Mayile, Saleinuohai and Tangbale Mountains, and are unconformably overlain by Middle Devonian – Lower Carboniferous volcanic-sedimentary sequences (Ren et al. Reference Ren, Han, Xu, Zhou, Liu, Zhang, Chen, Su, Li, Li and Li2014; Wu et al. Reference Wu, Hong, Xu, Cao, Li, Zhang, You, Ke and Dong2018). The accretionary complexes and overlying sequences were intruded by Late Carboniferous-Permian plutons (Xu et al. Reference Xu, Han, Ren, Zhou, Zhang, Chen and Liu2012; Ren et al. Reference Ren, Han, Xu, Zhou, Liu, Zhang, Chen, Su, Li, Li and Li2014; Liu et al. Reference Liu, Han, Ren, Chen, Wang and Zheng2017) and crosscut by NE–SW-striking faults (Fig. 1b).
2.a. Tangbale ophiolitic mélange
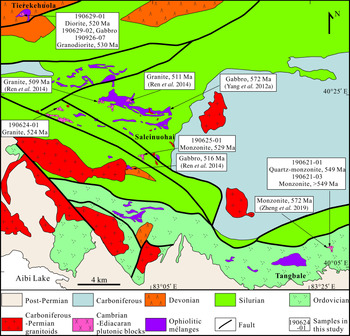
The Tangbale ophiolitic mélange is distributed in the Middle Ordovician Kekeshayi Formation and unconformably overlain by the Silurian turbidites (Fig. 2; Choulet et al. Reference Choulet, Cluzel, Faure, Lin, Wang, Chen, Wu and Ji2012; Zheng et al. Reference Zheng, Han, Liu and Wang2019). The mélange is characterized by various blocks in serpentinite matrix, including serpentinized peridotite, pyroxenite, basalt, gabbro, chert and blueschist (Zhang et al. Reference Zhang, Zhai, Allen, Sanuders, Wang and Huang1993; Buckman & Aitchison, Reference Buckman and Aitchison2001; Liu et al. Reference Liu, Han, Xu, Ren and Chen2020). The gabbros yield a zircon U–Pb age of 531 ± 15 Ma (Jian et al. Reference Jian, Liu, Shi, Zhang and Sklyarov2005) and a sphene Pb–Pb age of 523 ± 7 Ma (Kwon et al. Reference Kwon, Tilton, Coleman and Feng1989), the cherts contain Middle Ordovician radiolarians (Buckman & Aitchison, Reference Buckman and Aitchison2001) and the blueschists give sodium (Na) amphibole 40Ar/39Ar ages of 470–458 Ma (Zhang, Reference Zhang1997). The gabbros show SSZ affinities, but the basalts have both island-arc basalt (IAB) and ocean-island basalt (OIB) features (BK Yang, unpub. M.Sc. thesis, Chang’an University, 2011). Recently, diorites with zircon U–Pb ages of 572–555 Ma and arc affinities are thought to be related to the initial subduction of the Junggar Ocean (Zheng et al. Reference Zheng, Han, Liu and Wang2019).
Geological map of the study area (modified from BGMRXUAR, 1993; Ren et al. Reference Ren, Han, Xu, Zhou, Liu, Zhang, Chen, Su, Li, Li and Li2014) and sample locations.

2.b. Mayile ophiolitic mélange
The Mayile ophiolitic mélange occurs in the Saleinuohai Mountain in the south and the Mayile Mountain in the north, and is surrounded by the Middle–Upper Silurian volcanic-sedimentary sequences (Figs 1b, 2; Wang et al. Reference Wang, Sun, Li, Hou, Qin, Xiao and Hao2003; Xu et al. Reference Xu, Han, Ren, Zhou, Zhang, Chen and Liu2012). The mélange consists of serpentinized peridotite (harzburgite, lherzolite and dunite), gabbro, pyroxenite, basalt, chert, greenschist, blueschist and amphibolite blocks in serpentinite matrix (Xu et al. Reference Xu, Han, Ren, Zhou, Zhang, Chen and Liu2012; Ren et al. Reference Ren, Han, Xu, Zhou, Liu, Zhang, Chen, Su, Li, Li and Li2014; Liu et al. Reference Liu, Han, Xu, Ren and Chen2020). The SSZ-type gabbros yield zircon U–Pb ages of 572–512 Ma (Xu et al. Reference Xu, Han, Ren, Zhou, Zhang, Chen and Liu2012, Reference Xu, Han, Ren, Zhou and Su2013 b; Yang et al. Reference Yang, Li, Santosh, Gu, Yang, Zhang, Wang, Zhong and Tong2012 a; Ren et al. Reference Ren, Han, Xu, Zhou, Liu, Zhang, Chen, Su, Li, Li and Li2014; Weng et al. Reference Weng, Xu, Ma, Chen, Sun and Zhang2016). By contrast, the pillow basalts with OIB affinities (Yang et al. Reference Yang, Li, Santosh, Gu, Yang, Zhang, Wang, Zhong and Tong2012 a, Reference Yang, Li, Xiao and Tong2015 a) yield zircon U–Pb ages of 437–433 Ma (Yang et al. Reference Yang, Li, Tong, Wang and Xu2019 a) and may be the remnants of seamounts near an ocean ridge (Yang et al. Reference Yang, Li, Santosh, Gu, Yang, Zhang, Wang, Zhong and Tong2012 a). In addition, this mélange contains two groups of arc plutons – c. 510 Ma low-K tholeiitic in an immature island arc and c. 490 Ma medium-K calc-alkaline in a mature island arc – as the products of S-directed subduction of the Junggar Ocean (Xu et al. Reference Xu, Han, Ren, Zhou, Zhang, Chen and Liu2012; Ren et al. Reference Ren, Han, Xu, Zhou, Liu, Zhang, Chen, Su, Li, Li and Li2014; Weng et al. Reference Weng, Xu, Ma, Chen, Sun and Zhang2016).
2.c. Barleik ophiolitic mélange
The Barleik ophiolitic mélange is dispersed along the south side of the Barleik Fault, with the southernmost occurrence at Tierekehuola (Fig. 1b; Zhao et al. Reference Zhao, Jia, Wen and Li2012; Wen et al. Reference Wen, Zhao, Liu and Liu2016; Zhang et al. Reference Zhang, Xiao, Luo, Chen, Windley, Song, Han and Safonova2018 a). The mélange consists of various blocks, including peridotite, clinopyroxenite, gabbro, pillow lava, greenschist, blueschist, amphibolite, marble, and quartzite (Xu et al. Reference Xu, Han, Ren, Zhou, Zhang, Chen and Liu2012; Zhao et al. Reference Zhao, Jia, Wen and Li2012; Liu et al. Reference Liu, Han, Xu, Ren, Zhang, Zhou, Su and Li2016). The SSZ-type gabbroic blocks yield zircon U-Pb ages of 521-502 Ma (Xu et al. Reference Xu, Han, Ren, Zhou, Zhang, Chen and Liu2012; Yang et al. Reference Yang, Li, Yang, Wang, Zhang and Tong2012 c; Wen et al. Reference Wen, Zhao, Liu and Liu2016; Zhang et al. Reference Zhang, Xiao, Luo, Chen, Windley, Song, Han and Safonova2018 a) and the OIB-type pillow lavas are comparable to the seamount basalts in the Mayile ophiolitic mélange (Xu et al. Reference Xu, Han, Ren, Zhou, Zhang, Chen and Liu2012, Reference Xu, Han, Ren, Zhou and Su2013 b, Yang et al. Reference Yang, Li, Santosh, Gu, Yang, Zhang, Wang, Zhong and Tong2012 a; Liu et al. Reference Liu, Han, Xu, Ren and Chen2020). In addition, a few intermediate to felsic arc plutons with zircon U–Pb ages of 509–503 Ma are also dispersed in the region (Xu et al. Reference Xu, Han, Ren, Zhou and Su2013 b). The blueschist with a phengite 40Ar/39Ar age of 492 Ma, and garnet-bearing amphibolite with a rutile SIMS U–Pb age of 502 Ma and an Na-amphibole 40Ar/39Ar age of 504 Ma, represent the oldest records of subduction metamorphism of the Junggar Ocean (Liu et al. Reference Liu, Han, Xu, Ren, Zhang, Zhou, Su and Li2016).
3. Samples and their petrography
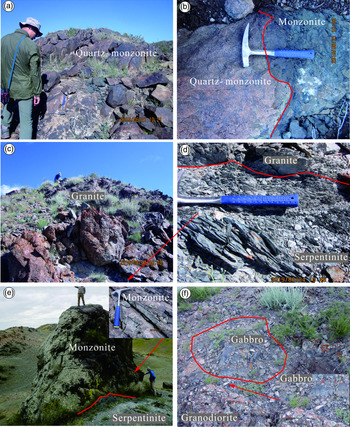
Six igneous tectonic blocks in the Tangbale, Saleinuohai and Tierekehuola areas were investigated (Fig. 2), and occur as isolated blocks in either serpentinites or accretionary complexes (Fig. 3). These igneous tectonic blocks and one gabbro enclave in the Tierekehuola granodiorite were sampled for whole-rock chemical analyses and zircon U–Pb dating. According to their chemical features, the igneous tectonic blocks can be divided into adakitic and non-adakitic subgroups.
Field photographs showing (a) Tangbale quartz-monzonite; (b) the relationship between quartz-monzonite and monzonite in Tangbale; the relationship between granite and serpentinite in the Saleinuohai (c, d); (e) Saleinuohai monzonite; and (f) granodiorite and gabbro enclave in the Tierekehuola.

3.a. Adakitic group
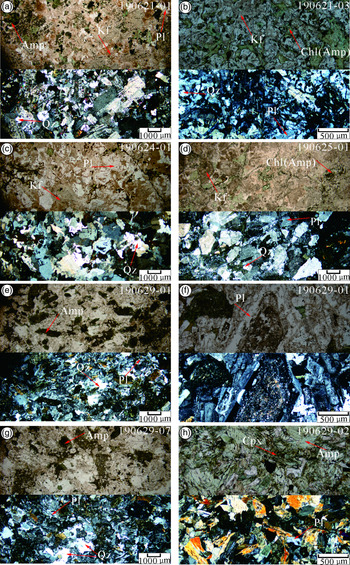
From south to north, the adakitic group includes Tangbale monzonite (190621-03; Fig. 3b) and Saleinuohai monzonite (190625-01; Fig. 3e), and Tierekehuola diorite (190629-01) and granodiorite (190929-07) (Fig. 3f). The Saleinuohai monzonite is grey and fine to medium-grained, and the Tangbale monzonite is dark grey and fine-grained; both are composed of plagioclase (40–50%), potassium (K) feldspar (25–30%), amphibole (20–25%) and minor quartz (< 5%) (Fig. 4b, d). The grey, fine to medium-grained diorite consists of plagioclase (c. 65%), amphibole (c. 30%), quartz (c. 3%) and minor accessory minerals (Fig. 4e), and the plagioclase shows a typical zoned texture (Fig. 4f). The granodiorite is reddish, has the same texture as diorite and comprises plagioclase (c. 50%), quartz (c. 30%), amphibole (c. 15%) and minor accessory minerals (Fig. 4g). All K-feldspar and plagioclase are partially subjected to kaolinization and/or sericitization with a turbid appearance.
Representative plane-polarized (upper part) and cross-polarized (lower part) photomicrographs of (a) Tangbale quartz-monzonite, (b) Tangbale monzonite, (c) Saleinuohai granite, (d) Saleinuohai monzonite, (e) Tierekehuola diorite, (f) plagioclase zoning in Tierekehuola diorite, (g) Tierekehuola granodiorite and (h) Tierekehuola gabbro. Amp – amphibole; Chl – chlorite; Cpx – clinopyroxene; Kf – potassium feldspar; Pl – plagioclase; Qz – quartz.

3.b. Non-adakitic group
The non-adakitic group comprises Tangbale quartz-monzonite (190621-01; Fig. 3a) and Saleinuohai granite (190624-01; Fig. 3c, d). The non-adakitic quartz-monzonite intruded adakitic monzonite in Tangbale, which generates a chilled border on non-adakitic quartz-monzonite and a baked border on adakitic monzonite (Fig. 3b). The quartz-monzonite is reddish and fine- to medium-grained and consists of plagioclase (c. 40%), K-feldspar (c. 30%), amphibole (c. 15%), quartz (c. 10%) and minor accessory minerals (Fig. 4a). The granite is flesh pink in colour and fine- to medium-grained, with a mineral assemblage of plagioclase (c. 45%), K-feldspar (c. 30%), quartz (c. 20%) and minor accessory minerals (Fig. 4c). The granite intruded the serpentinite, resulting in silication of serpentinite in the contact zone (Fig. 3c, d).
3.c. Gabbro enclave
Gabbro (190629-02) is composed of clinopyroxene (c. 50%), plagioclase (c. 30%), amphibole (c. 10%) and minor accessory minerals (Fig. 4h).
4. Analytical methods
4.a. Zircon U–Pb dating
The mounts for zircon U–Pb dating were prepared at the Beijing Kuangyan Geoanalysis Laboratory Co. Ltd. Zircon grains were separated by crushing, heavy liquid and magnetic techniques, then picked out and embedded in an epoxy mount, and polished to expose about half of the grains. Cathodoluminescence (CL) images of zircons were photographed by a Tescan Mira3 Scanning Electron Microscope at the Beijing Kuangyan Geoanalysis Laboratory Co. Ltd, to reveal their internal structures. The spots with no cracks and inclusions were selected on CL, reflected and transmitted images for dating. U–Pb dating was conducted on laser ablation inductively coupled plasma mass spectrometry (LA-ICP-MS) at the Key Laboratory of Regional Geology and Mineralization, Hebei GEO University, in Shijiangzhuang. The system couples a quadrupole ICP-MS (THERMO-ICAPRQ) and 193-nm ArF Excimer laser (RESOlution-LR) with Laurin Technic S155 sample chamber and GeoStar μGISTM software. The ablation was taken under a designed condition with 29 μm laser beam spot, 3 J cm–2 laser energy density and 8 Hz frequency. Zircon standard 91500 and Plesovice were used as an external standard (Sláma et al. Reference Sláma, Kosler, Condon, Crowley, Gerdes, Hanchar, Horstwood, Morris, Nasdala, Norberg, Schaltegger, Schoene, Tubrettk and Whitehouse2008) and a secondary standard to monitor the deviation of measurement, respectively. Concentration calibrations were carried out using NIST 610 glass as an external standard and Si as an internal standard. Isotopic ratios and element concentrations of zircons were calculated using ICP-MS software DataCal (Liu et al. Reference Liu, Gao, Hu, Gao, Zong and Wang2010). Concordia ages and diagrams were obtained using Isoplot/Ex 4.15 (Ludwig, Reference Ludwig2012). The common lead was corrected using Common Lead Correction (ver. 3.15), following the method of Andersen (Reference Anderson2002). Analytical data are presented on U–Pb Concordia diagrams with 2σ errors.
4.b. Major- and trace-element compositions
Rock samples were carefully selected, crushed and then ground to less than 200 mesh (c. 80 μm). Major elements were analysed on ARL ADVANT’ XP+, with 50 kV accelerating voltage and 50 mA accelerating current, at the Tianjin Institute of Geology and Mineral Resources of China Geological Survey. Chinese national standard samples GSR-1 and GSR-3 were used and analytical errors are better than 1%.
Trace element, including REE, analyses were performed by X series ICP-MS at the Tianjin Institute of Geology and Mineral Resources of China Geological Survey. For analyses, about 50 mg sample powder was dissolved in a mixture of HF and HNO3 (2:1) in a screw-top Teflon beaker (Savillex) for 1 day at c. 190°C. After evaporation, the sample was refluxed in HNO3 and dried twice, and finally re-dissolved in HNO3. The procedure was repeated until complete dissolution. The data quality was monitored by five standard reference materials: AGV-2, BCR-2, BHVO-2, BIR-1 and DNC-1. The analytical errors are 1–10% for trace elements, depending on the concentrations.
5. Results
5.a. Zircon U–Pb ages
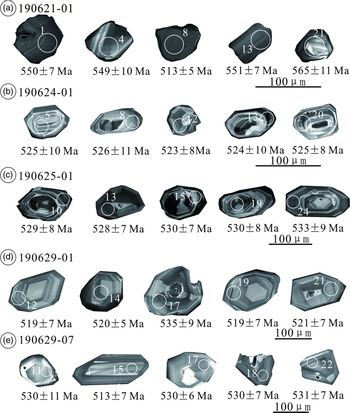
Zircons from five igneous rocks were selected for LA-ICP-MS dating. A summary of age data is given in Table 1, and all the data are presented in online Supplementary Table S1 (available at http://journals.cambridge.org/geo) and representative CL images of zircon grains are shown in Figure 5. The zircon grains are colourless, transparent, euhedral and prismatic in shape, with 20–200 μm in width and 30–200 μm in length (Fig. 5), and most grains show well-developed oscillatory zones. Analyses with < 95% concordance are excluded from age calculations.
Summary of zircon information. Con – concordant.

Representative cathodoluminescence (CL) images of zircon grains and 206Pb/238U ages.

5.a.1. Adakitic group
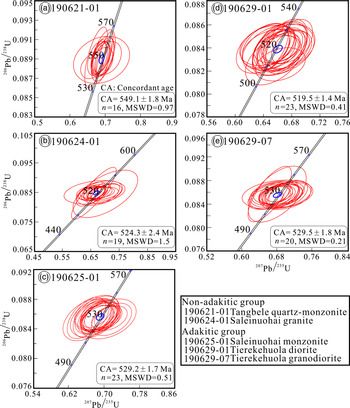
A total of 24 zircon grains were dated for Saleinuohai monzonite (190625-01); their U and Th concentrations are in the ranges of 121–421 and 44–514 ppm, respectively, with Th/U ratios of 0.37–1.22. With the exception of one grain with a younger 206Pb/238U age of 510 ± 8 Ma (No.18), the remaining 23 grains yield a concordant age of 529 ± 2 Ma (MSWD = 0.51; Fig. 6c).
U–Pb concordia diagrams for (a) Tangbale quartz-monzonite, (b) Saleinuohai granite, (c) Saleinuohai monzonite, (d) Tierekehuola diorite and (e) Tierekehuola granodiorite. MSWD – mean square of weighted deviates. Zircon U–Pb data are provided in online Supplementary Table S1.

For Tierekehuola diorite (190629-01), the dated 26 zircon grains have U and Th concentrations of 118–467 and 30–192 ppm, respectively, with Th/U ratios of 0.21–0.48. Spot 1 gives a younger 206Pb/238U age of 512 ± 6 Ma, and spots 13 and 17 give older 206Pb/238U ages of 535 ± 6 and 535 ± 9 Ma, respectively. The other 23 grains yield a concordant age of 520 ± 1 Ma (MSWD = 0.41; Fig. 6d).
A total of 21 analyses for Tierekehuola granodiorite (190629-07) are valid and their U and Th concentrations vary over 122–421 and 27–158 ppm, respectively, with Th/U ratios of 0.21–0.42. With the exception of one grain with a younger 206Pb/238U age of 513 ± 7 Ma (No.15), the other 20 gains yield a concordant age of 530 ± 2 Ma (MSWD = 0.21).
The concordant ages above show that the adakitic rocks were formed at 530–520 Ma.
5.a.2. Non-adakitic group
A total of 21 valid analyses from Tangbale quartz-monzonite (190621-01) show large variations in U and Th concentrations, varying over 164–1462 and 120–1465 ppm, respectively, with Th/U ratios of 0.62–1.38. Two grains give younger 206Pb/238U ages of 513 ± 5 (No. 8) and 514 ± 4 Ma (No. 15), and three grains have older 206Pb/238U ages of 571 ± 5 Ma (No. 9), 570 ± 8 (No. 11) and 565 ± 5 (No. 21). The other 16 grains yield a concordant age of 549 ± 2 Ma (MSWD = 0.97; Fig. 6a), which is considered as the crystallization age of the block.
For Saleinuohai granite (190624-01), 20 zircon grains were dated. They have U and Th concentrations of 103–2198 and 38–1334 ppm, respectively, with Th/U ratios of 0.34–0.65. With the exception of one analysis with an older 206Pb/238U of 541 ± 9 Ma (No.16), the other 19 grains yield a concordant age of 524 ± 2 Ma (MSWD = 0.15; Fig. 6b), which represents the crystallization age of the granite.
5.b. Whole-rock elemental chemistry
The chemical compositions of four adakitic and two non-adakitic igneous rocks and one gabbro enclave are presented in Table 2.
Major (wt%) and trace element (ppm) results of the igneous rocks

Mg no. = 100 × (MgO/40.3)/[MgO/40.3 + (0.9×Fe2O3 T/71.85)]; Eu* = 2EuN/(SmN + GdN).
5.b.1. Adakitic group
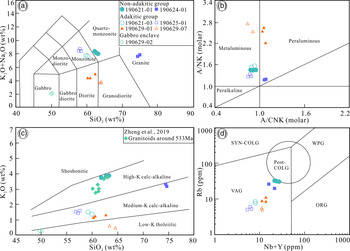
The samples have 58.90–64.51 wt% SiO2, 15.11–17.66 wt% Al2O3, 2.65–4.72 wt% MgO and 0.45–1.57 wt% K2O, with Mg no. = 46–60 and K2O/Na2O = 0.17–0.33, showing the compositional features of low-K tholeiitic and calc-alkaline series (Fig. 7c). They are metaluminous to peraluminous (Fig. 7b), with A/CNK (Al2O3/ (CaO + Na2O + K2O) mol%) and A/NK (Al2O3/ (Na2O + K2O) mol%) values ranging over 0.88–1.07 and 1.28–2.78, respectively.
(a) TAS diagram for the adakitic and non-adakitic rocks and gabbro enclave (after Middlemost et al. Reference Middlemost1994); (b) A/NK versus A/CNK diagram showing that the adakitic and non-adakitic rocks are metaluminous to peraluminous (after Maniar & Piccoli, Reference Maniar and Piccoli1989); (c) K2O versus SiO2 diagram for the adakitic and non-adakitic rocks and gabbro (after Peccerillo & Taylor, Reference Peccerillo and Taylor1976); and (d) Rb versus (Nb+Y) diagram showing that the adakitic and non-adakitic rocks are in VAG field (after Pearce et al. Reference Pearce, Harris and Tindle1984). ORG – oceanic ridge granites; Post-COLG – post-collisional granites; Syn-COLG – syn-collisional granite; VAG – volcanic arc granites; WPG – within-plate granites.

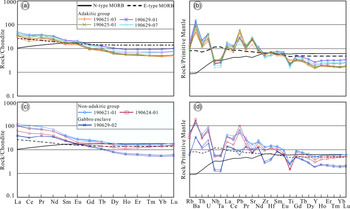
The adakitic group is characterized by relatively high Sr (300–663 ppm) and low Y (6.68–11.2 ppm) and heavy rare earth elements (HREEs) (Yb = 0.74–1.63 ppm), with Sr/Y = 40–84 (Table 2). They have relatively low REE concentrations of 41.59–69.72 ppm and show light REE (LREE) enrichment ((La/Yb)N = 5.13–10.24), with slightly negative Ce (δCe = 0.84–0.96) and positive Eu anomalies (δEu = 1.06–1.26) (Fig. 8a), and they show similar large-ion lithophile element (LILE) enrichment and Nb, Ta, Zr and Hf depletion, with varying Ti depletion (Fig. 8b).
Chondrite-normalized REE patterns and primitive-mantle-normalized trace-element spider diagrams of (a, b) the adakitic rocks, (c) the non-adakitic rocks and (d) gabbro. Chondrite, primitive mantle, N-MORB and E-MORB values are from Sun & McDonough (Reference Sun and McDonough1989).

5.b.2. Non-adakitic group
The quartz-monzonite has 61.54–63.10 wt% SiO2, 15.33–15.76 wt% Al2O3, 1.80–1.97 wt% MgO and 3.87–3.88 wt% K2O, with Mg no. = 36–40 and K2O/Na2O = 0.92–0.94. It is high-K calc-alkaline series (Fig. 7c) and metaluminous (A/CNK = 0.91–0.92; A/NK = 1.40–1.41; Fig. 7b). By contrast, the granite is high in SiO2 (71.29–77.42 wt%), low in Al2O3 (12.36–12.44 wt%), MgO (0.88–1.06 wt%) and K2O/Na2O = 0.63–0.77, with similar Mg no. = 38–41 and K2O (3.02–3.41 wt%) to the quartz-monzonite. It belongs to calc-alkaline series (Fig. 7c) and is peraluminous (A/CNK = 1.06; A/NK = 1. 13; Fig. 7b).
The quartz-monzonite and granite have similar trace-element features. They are characterized by higher Y (13.2–22.7 ppm) and HREE (Yb = 2.32–2.92 ppm), lower Sr/Y (9–16) than the adakitic group and total REE concentrations of 82.5–160.8 ppm (Table 2). The non-adakitic group has similar REE and trace-element patterns as the adakitic group, but they have negative Eu anomalies (δEu = 0.70–0.87), less LREE enrichment ((La/Yb)N = 4.52–7.05) and stronger Ti depletion (Fig. 8c, d).
5.b.3. Gabbro enclave
The gabbro is characterized by low Al2O3 (9.17–9.69 wt%) and K2O (0.31–0.35 wt%) and high MgO (14.81–15.11 wt%), with Mg no. = 72–73 and K2O/Na2O = 0.18–0.19. It has low REE contents of 61.9–62.5 ppm, with slightly negative Eu (δEu = 0.92–0.95) and Ce (δCe = 0.83–0.85) anomalies (Fig. 8c) and fractionated REE patterns ((La/Yb)N = 6.62–7.53). The gabbro enclave contains relatively high Cr (1120–1360 ppm), Ni (231–288 ppm), Co (45–48 ppm) and V (236–246 ppm) concentrations, and shows significant Nb, Ta, Zr, Hf and Ti depletion and Ba and U enrichment (Fig. 8d).
6. Discussion
The adakitic and non-adakitic igneous rocks are usually small in size (area of 50–600 m2) and occur mostly as isolated blocks, but the Tangbale adakitic monzonite is intruded by the Tangbale non-adakitic quartz-monzonite at 549 Ma, implying that the former was formed earlier. Similarly, the Saleinuohai adakitic monzonite was formed at 529 Ma, also earlier than the Saleinuohai non-adakitic granite at 524 Ma, but the emplacement of the adakitic granodiorite in Tierekehuola at 530 Ma was followed by the adakitic diorite at 520 Ma. In addition, the gabbro enclave was trapped by the adakitic granodiorite at 530 Ma. Locally, the adakitic rocks were formed earlier than the non-adakitic ones. Spatially, the igneous rocks show a progressively N-wards younger trend from Tangbale to Tierekehuola.
6.a. Petrogenesis
6.a.1. Adakitic group
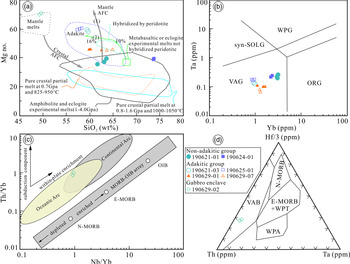
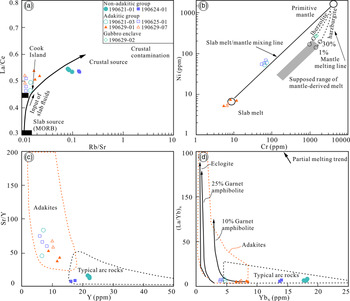
These rocks are characterized by SiO2 (57.61–64.51 wt%) and Al2O3 (15.11–17.66 wt%), with Mg no. = 46–60, relatively high Sr (300–663 ppm), Sr/Y (40–84) and Cr/Ni (1.06–1.69), and relatively low HREE (Yb = 0.74–1.63 ppm) and Y (6.68–12.2 ppm), which are typical of adakite (Figs 9a, 10c, d; Defant & Drummond, Reference Defant and Drummond1990) and high-SiO2 adakite (Martin et al. Reference Martin, Smithies, Rapp, Moyen and Champion2005; Konopelko et al. Reference Konopelko, Seltmann, Dolgopolova, Safonova, Glorie, De Grave and Sun2021). The adakite may be generated by (1) partial melting of subducted oceanic crust with or without contribution from mantle wedge (Defant & Drummond, Reference Defant and Drummond1990; Martin et al. Reference Martin, Smithies, Rapp, Moyen and Champion2005; Zhu et al. Reference Zhu, Mo, Niu, Zhao, Wang, Liu and Wu2009; Wu et al. Reference Wu, Li, Xu and Li2015); (2) assimilation and fractional crystallization of basaltic magma (Defant & Drummond, Reference Defant and Drummond1990; Zhou et al. Reference Zhou, Yan, Wang, Qi and Kennedy2006); (3) partial melting of thickened or delaminated lower crust (Petford & Atherton, Reference Petford and Atherton1996; Ernst, Reference Ernst2010); or (4) mixing of felsic and basaltic magmas (Streck et al. Reference Streck, Leeman and Chesley2007).
(a) SiO2 versus Mg no. diagram showing that gabbro plots in the field of mantle melts, and the adakitic and non-adakitic rocks plot in the field of adakite or amphibolite and eclogite experimental melts (after Cai et al. Reference Cai, Wang, Cawood, Zhang and Zhang2015). The field of adakite is after Wang et al. (Reference Wang, Xu, Jian, Bao, Zhao, Li, Xiong and Ma2006). The field of pure crustal partial melt at 0.7 GPa and 825–950°C, amphibolite and eclogite experimental melts at 1–4 GPa and pure crustal partial melts at 0.8–1.6 GPa and 1000–1050°C are after Sen & Dunn (Reference Sen and Dunn1994), Rapp (Reference Rapp1995), Rapp & Watson (Reference Rapp and Watson1995) and Sisson et al. (Reference Sisson, Ratajeski, Hankins and Glazner2005). The mantle AFC curves are after Stern & Kilian (Reference Stern and Kilian1996) (1) and Rapp et al. (Reference Rapp, Shimizu, Norman and Applegate1999) (2). (b) Yb versus Ta diagram showing that the adakitic and non-adakitic rocks are in VAG field (after Pearce et al. Reference Pearce, Harris and Tindle1984). (c) Nb/Yb versus Th/Yb (after Pearce, Reference Pearce2008). (d) Th–Hf–Ta (after Wood, Reference Wood1980) diagrams showing the gabbro is likely formed as part of oceanic arc. VAB – volcanic-arc basalt; OIB – ocean-island basalt; WPT – within-plate tholeiite; WPA – within-plate alkali basalt; E-MORB – enriched mid-ocean-ridge basalt; N-MORB – normal mid-ocean-ridge basalt.

(a) Rb/Sr versus La/Ce diagram showing that the adakitic and non-adakitic rocks are mainly slab- and crust-derived, respectively (after Hou et al. Reference Hou, Gao, Qu, Rui and Mo2004). Data for the Cook Island adakite are from Stern & Kilian (Reference Stern and Kilian1996). (b) Cr versus Ni diagram showing that mantle components were involved in the adakitic rocks (after Tsuchiya et al. Reference Tsuchiya, Suzuki, Kimura and Kagami2005). (c) Y versus Sr/Y (after Defant & Drummond, Reference Defant and Drummond1990). (d) YbN versus (La/Yb)N (after Martin, Reference Martin1999). The partial melting trends are based on diagrams from Zhou et al. (Reference Zhou, Yan, Wang, Qi and Kennedy2006) showing that the igneous tectonic blocks are adakites or typical arc rocks.

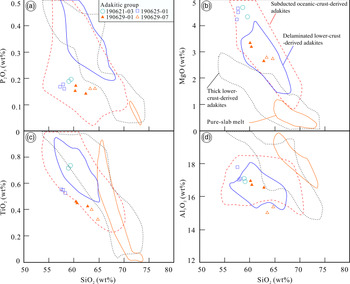
For the Ediacaran–Cambrian adakitic rocks in southern West Junggar region, their high Ni (> 5.5 ppm) and Mg no. (> 46) and low K2O (< 1.5 wt%) and Rb/Sr (< 0.03) are different from those of the adakite generated by partial melting of thickened lower crust (Rapp & Watson, Reference Rapp and Watson1995; Skjerlie & Patiño Douce, Reference Skjerlie and Patiño Douce2002; Liu et al. Reference Liu, Xie, Li, Wang, Wu, Li, Liu and Zhang2018). Moreover, their REE and trace-element features, especially low Th (< 2 ppm), are not consistent with lower-crust-derived adakitic rocks (Hou et al. Reference Hou, Gao, Qu, Rui and Mo2004; Wang et al. Reference Wang, Mcdermott, Xu, Bellon and Zhu2005; Zhou et al. Reference Zhou, Yan, Wang, Qi and Kennedy2006). Additionally, the adakitic rocks show no differential trends of basaltic magma, such as decreasing Mg no., Dy/Yb and Y with increasing SiO2 (Ma et al. Reference Ma, Wang, Wyman, Li, Jiang, Yang, Gou and Guo2013), or Mg no. > 60 for mantle-derived adakites (Martin et al. Reference Martin, Smithies, Rapp, Moyen and Champion2005; Zhang et al. Reference Zhang, Zhao, Santosh, Wang, Dong and Shen2010). In addition to the similarities to those of the adakites derived from subducted oceanic crust (i.e. Mg no. > 46, Cr > 6 ppm and Ni > 5.5 ppm) (Smithies, Reference Smithies2000; Zhang et al. Reference Zhang, Zhao, Santosh, Wang, Dong and Shen2010; Ma et al. Reference Ma, Wang, Wyman, Li, Jiang, Yang, Gou and Guo2013; Liu et al. Reference Liu, Xie, Li, Fan, Wang, Wang, Yu, Dong and Hao2019), their low K2O (< 1.5 wt%), relatively uniform K2O/Na2O (0.13–0.35) and high CaO/Al2O3 (0.2–0.42) resemble the oceanic-crust-derived adakites (Fig. 11) with K2O/Na2O (< 0.7) and high CaO/Al2O3 (> 0.2) (Martin et al. Reference Martin, Smithies, Rapp, Moyen and Champion2005; Ma et al. Reference Ma, Wang, Wyman, Li, Jiang, Yang, Gou and Guo2013; Wu et al. Reference Wu, Li, Xu and Li2015; Zhang et al. Reference Zhang, Zhu, Wang, Zhao, Liu and Xie2019). The high-SiO2 adakitic rocks could be derived from young subducted oceanic crust (Martin et al. Reference Martin, Smithies, Rapp, Moyen and Champion2005; Konopelko et al. Reference Konopelko, Seltmann, Dolgopolova, Safonova, Glorie, De Grave and Sun2021), similar to the Cook Island adakites derived from oceanic slab (Fig. 10a; Stern & Kilian, Reference Stern and Kilian1996).
SiO2 versus (a) P2O5, (b) MgO, (c) TiO2 and (d) Al2O3 diagrams showing that the adakitic rocks are consistent with subducted oceanic-crust-derived adakites. The fields of subducted oceanic-crust-derived, delaminated lower-crust-derived and thick lower-crust-derived adakites and pure slab melt are after Wang et al. (Reference Wang, Xu, Jian, Bao, Zhao, Li, Xiong and Ma2006).

The low Mg no. (< 45) adakites may result from partial melting of basalt (Rapp et al. Reference Rapp, Shimizu, Norman and Applegate1999), but their Mg no. and Cr and Ni concentrations will increase if components from the mantle wedge were significantly incorporated into the melt derived from the subducting oceanic crust (Fig. 9a; Rapp & Watson, Reference Rapp and Watson1995; Tsuchiya et al. Reference Tsuchiya, Suzuki, Kimura and Kagami2005; Wu et al. Reference Wu, Li, Xu and Li2015). The interaction of the mantle wedge and slab melt might be the cause for high Mg no. (58–60), Cr (89.9–97.4 ppm) and Ni (71.9–79.7 ppm) in the Tangbale and Saleinuohai monzonites (Fig. 10b), but the Tierekehuola diorite and granodiorite were mainly formed from the slab melt, with little contribution from the mantle wedge (Fig. 10b).
The adakitic rocks show Sr enrichment and slightly positive Eu anomalies (Fig. 8), suggesting that plagioclase could not be a residual phase in the source, and their Y and HREE depletion (Fig. 8) might be caused by garnet and/or amphibole residues in the source (Defant & Kapezhinskas, Reference Defant and Kapezhinskas2001; Martin et al. Reference Martin, Smithies, Rapp, Moyen and Champion2005). The residual garnet and amphibole in the source could result in fractionated HREE patterns with Y/Yb > 10 and flat HREE patterns with Y/Yb < 10 in the melts, respectively (Ge et al. Reference Ge, Li, Chen and Li2002). The adakitic rocks with Y/Yb = 7–10 might result from a residual amphibole source (Zhou et al. Reference Zhou, Yan, Wang, Qi and Kennedy2006; Ashraf et al. Reference Ashraf, Tanya, Nafiseh and Kyle2019), but the Tangbale and Saleinuohai monzonites with Y/Yb = 9–10 were derived from a minor residual garnet source that would be deeper than a residual amphibole source for the Tierekehuola diorite and granodiorite with Y/Yb = 7–8 (Fig. 10d, Zhou et al. Reference Zhou, Yan, Wang, Qi and Kennedy2006).
In addition, subduction-related magmas may be modified by subducted sediments and/or slab-derived fluids that are mainly composed of the seawater in the altered and cracked oceanic crust (Elburg et al. Reference Elburg, van Bergen, Hoogewerff, Foden, Vroon, Zulkarnain and Nasution2002; Wu et al. Reference Wu, Li, Xu and Li2015, Bellot et al. Reference Bellot, Boyet, Doucelance, Bonnand, Savov, Plank and Elliott2018). The slab-derived fluids are typically enriched in Ba, Rb, Sr, U and Pb, whereas subducted sediments usually have high Th and LREE contents (Hawkesworth et al. Reference Hawkesworth, Turner, Peate, Mcdermott and Calsteren1997). The subducted sediments could result in increasing Th contents up to c. 20 ppm and Th/Yb ratios > 2 in subduction-related magmas, in contrast with low Th contents and Th/Yb < 1 in the magmas predominantly affected by slab-derived fluids (Nebel et al. Reference Nebel, Münker, Nebel-Jacobsen, Kleine, Mezger and Mortimer2007). Because of low Th contents (< 2 ppm) and Th/Yb ratios (< 1.3) in the adakitic rocks, the magmas might be predominantly affected by slab-derived fluids. The fluids released from subducted slab first fertilize the mantle wedge, and then the ascending melts are interacted with the mantle wedge and modified by the fluids. The slightly negative Ce anomalies of the adakites may therefore be caused by the subducted seawater (Fig. 8a; Bellot et al. Reference Bellot, Boyet, Doucelance, Bonnand, Savov, Plank and Elliott2018).
Overall, the adakitic rocks were mainly the partial melts of subducted oceanic crust, but the melts were modified by mantle wedge and slab-derived fluids.
6.a.2. Non-adakitic group
The Tangbale quartz-monzonite and Saleinuohai granite are calc-alkaline to high-K calc-alkaline (Fig. 7c) and metaluminous to weak peraluminous (Fig. 7b), but they contain no Al-rich minerals or arc-related I-type granitoids.
The I-type granitoids in an intra-oceanic-arc system may be generated by: (1) partial melting of the middle or lower arc crust (Petford & Gallagher, Reference Petford and Gallagher2001; Smith et al. Reference Smith, Worthington, Stewart, Price and Gamble2003; Cai et al. Reference Cai, Wang, Cawood, Zhang and Zhang2015); (2) assimilation and fractional crystallization of mantle-derived magma (Chiaradia, Reference Chiaradia2009); or (3) mixing of crustal and mantle-derived magmas (Zhang et al. Reference Zhang, Ma, Holtz, Koepke, Wolff and Berndt2013; Yang et al. Reference Yang, Lu, Hou and Chang2015 b).
The non-adakitic granitoids have relatively low MgO (< 2 wt%) and Mg no. (< 41) (Table 2), different from those formed by assimilation and fractional crystallization of mantle-derived magmas with elevated MgO and Mg no. (Grove et al. Reference Grove, Elkins-Tanton, Parman, Chatterjee, Muntener and Gaetani2003; Yang et al. Reference Yang, Zhao, Xu, Zheng, Liu and Zhang2019 c). The non-adakitic granitoids show no differential trends of fractional crystallization of mantle-derived magma (Cai et al. Reference Cai, Wang, Cawood, Zhang and Zhang2015), and their Th contents (2.4–3.69 ppm) are also inconsistent with assimilation and fractional crystallization of mantle-derived magmas (Rapp & Waston, Reference Rapp and Watson1995; Cai et al. Reference Cai, Wang, Cawood, Zhang and Zhang2015). In addition, the non-adakitic granitoids contain no mafic enclaves or show no disequilibrium textures, implying that they could not result from the mixing of crustal and mantle-derived magmas. However, their low Cr (< 10 ppm), Ni (< 8 ppm) and Mg no. (< 41), and high K2O (> 3 wt%), Th (> 2.4 ppm) and Rb (> 20 ppm), Rb/Sr (> 0.1) and La/Ce (> 0.45) are similar to those of I-type granitoids derived from middle or lower arc crust (Rapp & Watson, Reference Rapp and Watson1995; Skjerlie & Patiño Douce, Reference Skjerlie and Patiño Douce2002). The non-adakitic granitoids are therefore similar to the I-type granitoids derived from partial melts of thickened lower crust (Cai et al. Reference Cai, Wang, Cawood, Zhang and Zhang2015) or amphibolite and eclogite at pressures of 1.0–4.0 GPa (Fig. 9a; Rapp et al. Reference Rapp, Watson and Miller1991; Rapp, Reference Rapp1995; Cai et al. Reference Cai, Wang, Cawood, Zhang and Zhang2015).
In a subduction setting, the slab-derived fluids could induce partial melting of the mantle-wedge, and the ascending melts could change the mechanical and thermal states at the base of the arc crust and provide abundant heat for partial melting of middle–lower arc crust (Petford & Gallagher, Reference Petford and Gallagher2001; Smith et al. Reference Smith, Worthington, Stewart, Price and Gamble2003; Ren et al. Reference Ren, Han, Xu, Zhou, Liu, Zhang, Chen, Su, Li, Li and Li2014). Chemically, the Saleinuohai granite with higher SiO2 contents resembles the rhyolites with SiO2 contents of 69–79 wt% in the Izu–Bonin arc, which were produced by dehydration melting of middle crust (Tamura & Tatsumi, Reference Tamura and Tatsumi2002). The Tangbale quartz-monzonite with lower SiO2 and higher Cr and Ni contents is more like the melts of lower arc crust in Kermadec (65–73 wt%; Smith et al. Reference Smith, Worthington, Stewart, Price and Gamble2003) and South Sandwich (63–73 wt%; Leat et al. Reference Leat, Smellie, Millar and Larter2003). Experimentally, the melts have increasing Al2O3 and Sr concentrations and Sr/Y ratios and decreasing Y and HREE concentrations as pressure increases (Petford & Atherton, Reference Petford and Atherton1996). The Tangbale quartz-monzonite has relatively enriched LREE ((La/Yb)N = 5.81–7.05) and flat HREE with Y/Yb = 7.6–7.8, suggesting no garnet in source (Fig. 10d; Ge et al. Reference Ge, Li, Chen and Li2002; Zhu et al. Reference Zhu, Mo, Niu, Zhao, Wang, Liu and Wu2009). The melts for the Tangbale quartz-monzonite were therefore derived from an amphibole-bearing protolith (Martin et al. Reference Martin, Smithies, Rapp, Moyen and Champion2005). By contrast, the Saleinuohai granite has lower Al2O3 (12.36–12.44 wt%), Sr (150–158 ppm), Sr/Y (9–11) and Y/Yb (5.8–6.7) than the Tangbale quartz-monzonite, suggesting that the source for the Saleinuohai granite was at a shallower depth.
The non-adakitic granitoids were therefore likely derived from partial melts of the middle–lower crust of an intra-oceanic arc, which was modified by subduction fluids (Leat et al. Reference Leat, Livermore, Millar and Pearce2000; Nebel et al. Reference Nebel, Münker, Nebel-Jacobsen, Kleine, Mezger and Mortimer2007).
6.a.3. Gabbro enclave
The Tierekehuola gabbro is low K-tholeiitic (Fig. 7c), and has low TiO2 (c. 0.5 wt%) and high Fe2O3 (c. 11 wt%) and MgO (c. 15 wt%), with Mg no. = 72–73; it could therefore not be formed by partial melting of lower crust (Fig. 9a; Rudnick & Gao, Reference Rudnick, Gao, Turekian and Holland2003; Feng et al. Reference Feng, Liu, Liu, Wen, Li and Liu2016). Its high Co (45.4–48.6 ppm), Ni (231–288 ppm), Cr (1120–1360 ppm) and V (236–246 ppm) concentrations are typical of mantle-derived magmas (Figs 9a, 10b) and its enriched LILEs and strongly depleted Nb, Ta, Zr and Hf (Fig. 8c, d) can be attributed to significant effects of slab-derived fluids (Th < 1.1 ppm, Nebel et al. Reference Nebel, Münker, Nebel-Jacobsen, Kleine, Mezger and Mortimer2007) on its source in the mantle wedge (Fig. 9c, d; Eiler et al. Reference Eiler, Crawford, Elliott, Farley, Valley and Stolper2000; Grove et al. Reference Grove, Elkins-Tanton, Parman, Chatterjee, Muntener and Gaetani2003; Yang et al. Reference Yang, Li, Santosh, Gu, Yang, Zhang, Wang, Zhong and Tong2012 a; Liu et al. Reference Liu, Han, Xu, Ren and Chen2020).
6.b. Tectonic implications
The adakitic and non-adakitic group rocks and gabbro enclave were all formed in an intra-oceanic arc setting (Figs 7d, 9b–d), as suggested by previous studies (Ren et al. Reference Ren, Han, Xu, Zhou, Liu, Zhang, Chen, Su, Li, Li and Li2014; Zheng et al. Reference Zheng, Han, Liu and Wang2019; Liu et al. Reference Liu, Han, Xu, Ren and Chen2020).
6.b.1. Ediacaran initial subduction
The SSZ-type ophiolites are predominant in the Barleik–Mayile–Tangbale accretionary complexes (Yang et al. Reference Yang, Li, Santosh, Gu, Yang, Zhang, Wang, Zhong and Tong2012 a; Ren et al. Reference Ren, Han, Xu, Zhou, Liu, Zhang, Chen, Su, Li, Li and Li2014; Weng et al. Reference Weng, Xu, Ma, Chen, Sun and Zhang2016; Liu et al. Reference Liu, Han, Xu, Ren and Chen2020), and the oldest SSZ-type gabbro occurs within the Mayile ophiolitic mélange and was formed at 572 Ma (Yang et al. Reference Yang, Li, Santosh, Gu, Yang, Zhang, Wang, Zhong and Tong2012 a), coeval with the oldest arc diorite in the Tangbale accretionary complex (Zheng et al. Reference Zheng, Han, Liu and Wang2019). This probably suggests that the subduction of the Junggar Ocean was initiated not later than 572 Ma (Zheng et al. Reference Zheng, Han, Liu and Wang2019; Liu et al. Reference Liu, Han, Xu, Ren and Chen2020).
Both of the Tangbale adakitic monzonite and non-adakitic quartz-monzonite show arc affinities, but the Tangbale monzonite is calc-alkaline and was formed during the Ediacaran Period, followed by the high-K calc-alkaline quartz-monzonite at 549 Ma (this study) and quartz-diorite at c. 533 Ma (Fig. 7c; Zheng et al. Reference Zheng, Han, Liu and Wang2019). If the subduction of Junggar Ocean was initiated at 572 Ma (Zheng et al. Reference Zheng, Han, Liu and Wang2019; Liu et al. Reference Liu, Han, Xu, Ren and Chen2020), the transition from low-K tholeiitic series to high-K calc-alkaline series of arc magmatism characterizes the increasing arc maturity (Ishizuka et al. Reference Ishizuka, Tani, Regan, Kanayama, Umino, Harigane, Sakamoto, Miyajima and Yuasa2011; Ren et al. Reference Ren, Han, Xu, Zhou, Liu, Zhang, Chen, Su, Li, Li and Li2014).
6.b.2. Cambrian slab rollback
The Ediacaran–Cambrian igneous rocks show a N-wards younger trend, with the oldest Tangbale calc-alkaline monzonite at > 549 Ma, the youngest Tierekehuola low-K tholeiitic granodiorite at 530 Ma and the youngest Tierekehuola calc-alkaline diorite at 520 Ma. For the Cambrian arc magmatism, the Tierekehuola low-K tholeiitic granodiorite was formed at 530 Ma, earlier than the Saleinuohai calc-alkaline granite and monzonite at 529–524 Ma. This is the same as the across-arc compositional trend of tholeiitic to calc-alkaline with increasing distance from the trench (Tatsumi & Eggins, Reference Tatsumi and Eggins1995; Ren et al. Reference Ren, Han, Xu, Zhou, Liu, Zhang, Chen, Su, Li, Li and Li2014), suggesting a S-directed subduction of oceanic lithosphere and a N-wards migration of arc magmatism. Such a temporal and spatial distribution of arc magmatism probably resulted from a N-wards rollback of the subducting slab during the Cambrian Period. Accordingly, late Cambrian adakitic and non-adakitic plutonic blocks in the accretionary complexes of southern West Junggar (Xu et al. Reference Xu, Han, Ren, Zhou, Zhang, Chen and Liu2012; Ren et al. Reference Ren, Han, Xu, Zhou, Liu, Zhang, Chen, Su, Li, Li and Li2014; Zheng et al. Reference Zheng, Han, Liu and Wang2019) and plagiogranite block in the North Balkhash mélange, Central Kazakhstan (Degtyarev et al. Reference Degtyarev, Luchitskaya, Tretyakov, Pilitsyna and Yakubchuk2021) may also have been formed during the slab rollback.
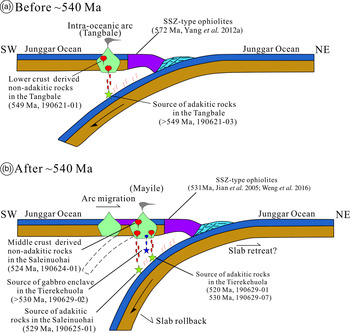
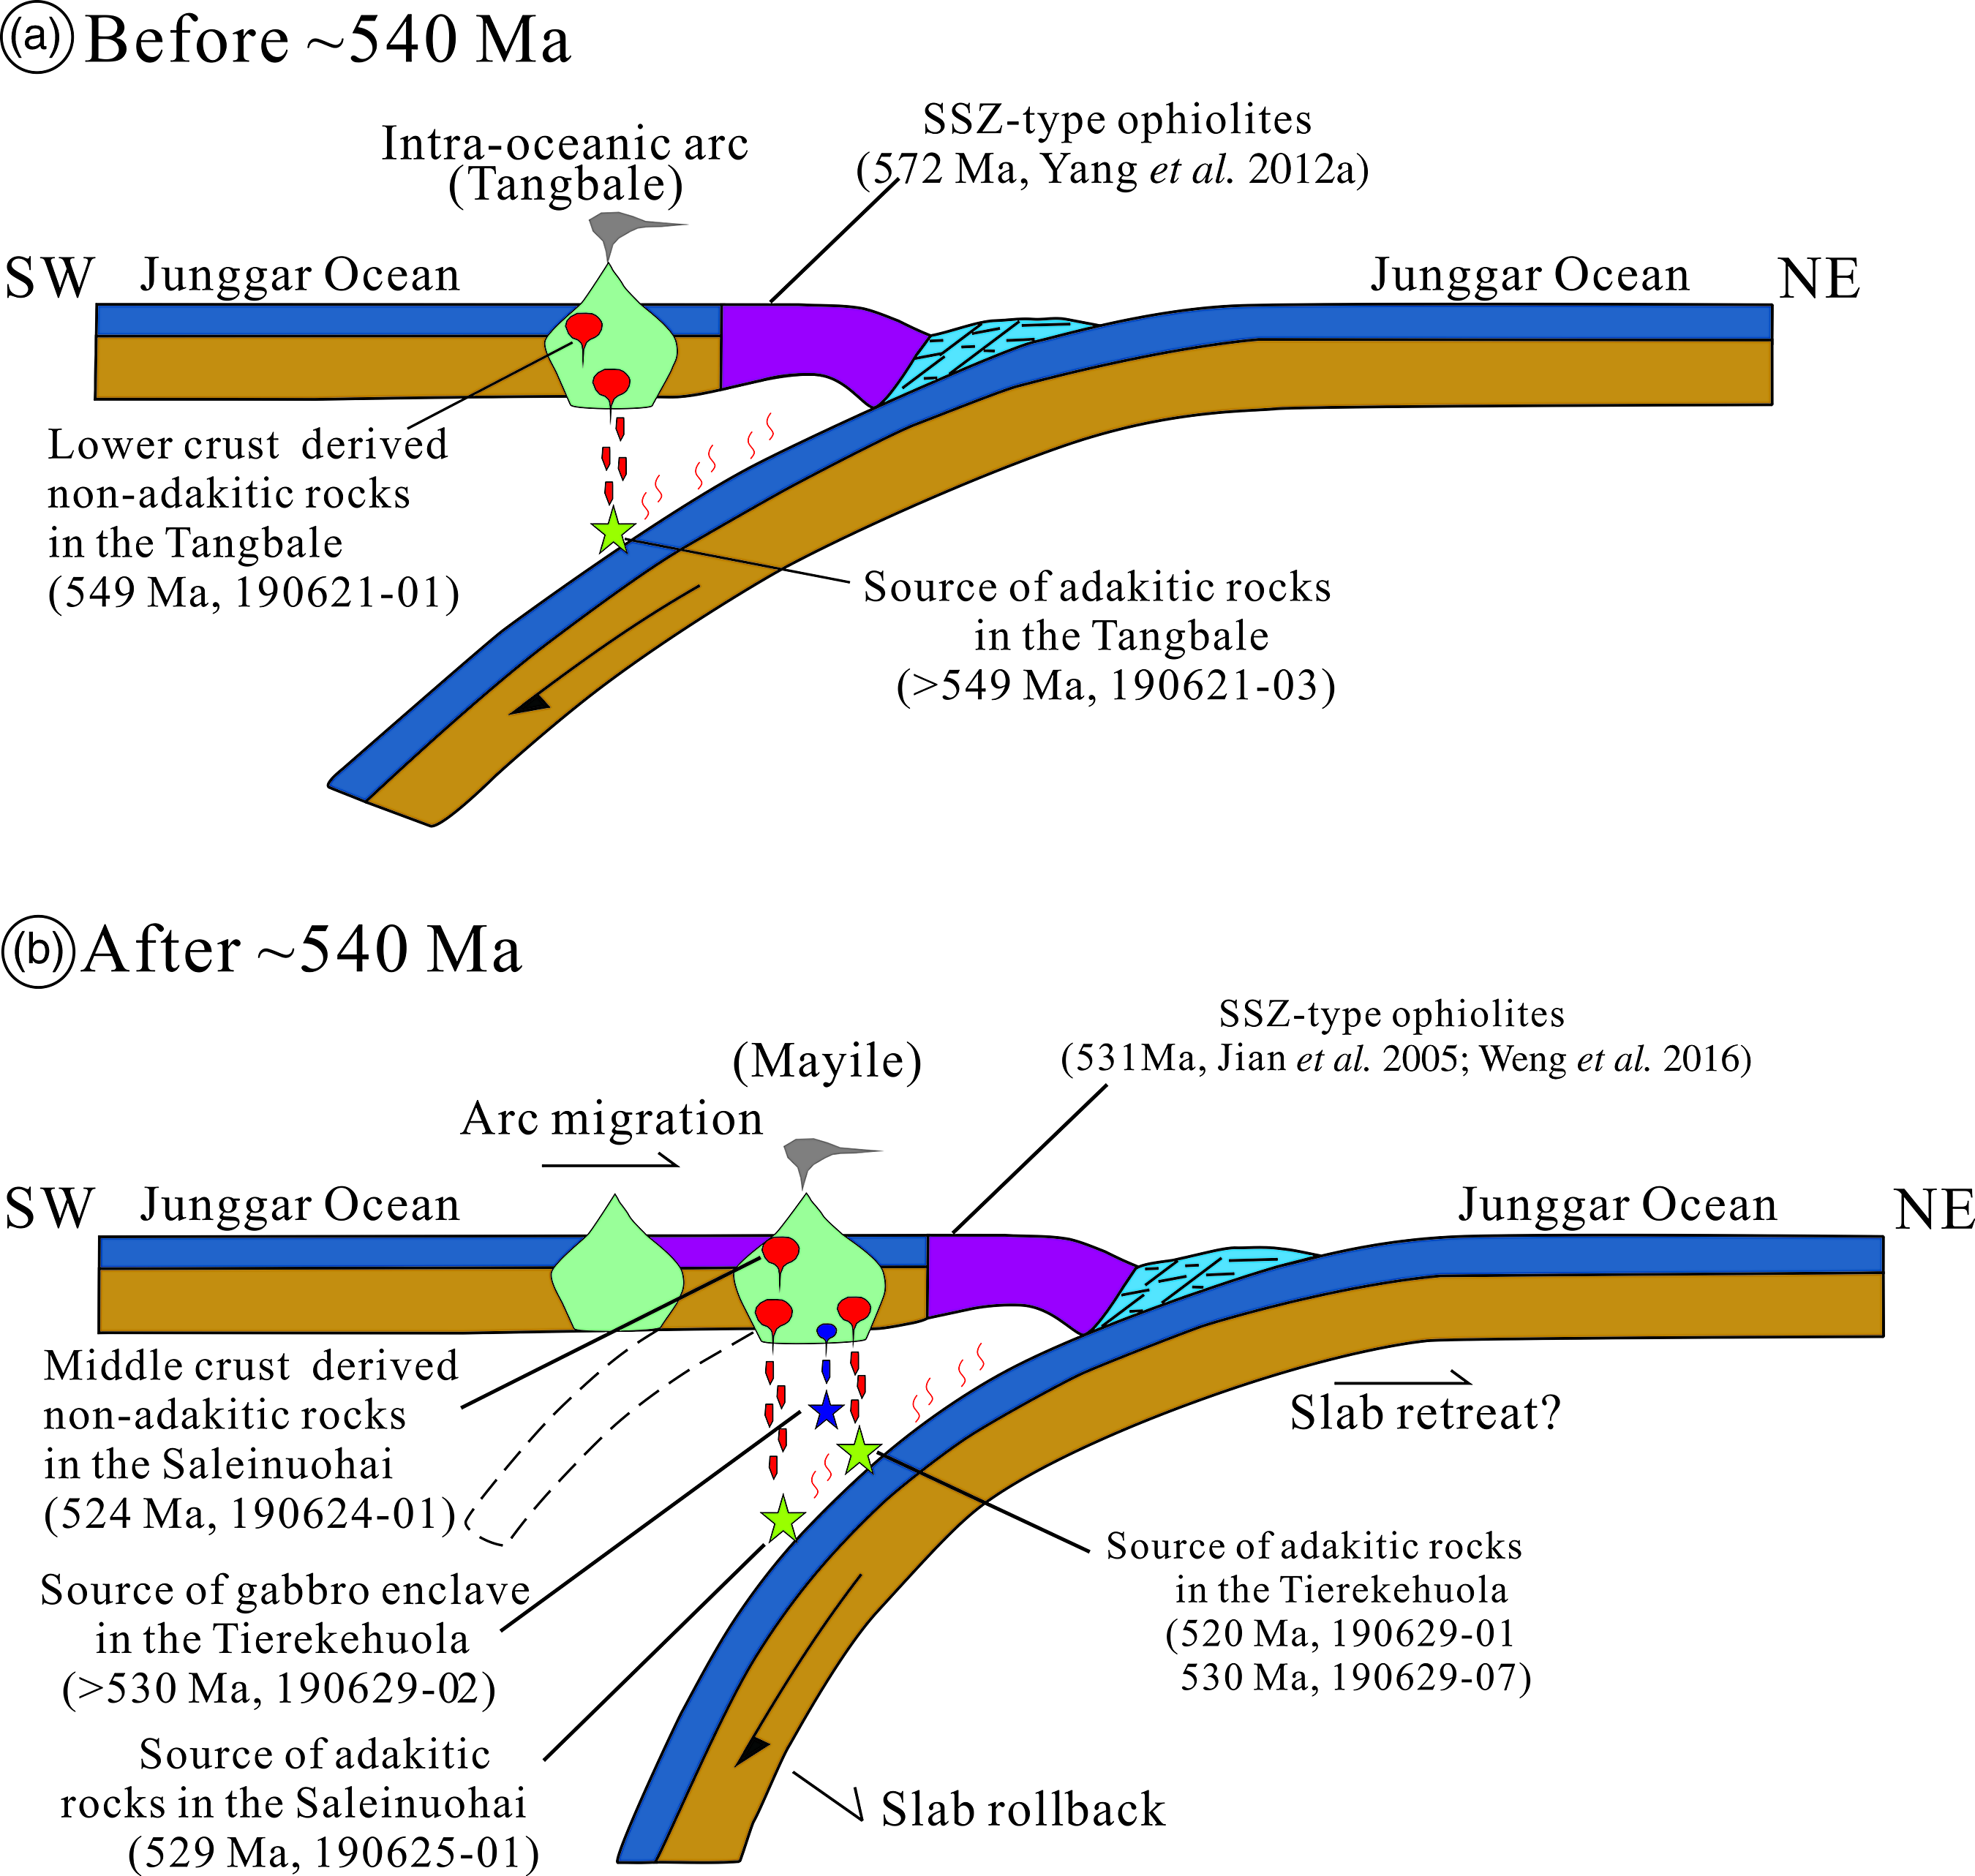
In summary, the S-directed subduction of the Junggar Ocean was initiated during the Ediacaran Period and resulted in the oldest SSZ-type ophiolite of 572 Ma (Yang et al. Reference Yang, Li, Santosh, Gu, Yang, Zhang, Wang, Zhong and Tong2012 a; Liu et al. Reference Liu, Han, Xu, Ren and Chen2020). The partial melting of subducted slab generated the adakitic rocks, followed by the partial melting of lower arc crust to form the non-adakitic rocks in an immature intra-oceanic arc (Fig. 12a). Possibly, the N-wards slab rollback and retreat of subduction zone occurred at c. 540 Ma, accompanied by the formation of younger SSZ-type ophiolites of 531 Ma (Jian et al. Reference Jian, Liu, Shi, Zhang and Sklyarov2005; Weng et al. Reference Weng, Xu, Ma, Chen, Sun and Zhang2016). The Cambrian slab rollback induced the asthenospheric upwelling, which resulted in partial melting of the fluid-metamotized mantle-wedge to form the gabbro enclave as part of another immature arc. Afterwards, the partial melting of the oceanic slab and middle arc crust generated adakitic and non-adakitic magmas, respectively, and the gabbro enclave was wrapped by the adakitic pluton at 520–530 Ma (Fig. 12b).
A model for tectonic evolution of the Junggar Ocean during the Ediacaran–Cambrian periods.
7. Conclusions
-
(1) New LA-ICP-MS zircon U–Pb dating confirms the presence of Ediacaran–Cambrian igneous rocks in southern West Junggar region, and they can be divided into adakitic and non-adakitic groups.
-
(2) The adakitic rocks were generated by partial melting of subducted oceanic crust, but the melts were modified by mantle wedge and slab-derived fluids. The non-adakitic rocks were derived from partial melts of the middle–lower crust of an intra-oceanic arc, which was modified by subduction fluids. In addition, the gabbro was formed as part of another immature arc by partial melting of the fluid-metasomatized mantle-wedge and then wrapped by adakitic granodiorite at 530–520 Ma.
-
(3) A N-wards younger trend of intra-oceanic arc magmatism could be generated by a process of Ediacaran initial subduction and Cambrian slab rollback of the Junggar Ocean.
Acknowledgements
We are grateful to Hao Sun, Bo Liu, Pan Zhao and Chong-Jin Pang for their help during fieldwork and article preparation. We thank the editor Dr Kathryn Goodenough and two anonymous reviewers for their constructive comments, which greatly improved the manuscript. We also thank copy-editor Elaine Rowan for corrections to language. This study was supported by the National Natural Science Foundation of China (grant no. 41972234), National Key R&D Program of China (grant no. 2017YFC0601203) and Opening Foundation of Hebei Key Laboratory of Strategic Critical Mineral Resources, Hebei GEO University (grant no. HGU-RGMKF211).
Supplementary material
To view supplementary material for this article, please visit https://doi.org/10.1017/S0016756821000376