


Introduction
Connected with global processes of climate warming and weathering, it is important to estimate the changes of ice reserves and their impact on variations of river runoff and water balance of lakes in Central Asia. For this reason we should find out not only the mass balances of single glaciers, but also of their groups, glacierization of ranges, mountain-glacier basins and the glaciers’ systems as a whole. This task needs to be resolved in different ways:
1. For example, with the help of standard meteorological data
– for glacierization of Lemon Creek basin (Reference TangbornTangborn, 1980);
– for glacierization of Central Asia river basins (Reference KonovalovKonovalov, 1985; Reference GlazyrinGlazyrin, 1985; Reference RatsekRatsek, 1991);
2. According to the data of repeated aerophoto-topographical surveys, for example:
– for glacierization of the Akshiyrak Range (Reference Kuz’michenokKuz’michenok, 1989);
3. By solving the water balance equation, for example:
– for the basin of the grand Aletch glacier (Reference KasserKasser, 1959);
– for glacierization of Jostedalsbreen (Reference RogstadRogstad, 1951);
4. According to the glaciological data of measurements of mass balance, bn, ELA, accumulation area ratio (AAR), for example:
– for the glacierized part of Alaska (Reference Meier and PostMeier and Post, 1962);
– for the whole “minor” glacierization of the Earth (Reference MeierMeier, 1984);
– for the group of the Northern Cascade glaciers (Reference PeltoPelto, 1987);
– for the basins of the Caucasus and Tien Shan (Reference DyurgerovDyurgerov, 1984, 1988; Dyurgerov and Mikhalenko, in press);
– for the glacier basins of the Alps (Reference Chen and OhmuraChen and Ohmura, 1990).
Mass-balance estimations are presented for the Tien Shan glacier area of the USSR, that is about 8000 km2. Only the data of distribution of winter mass balance in dependence of altitude and the values of glacierization square in each basin were used. Such an approach allows one to estimate the changes in ice supply and contribution of glaciers to the river runoff in the large glaciated mountain basins. Exact calculations using experimental data, which can be carried out for individual glaciers, are not possible in these mountain basins.
The highland regions of the Tien Shan represent the source area of the largest Central Asian rivers. For this reason the question of mass-balance estimation and glacier runoff is interesting from the scientific as well as the practical point of view.
Glacier area (km2) distributionby altitude

Regional Characteristics
Glacierization in the Tien Shan is unequally distributed over the territory and river basins. It is documented, in particular, by the data of distribution of the glacial area altitudes (Table 1). Most of the information on glacierization used in this work is published in the USSR Glacier Inventory (Reference GidrometeorologicheskoyeGidrometeorologicheskoyc Izdatel’stvo 1969–1978). The regime of glaciers in the northwest and west parts of the inner Tien Shan has been well studied. Glaciers in these outlying areas have a greater energy balance owing to greater precipitation and more active ablation than in the inner Tien Shan. Considerable ablation values are determined by less absolute altitudes.
There is little information about glacierization in the inner Tien Shan. In the basins of Sarydjaz, Kokshaal, and Aksu rivers are concentrated more than 3000 km2 of glacier area. But measurements of mass balance in the highest parts of compact glacierization are very scarce (Reference DekikhDekikh, 1982). There are also no meteorological data.
Winter mass balance in these basins was measured in 1991 by an expedition from the Laboratory of Mountain Glaciology of the Institute of Geography and this enabled a calculation to be made for all glacierization of Soviet Tien Shan.
Method
The process of glacierization of each basin may be represented as a distribution of altitudinal glaciered area, that is as one hypsographic curve, because the altitude is the main parameter of mass-balance variation.
To estimate the mass balance, data of measurements of winter mass balance, bw, on the glaciers, snow accumulation over the snow measuring routes and meteorological data were used (Table 2). this information served for dependencies plotting bw(Z) in the river basins.
The computation was produced according to the data of the USSR Glacier Inventory (Reference GidrometeorologicheskoyeGidrometcorologiches-koye Izdatel’stvo 1969–1979). The Tien Shan area was divided into five main basins: Lake Issikkul, Lake Balkhash, the Aral Sea, the Talas and Chu rivers, and the river Aksu. To estimate the mass balance, 240 minor river basins within five main basins were originally chosen from the Glacier Inventory (Reference Kuz’michenokKuz’michenok, 1989). They were then classified on the basis of two indices:
– similarity of hypsographic curves of glacierization;
– distribution of snow accumulation, depending on altitude (Reference GetkerGetker, 1985).
These two indices are used in the estimation. As a result, 12 river basins with homogeneous mass balance conditions Fig. 1, Table 1) were selected.
Thus each basin is described by two curves: b s(Z) and b s(Z) (at 100m altitude intervals). Basin glacierization is considered as a single glacier with complete collection of exposition, as established in previous studies (Reference Dyurgerov and MikhalenkoDyurgerov, 1984, 1988; Mikhalenko, 1990).
Winter mass-balance distribution by equilibrium line altitude

Sketch map of Tien Shan glacier regions: 1: Talas; 2: Chu; 3: Chu upper course; 4: Chirchik; 5: Issik-Kul; 6: Marin; 7: Marin upper course; 8: Karadaria; 9: Atbashy; 10: Ily; 11: Aksu.

These curves also serve for computation of snow ablation and for definition of ELA on the glacier.
The ablation curve form, or b s (summer mass balance), is stable for the distinct morphographical glacier types (Reference Krenke and MenshutinKrenke and Menshutin, 1987) and appears as a concave curve (Reference KhodakovKhodakov, 1965). Normalized ablation values (0 to 1) for each moment, j, are described by the exponential bsij = aj e−hi , where aj is a coefficient, and hi is normalized (0 to 10) altitude:
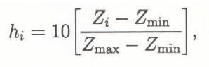
where Z min, Z max represent the upper and lower lines of Tien Shan glacierization and represented the mean quantity of each altitude interval. This calculation method was described by Reference KunakhovitchKunakhovitch (1991).
Then b s of altitude interval i may be represented as
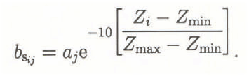
Coefficient aj in each moment j is constant for the whole basin (but coefficient aj is changing during the ablation season) and is calculated according to the altitude interval i, supposing that the equilibrium line is located there. Under this condition


As an example, Figure 2 shows the computed variation bs with altitude for Golubina glacier according to measurement data for five years (Reference Haeberli and MüllerHaeberli and Müller, 1988).
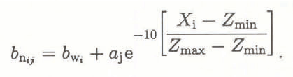
The mass-balance values bnj in each interval i were estimated for each ELA by the formula:
Annual ablation of Golubina Glacier versus altitude: 1: mean experimental values for 5 years; 2: calculated values.

Then a specific mass balance of all glacierizaüon b nj is computed as:

where S is the total glaciated area, represented by the hypsographic curve, s i is the area of every altitude zone, and n is the number of altitude intervals.
Thus, from the data for the two curves b w(Z) and b s(Z), b n = f(ELA) for each basin Fig. 3, Table 3).
Calculated curves of the mass balance-equilibrium line altitude relation ELA (b) for 12 regions.

Results
The spatial mass-balance variations are considerable. As it is demonstrated in Table 3, the mass balance is positive in all basins until an ELA altitude of 3450 to 3500 m a.s.l. and it is negative, when the ELA is higher than 4200 m a.s.l. The zero b n value corresponds to average long-term equilibrium line altitude, ELA. Three regions can be distinguished according to the ELA meanings.
1. Outlying districts of west and northwest Tien Shan (basins of Chirchik, Talas and Karadarya rivers, Chu River middle course), with ELA at 3500 to 3800 m a.s.l.;
2. Inner Tien Shan (basins of Atbashi, Ili Rivers, Issikkul lake, Narin River middle course, Chu River upper course) with ELA at 3800 to 4000 m a.s.l.;
Mass-balance distribution (cm W.E.) by equilibrium line altitude

3. The highland part of glacierization of the central Tien Shan (basins of Sari-Djas, Aksay rivers, Narin river upper course) with ELA 4200 to 4500 m a.s.l.
These three regions have great differences in b n = f (ELA) curves Fig. 3. The first district line has considerable inclination. The differences are determined by the variations of snow accumulation and ablation. The west Tien Shan has a more humid and warm climate, because of the influence of strong west winds and lower altitude.
The most stable conditions are in the highland part of compact glacierization of the central Tien Shan. The b n gradient here is small with the ELA at 4400 m, then it becomes greater, because of larger accumulation.
In the middle group the mass turnover is minimum, owing to the continental climate of this area.
The ELA is lower than average long-term ELA, determined by Kurovskiy’s method for about 100 m. Thus b n is negative, when the ELA is equal to Kurovskiy’s altitude that testifies the trend to a reduction in glacierization. In this case we have b n = −48 mm, so the additional glacial runoff related to negative balance corresponds to about 3.88 km3 a−1 from an area of about 8000 km2.
Mass-balance variations between basins are not large when the mass-balance values are positive (or with low position of ELA). In warm and dry years we may expect the biggest variations of ELA and b n altitudes in different basins.
Discussion
The applied method of estimation permits computation not only of the average multi-annual values, but also the annual ones of mass balance with the ELA data.
As it is shown in Figure 3, in the altitudinal range of ELA equal to 3200–3800 m a.s.l., all relation points of ELA = f(b n) may be approximated as linear, but in general the dependencies are not linear. In previous studies (Reference DyurgerovDyurgerov, 1988; Reference MikhalenkoMikhalenko, 1990; Reference KunakhovitchKunakhovitch, 1991), it was shown that the relation of ELA = f(b n) may be approximated by hypsographical curves, if the linear relation AAR = f(b n) holds. The superimposition of the curves ELA = f(b n) on the hypsographical ones Fig. 4 shows that, for the Tien Shan regions, this is correct. The convergence degree of estimated data of ELA = f(b n) with hypsographical curves may serve as an index of computational quality and used for basic data with b W = f(Z) initially.
Hypsographic and ELA(b) curves for 9 regions: a, hypsographic curve; b, ELA(b).

The completeness and reliability of knowledge about glacierization regime and mass balance of the Tien Shan in general, depends on information on the ELA and most high parts of the glaciated area in the basins of the Sari-Djas, Kokshaal and Aksu rivers.



