


Policy analysis is available in abundance on Capitol Hill. Inside-the-beltway elites routinely discuss the likely implications of proposed government interventions, as well as other hypothetical and empirical aspects of policies such as conditions, constraints, risk, and efficiency. Krehbiel (1992) demonstrates that the committee system of the U.S. Congress is organized to make use of this analytical policy information. Because legislators are often risk averse and are uncertain over the impact of different policies, they sometimes, but not always, pay attention to expert information as they develop legislation in committees (Krehbiel 1992, 62).
The discourse among elite policy watchers often centers on analytical policy research. Understanding these technical aspects of policies requires a level of knowledge, however, that typical constituents do not possess. Policy expertise is inherently difficult to communicate in a sound bite that will resonate with constituents (Arnold 1990, 80). This difference in perspectives between D.C. elites and constituents creates a dilemma for members of Congress (see Bianco 1994 and Fenno 1978). Committee members may wish to develop expert-informed legislation, but it is constituents who put legislators in office, not experts. If constituents cannot evaluate the intellectual merits of legislators' work in D.C., what induces members to care about policy outcomes, and to attend to policy expertise in committees?
In this paper I argue that the incentive comes at least in part from interest group pressure. I demonstrate that groups and their political action committees tend to give contributions to “workhorse” committee members who have higher capacities to engage in analytical discourse at hearings, and hence a greater demand for analytical information in their legislative work (see Box-Steffensmeier and Grant 1999, 515; Wright 1990, 427). Groups tend not to contribute to “show horse” committee members who routinely engage in unscientific anecdotal discourse aimed at constituents. Although an interest group may only intend to further some narrow interest, in the aggregate contributions create incentives for members to enhance their capacity to attend to policy expertise in committee work. In this view, contributions complement, rather than substitute for, policy information, reasoned arguments, and expertise in congressional committees (see, e.g., Austen-Smith 1995). This institutional effect generally is not recognized among good government reformers (e.g., Claybrook 2000; Common Cause 2004), and these findings may shed new light on debates regarding campaign finance reform.
ANALYTICAL CAPACITY, CONTRIBUTIONS, AND ATTENTION TO EXPERTISE
At nearly any committee hearing, one can observe some committee members engaging experts in the intricate analytical details of policy, while others discuss the policy topic in more personalized, experiential terms that resonate with constituents. To illustrate, consider an example from a hearing entitled, Assessing America's Health Risks: How Well Are Medicare's Clinical Preventive Benefits Serving America's Seniors (Ways and Means, subcommittee on Health, Oct. 3, 2002). In one exchange during the hearing, Ernie Fletcher, a Republican from Kentucky, and Marthe R. Gold of the City University of New York Medical School, discussed the most efficient means to improve prevention in the Medicare program. In this analytical exchange, the two discuss the relative benefits of creating incentives within Medicare to encourage physicians to practice preventative medicine, compared to creating a public education campaign on prevention aimed at seniors. In her response, Dr. Gold refers to research findings from studies of the British Health Service as well as from academic journals.1
Dr. Gold cites extensive peer-reviewed research in her testimony, including articles on prevention found in the American Journal of Preventative Medicine, the Annals of Internal Medicine, the Urological Clinician of North America, and the Annals of Thoracic Surgery.
In a separate exchange, the subcommittee chair, James C. Greenwood, a Republican from Pennsylvania, asks Viola Quirion, a member of the Alliance of Retired Americans, to discuss her personal experience with inadequate preventative medicine in Medicare. At the time of the hearing, Ms. Quirion suffered from a late stage of ovarian cancer. Discussing Ms. Quirion's plight highlighted the consequences of the lack of prevention in the Medicare program, a complex point captured in anecdotal terms that ordinary constituents could understand.
For convenience, I label the former type of exchange, between Fletcher and Gold, “analytical” discourse, and the latter type of exchange, between Greenwood and Quirion, “experiential” discourse. Both types of communication are a necessary part of the practice of representation. Legislators often wish to demonstrate their qualifications by talking knowledgeably about policies (Fenno 1978, 57), and to communicate credible analytical information to reduce uncertainty among their colleagues about their preferred policies (Krehbiel 1992). At the same time, members wish to demonstrate their identification and empathy with constituents (Bianco 1994, 55). To connect with constituents, members must demonstrate that they think the same way that constituents think and respond to issues the same way constituents would respond (Fenno 1978, 58–59). Anecdotal or personal stories often resonate well with ordinary constituents, who in general do not have scientific training or the background knowledge to master analytical arguments for or against policies (Arnold 1990, 80).
Given the importance of the electoral connection for members of Congress, all members have strong incentives to engage in discourse that may cement a degree of identification and empathy with their constituents. That some members invest time and staff resources to gain analytical knowledge presents something of a puzzle (Wawro 2000). Participation in policy analytical discourse is costly because it is difficult to engage others without preparation (Hall 1996, 37; Wright 1990, 434). And as Mayhew (1974, 124–125) notes, given low levels of policy knowledge among constituents, the electoral connection provides few if any incentives for members to invest their time and staff resources in policy research.
I argue that the pattern of interest group hard money contributions to members creates incentives for some members to attend to policy analysis in committees. Groups use contributions to motivate like-minded legislators to become active in committee work (Denzau and Munger 1986; Hall and Wayman 1990). Further, interest groups often are well informed on issues and care about the consequences of policies rather than the mere positions that members adopt (Esterling 2004). Consequently, I expect groups to subsidize effective members who have a relatively high capacity to engage in the analytical aspects of policies (Box-Steffensmeier and Grant 1999, 514; Hall and Deardorff 2006). At the same time, groups do not have an incentive to subsidize members who tend to articulate sound bites that appeal to constituents rather than discuss the technical aspects of policies and their likely outcomes.
Members differ in their background, prior occupation, education, interest in policy analysis, staffing patterns, and so on. Consequently, members vary in their marginal cost to gather expert policy information (Krehbiel 1992, 88). Given this variation in the marginal cost for members to gather and use analytical information, interest group will target their contributions to members with low marginal costs to gather research, or equivalently, a high analytical policymaking capacity (analogous to Hall and Deardorff 2006). Given this set of incentives, I expect to observe heterogeneity among members in their analytical capacity. That is, members with a high analytical capacity will tend to focus on the intellectual and analytical aspects of policies that are of interest to organized groups, whereas those with low analytical capacity will tend to emphasize their identification with constituents. I label the former type “workhorse” and the latter type “show horse.” In practice, members fall anywhere along this continuous dimension.
Members cannot change from a show horse type to a workhorse type in the short run, because analytical capacity is largely a function of personal characteristics and background. However, the aggregate pattern of group contributions can affect the tradeoff between members' workhorse and show horse tendencies over the long term. First, groups' contribution patterns create incentives for members to develop their analytical capacity over the long term as a means to attract contributions, because this may be more desirable (and possibly more lucrative) than attending fundraisers or working the phone for contributions. Second, assuming contributions help secure reelection (Alexander 2005), at the margin elections may select higher capacity members across congressional election cycles.
Hard money contributions are often vilified in popular rhetoric. I argue, however, that contributions provide incentives for members of Congress to develop greater policy expertise, and hence make for better-informed legislation. Contributions and attention to policy analysis go hand-in hand, and in this sense, contributions create a positive externality for democracy.
HYPOTHESES
The empirical portion of this study examines committee members' patterns of participation in hearing debates over the Medicare program (as in Hall 1996). The hypotheses state expectations regarding the nature and quantity of questions committee members ask during hearings. Members' questions can focus on two alternative frames: analytical or experiential. Analytical questions elicit falsifiable statements from lobbyists that examine the instrumental aspects of policies such as general conditions, causes, or expected outcomes. The analytical aspects of policies are primarily of interest to elite policy watchers in D.C. such as interest groups, bureaucrats, and other legislators, and are relatively costly to ask because they require prior acquisition of information and allocation of staff capacity (Hall 1996, 89). In contrast, experiential questions elicit non-falsifiable individual experiences with a policy or program that personalize policies in a manner that is easily accessible to constituents. This classification parallels that of Peterson (1995), who in a study of how members of Congress gather and use health policy information, distinguishes between “policy-analytic knowledge” and “ordinary knowledge” (see also Peterson 1997, 1089). The key distinction centers on falsifiability (see Appendix A); the two types of discourse are aimed at very distinct audiences.
I examine the effects of each member's policy analytical capacity on her behavior in committee hearings as well as on her ability to attract contributions from interest groups. A member's analytical capacity depends on such things as her intelligence, interests, background and training, education, and her staff recruitment and allocation patterns. Thus a legislator's policy analytical capacity is not directly measurable.2
As I define it, analytical capacity is conceptually related to the need for evaluation, need for cognition, and the various knowledge scales of social psychology (see, e.g., Druckman and Nelson 2003).
An analogy comes from labor economics, where level of education is a costly signal to firms of latent productivity; those with higher capacity pursue higher degrees of education.
In the analysis below, I use a latent variable modeling approach to measure members' analytical policymaking capacity. I expect to observe heterogeneity among members in their latent tendency to ask analytical questions at hearings. Members with higher analytical capacity should tend to participate more often in hearings and pay closer attention to analytical discourse. Those with lower analytical capacity also may participate frequently in hearings, but across hearings should tend to engage in experiential discourse. Note that variation among members in their latent analytical capacity, combined with a negative correlation between members' tendency to engage in analytical and in experiential discourse, would help to confirm the validity of the member-level latent variable as a measure of analytical capacity. If a show horse member could mimic workhorses in a sustained manner, one would observe a positive correlation between members' tendencies to ask experiential and analytical questions. In this case, variation in the latent trait at the member level would simply capture loquaciousness.
Outcome-oriented groups tend to give contributions to committee members who are most effective in advancing their agenda (Box-Steffensmeier and Grant 1999; Denzau and Munger 1986), such as those who have a greater analytical capacity for policymaking. Increasing the analytical capacity latent trait should increase a member's contributions from groups. Since contributions and members' attention to policy analysis in committees both depend on a member's analytical capacity, these two outcome variables should be statistically co-determined (see Bronars and Lott 1997; Gordon 2001, 256n10). Consequently, I expect to observe a positive correlation between a member's aggregate contributions and her count of analytical questions at hearings. Outcome-oriented groups have few incentives to subsidize show horse committee members who have a strong tendency to engage in experiential discourse, a discourse that is compelling to constituents but not to interest groups. I expect to observe a negative correlation between a member's contributions and her count of experiential questions.
DATA AND METHODS
Much of the previous research on the topic of policy analysis in committee hearings makes use of non-random sampling, focusing on major—but not representative—“blockbuster” hearings for analysis (e.g., Peterson 1995; Esterling 2004). In this project, I have employed systematic random sampling of committee hearings on the Medicare program to generate a representative cross section of hearings on the topic.4
I defined the sampling frame using the hearing keyword “Medicare.” Hearings on Medicare are likely not representative of hearings of all issues in Congress. For example, a member who participates as a workhorse in hearings on other topics, and chooses to behave as a show horse in Medicare hearings, is observationally equivalent to a member who behaves as a show horse in all hearings.
I generated a population of 133 hearings using a Congressional Information Service database search using the keyword “Medicare” for the 2000–2003 time period.
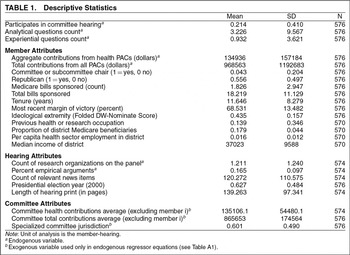
Given the sampling procedure, the basic unit of analysis is the member-hearing. Table 1 presents the descriptive statistics for the variables used in these analyses. The total number of valid member-hearings is 567 for 203 different committee members of nine different committees. I use GLLAMM hierarchical latent variable methods for the statistical analysis (Skrondal and Rabe-Hesketh 2004). The latent variable model measures two important but unobserved attributes that can affect a member's participation in a hearing: the member's analytical capacity and the degree to which an issue is information-driven (see Hall and Deardorff 2006). The latent variable model estimates the impact of these measured variables on the outcomes of interest, such as question counts and contributions. In addition, latent variables model dependence among response variables that are nonnormally distributed. Consequently, the latent variable approach allows me to address a long list of technical statistical issues that arise in my data, including issue- and member-level heterogeneity, the endogenous selection of members into hearings, endogenous regressors, correlations among the dependent variables, and overdispersion in the count processes (Skrondal and Rabe-Hesketh 2004, 17–18, 436).

The statistical analysis models a member's choice to participate in a committee hearing and, conditional on having participated, the quantity and nature of the questions she asks. The data for these hearing behaviors come from a manual count of sentences in the committee hearing prints; see Appendices A and B for the coding and reliability, and Table 1 for descriptive summaries. The measure of Participation in a committee hearing equals 1 if the member asks one or more of any type of question or statement at the hearing, and 0 otherwise. Consistent with Hall's (1996, 118) findings, participation in committee hearings is far from universal; a typical member in the sample only has about a 21% chance of participating in a hearing.
Conditional on participating in a hearing, members ask a variety of different types of questions.6
I follow convention and label all members' statements “questions” even though in practice members also make assertions, rebuttals, summaries, and other sentences not in the form of a question.
I label the analytical question count, the experiential question count, and participation as the “hearing behaviors.” I specify a separate equation to model each of the three observed hearing behaviors. Define a vector xj as a set of exogenous covariates, zj a set of endogenous regressors, εj an additive error term, and ηi as a (measured) latent variable. Let j index equations and i+1 index levels in the hierarchical model. Equations (1) to (3) define three linear predictors for an arbitrary member-hearing: AQ for the analytical question count; EQ for the experiential question count; and P* for participation.


The model treats members' participation in hearings as an endogenous selection problem. The outcomes for the AQ and EQ equations are observed if P = 1. Conditional on participating in a hearing, I model members' analytical and experiential question counts as overdispersed Poisson that can take integer values zero or greater. The outcomes for AQ and EQ have a log link and are Poisson distributed; the outcome for P has a probit link and is Bernoulli distributed.
Equations (1) to (3) include two latent variables as common factors:
is a member-hearing level, or “level 2,” random effect and
is a member level, or “level 3,” random effect. (The parenthetical index superscripts on the latent variables indicate the level at which the latent variable varies). The member-hearing level latent variable
measures any unobserved qualities of hearings that make members more likely to participate and ask the different types of questions. For example, one might expect members to ask more analytical questions on issues that, for whatever reason, are more technical in their nature. The member-level latent variable
measures member's latent analytical capacity. A member's analytical capacity depends on unobservable traits such as her intrinsic ability and interests, her education and background, and on her staff allocations and personnel recruitment.
The latent variables serve three purposes in the model. First, they help explain the hearing behavior, and the magnitude of the effect of these variables is captured in the estimated factor coefficients,
, where kj is the number of latent variables ηi included in equation j. Second, they allow estimation of the stochastic covariances across equations. Third, the member-hearing level latent variable accommodates overdispersion in the Poisson processes (see Miranda and Rabe-Hesketh n.d.; and Scrondal and Rabe-Hesketh 2004, 107–108).
The xj vectors (j=1 to 3) in equations (1) to (3) are exogenous covariates that may affect participation and questioning. I include whether the member is a committee or subcommittee Chair, her length of Tenure, the number of Medicare bills she Sponsored over the current year,7
Bill sponsorship arguably is an indicator of analytical capacity, but it also has an institutional component that makes it relationship to analytical capacity ambiguous (Wawro 2000, 33–34).
A measure of legislators' left-right ideological position, available at www.voteview.com.
Medicare enrollee data are from the Social Security Administration publication, “Social Security and SSI Statistics by Congressional District” for 2001. The contributions and margin of victory measures are from www.opensecrets.com. The sponsorship data are from www.thomas.gov.
capture the direct effects of the exogenous regressors, where lj is the number of exogenous variables in equation j.
In addition to exogenous control variables, equations (1) to (3) include four endogenous regressors zj (j=1 to 3), two measuring aggregate contributions and two measuring the informational content of hearings. The direct effect of these variables for the observed hearing behaviors are captured in the conformable parameter vectors
, where mj is the number of endogenous regressors included in equation j. To test the direct effects of contributions on participation and questioning, I include a variable measuring a member's Aggregate contributions from health groups donated in the same year as the hearing, as classified by the Center for Responsive Politics (www.opensecrets.org).10
A number of articles in the literature examine the behavioral effect of aggregate non-individual, non-party contributions (Langbein 1986, 1059; Grenzke 1989; Wright 1990, 427; Box-Steffensmeier and Grant 1999; Fellows and Wolf 2004). Contributions in the same time period as the observed behavior have a bigger impact compared to measures employing leads or lags (Grenzke, 8; Wawro 2001, 569n14).
I exclude the endogenous variable measuring total contributions from the equations for the analytical question count and the experiential question count. The variable for total contributions is highly correlated with the variable for health group contributions (r = 0.80), and including both variables in these equations causes the model to become empirically underidentified.
I also include two variables that measure the amount of information lobbyists communicate at the committee hearings, because as Hall and Deardorff (2006) note, information subsidizes a member's time and so its availability creates incentives for committee participation. I include a count of the lobbyists at the hearing who are employed by Research organizations such as think tanks, universities, or foundations. In addition, I include a measure of the informational content of lobbyists' testimony in the form of an average among all lobbyists on the panel for the Research content of their testimony, measured as the proportion of the lobbyist's arguments that cite research (see appendix A).12
To construct the counts of sentences in lobbyist testimony, I randomly sample 20 paragraphs from each written testimony (written statements have 35 paragraphs on average).
To accommodate these four endogenous regressors, I specify an additional four equations and allow the stochastic component to covary with those of the hearings behavior equations by way of the latent variables. Define the following linear predictors: HC for logged aggregate health contributions; AC for logged aggregate total contributions; IP for the proportion of panel testimony that is informative; and RO for the count of research organizations on the panel.


The outcomes for HC, AC, and IP have an identity link and are normally distributed, and RO has a log link and is Poisson distributed. (See Appendix E for the exogenous covariates xj, j = 4 to 7, included in these four endogenous regressor equations;
, j=4 to 7, are conformable parameter vectors). The endogenous regressors are each modeled with two levels. The contributions variables are affected by a member's analytical capacity and the variables measuring the informedness of testimony and the composition of hearing panels are affected by the technical demands of the issue at the hearing. Note that the model assumes that the ηi are correlated with all elements of zj, but uncorrelated with all elements of xj. Violations of this latter assumption can lead to biased coefficient estimates (Wawro 2001).
I estimate the system of equations simultaneously using full information maximum likelihood within the GLLAMM statistical framework and software (Skrondal and Rabe-Hesketh 2004). The likelihood function integrates over the two latent variable distributions and estimates the fixed effect coefficients
and
, factor coefficients
, and variances ω and
using MLE with adaptive quadrature.13
The numeric approximation for the likelihood function is very good. Increasing the number of integration points from 8 to 12 did not affect any of the parameter estimates up to seven significant figures. The results I present are based on the approximation with 12 integration points.
The smallest eigenvalue for the information matrix is greater than 0.30.
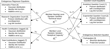
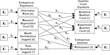
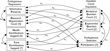
Figures 1a to 1c give a graphical depiction of the hierarchical latent variable model. Since the parameters for the seven equations are jointly estimated, to picture the model fully one must imagine the three figures superimposed on one another.

Model Equations with Latent Variables and Distributional Assumptions

Direct Effects

Implied Covariances
Figure 1a presents the hierarchical structure of the model and the distributional assumptions for the seven simultaneous equations. In Figure 1a, each box is an equation for an observed outcome (numbered with a square bracket), each oval is a latent variable, and the arrows indicate regressions on the latent variables. The model has a three-level structure and seven equations, two equations for the question count outcomes, one for endogenous selection, and four for the endogenous regressors. The member-level “analytical capacity” latent variable
captures level three heterogeneity for the hearing behaviors and contribution levels, and the member-hearing level “technical issue” latent variable
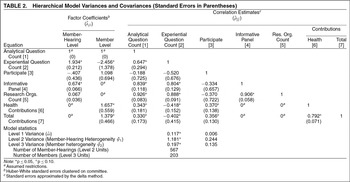
level 2 captures heterogeneity for the hearing behaviors and the observed measures of the informedness of each hearing. The λji parameters are the factor coefficients and are analogous to regression coefficients for the regression of the observed variables on the latent variables, where j indexes equations and i indexes the corresponding latent variable. The additive errors are εj, with j indexing equations. This figure accounts for 11 of the 75 free model parameters: eight factor coefficients, two latent variable variances, and a common additive error variance. I report these estimates in Table 2.

Figure 1b shows the fixed effect variables and parameters. The parameter vectors
are of order equal to the xj vectors of exogenous covariates, where j indexes equations. The parameter vectors
are of order equal to the zj vectors of endogenous covariates. The specification of covariates in each equation is given in the text above as well as in Tables 3 and 1a below. Figure 3b accounts for the remaining 64 of 75 free model parameters: 10 endogenous variable fixed effect parameters and 54 exogenous variable fixed effect parameters. Figure 1c depicts the correlations between equations that are induced by the common latent variables. I use equations (A1) through (A5) of appendix E to retrieve the covariances
, where j and
index equations. I report the estimated correlations among the residuals, or the
defined in equation (A6), in Table 2.

RESULTS
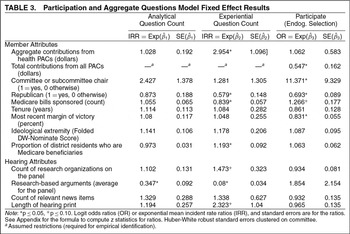
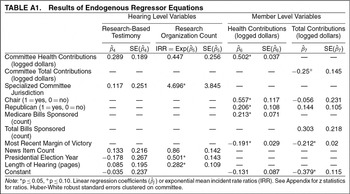
Table 2 reports the variances of the latent variables, factor coefficients, and induced correlations among the residuals. Table 3 gives the fixed effect estimates for both the exogenous and endogenous regressors for the three hearing behavior equations. I have placed the fixed effect results for the four endogenous regressor equations in Table A1 of the appendix.

I expect that members will have different analytical capacities and that this will be reflected in the variance of the member-level latent variable. That is, the member-level latent variables makes an inference regarding a member's “type,” as tending toward workhorse or toward show horse, by examining their behavior across hearings. Workhorses will tend to engage in analytical dialogue over many hearings, and this behavior is too costly for show horse members to mimic in a sustained manner. The standard deviation of this latent variable, equal to the square root of
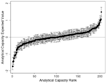
, is 0.44. One can see this variation graphically in Figure 2, which plots each member's empirical Bayes factor score predictions (the posterior mean of the level three latent variable from the model evaluated at the parameter estimates; see Skrondal and Rabe-Hesketh 2004, 225) against his or her rank. The vertical bars give a 95% confidence interval for each member's estimate. Figure 2 shows that, roughly, the lowest quartile of members is below average in analytical capacity and the highest quartile is above average.

Rank Order of Analytical Capacity Expected Values
One must be careful, however, in interpreting this rank ordering for individual members. Because the sampling frame is Medicare hearings, this latent variable measures a member's show horse or workhorse tendencies, conditional on participating in a Medicare hearing. If members develop analytical capacity on specific topics, through specialization, then the low-scoring members in Figure 2 might score high on analytical capacity using a dataset that sampled hearings on a different topic. Alternatively, if the workhorse–show horse dimension reflects an underlying type, then measured analytical capacity will be positively correlated across substantively different hearings. I return to this statistical and conceptual issue below.
Given this heterogeneity in the analytical capacity of members who participate in Medicare hearings, I expect an increase in analytical capacity to increase a member's tendency to attend to elite analytical discourse across hearings in my dataset, and at the same time to attract additional contributions from groups. I also expect that increasing analytical capacity will decrease a member's tendency to engage in experiential discourse.
The factor coefficients (
) I report in Table 2 are the estimated coefficients for the regression of the observed variables on the latent variables, regressions that are diagrammed in Figure 1a. I find that increasing a member's latent analytical capacity for Medicare policy enhances her tendency to attend to analytical discourse across Medicare hearings. I have scaled the member-level latent variable to members' tendency to ask analytical questions across hearings (λ21 ≡ 1). Counterfactually increasing this latent trait one standard deviation above the mean leads a member to ask 3.8 additional analytical questions at Medicare hearings, a quantity roughly equal to the mean of the analytical question count for all members.
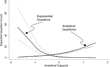
One can see this relationship graphically in Figure 3a. For this graph, the horizontal axis is the posterior Bayes estimate of latent analytical capacity (the vertical axis of Figure 2) and the vertical axis is the expected count of questions. The solid curves give the expected question counts for Republican nonchairs (the curve for Democrat non-chairs is very similar); the dotted lines give 95% confidence intervals.15
The simulation for the expected value sets the variable for chair to zero, party to one, and all other variables at their means; substitutes the empirical posterior Bayes prediction for each member (the dots in Figure 2); and plots the smoothed function values. I create the 95% confidence intervals in a similar fashion by substituting in the upper and lower bounds for each member's 95% confidence interval surrounding their estimated analytical capacity (the bars in Figure 2) and plotting the smoothed values.
Increasing analytical capacity decreases a member's expected count of experiential questions at hearings (
, p=0.031). One can see this relationship in Figure 3a with the solid, negatively sloped curve. This function shows that show horse members who have a low analytical capacity may participate actively at hearings, but they have a strong tendency to engage in low-cost experiential discourse. Decreasing the latent analytical capacity variable one standard deviation below the mean increases the expected count of experiential by nearly four questions, or roughly a standard deviation. Members of above-average analytical capacity typically ask very few experiential questions.

Plot of Expected Question Counts by Analytical Capacity
That the analytical question count variable is positively affected by the member level latent variable, and the experiential questions count is negatively affected, helps to identify this latent dimension as analytical capacity rather than some diffuse quality such as loquaciousness. This result is not an artifact of the member's time budget at a hearing because the experiential question count and analytical question count are not exhaustive of the types of statements members make at hearings. In the coding, it is possible for members to tend to engage frequently in both types of discourse. Indeed, despite the negative correlation between analytical and experiential questions counts at the member level, the overall correlation between analytical and experiential questions is positive (
, p=0.028) once one takes into account the positive covariance at the member-hearing level. The results show that workhorse and show horse types separate in the statistical analysis; show horses do not mimic workhorses in a sustained manner across hearings.
At the same time, the factor coefficients in the regressions of the two endogenous contributions variables on the member level latent variable are positive and significant, indicating that contributions flow to members who have greater analytical capacity. Increasing analytical capacity increases contributions both from health groups (
, p=0.023) and from all groups (
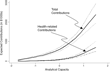
, p=0.022). Figure 3b illustrates the substantive scale of this effect. Increasing the analytical capacity latent variable by one standard deviation above the mean (from 0 to 0.44) increases health contributions by 0.73 of a standard deviation above the mean in logged dollars, which is approximately $94,000 or 72% of the average contributions from health groups. Likewise increasing analytical capacity by this much increases all contributions by approximately $431,000 or 45% of the average.

Plot of Expected Contributions by Analytical Capacity
Recall that the analytical capacity measured here is specific to the Medicare program, and so the greater marginal effect of analytical capacity on contributions from health groups (
, p=0.079) indicates that groups tend to subsidize members with similar substantive interests (Hall and Deardorff 2006). At the same time, the absolute increase in total contributions from an increase in analytical capacity is much larger for total group contributions than from health PAC contributions. This suggests, but does not confirm, that measuring analytical capacity from Medicare hearings indicates a member's overall type as show horse versus workhorse. If each member specialized in a different policy topic, and if specializing is equally lucrative across all topics, then total contributions should be constant across members. By my argument, that members who specialize in Medicare policy attract contributions from nonhealth PACs suggests that workhorse members in these hearings also behave as workhorses on other topics.
The findings depicted in Figures 3a and 3b support my argument that contributions create incentives for members to build analytical capacity. Of course, these incentives will not cause all members to rush to become policy experts, even in light of the pecuniary advantages. It takes time and resources to develop analytical capacity for policymaking. In addition, some members might not find this investment worthwhile, given their characteristics and electoral situation.
Since contributions and attention to analytical discourse both covary with a member's latent analytical capacity, the correlations between the analytical questions count and each of the two contributions endogenous regressors are positive. The induced correlation between the analytical questions and health contributions residuals is 0.343 (
, p=0.058) and between analytical questions and total contributions is 0.330 (
, p=0.057). In this sense, contributions and attention to analysis in committees go hand-in-hand.16
In my theory, the aggregate pattern of contributions creates a long term incentive for members to develop analytical capacity. Although I demonstrate the existence of these incentives, I cannot test for the simultaneous relationship empirically since the statistical model would no longer be identified.
, p=0.006) and −0.402 for total contributions (
, p=0.006). In other words, show horses do not tend to attract contributions from groups.
There is little evidence that members self-select their participation in hearings in a manner correlated with analytical capacity. Neither of the two factor coefficients on the member-hearing or member-level latent variable is significant in the participation equation. This implies that members have few intellectual barriers to participate in committee hearings. In particular, members can state opinions or engage in experiential discussions at relatively low cost, irrespective of the technical nature of the issue or their analytical capacities. There is a positive correlation, however, between participation and contributions. The correlation among the residuals between participation and aggregate health contributions is 0.370 (
, p=0.007); the correlation between participation and total contributions is 0.356 (
, p=0.006). This positive association between participation in committee hearings and contributions is partially a replication of the Hall and Wayman (1990) “mobilization of bias” results, which demonstrate that contributions mobilize committee members to become active on issues of interest to the contributing groups. The association I identify, however, does not establish a causal direction between committee behavior and group subsidies.
The member-hearing (or issue-)level latent variable (level 2) variance
\, is scaled in the analytical questions equation (1) and also is positive, with a standard deviation 1.09 (p = 0.001). This indicates there is heterogeneity across issues: some hearings are more analytical and information-driven than others. There are two endogenous regressors that indicate the relative informativeness of the hearing. The issues where the committee tends to schedule lobbyists who present research-based arguments (
0.674, p < 0.001) are also the issues where members tend to ask both analytical (λ11 ≡ 1) and experiential questions (
1.93, p < 0.001). Some issues are more technical than others, and committees appear to schedule informative lobbyists when the committee members have a general interest, whether analytical or not, in the policy. One can see this in the correlations in the residuals for this informative panel measure and the count of analytical questions (
0.84, p < 0.001). The informative panel residuals also are positively correlated with the residuals of the count of experiential questions (
0.80, p < 0.001).
In contrast, the count of research organizations at a panel is not closely related to this “technical issue” factor (
0.067, p = 0.595). That the count of research organizations does not reliably indicate the informativeness of a panel is sensible, suggesting that it is the content of testimony that matters more than the mere attribute that the lobbyist is employed at a research organization. The correlations between the residuals of the count of research organizations and the count of analytical questions (
, p < 0.001), and between the count of research organizations and the count of experiential questions (
0.89, p < 0.001) are both large and positive. This latter result is likely because the correlation between the informative panel variable and the research organization count variable is nearly exact (
0.91, p < 0.001).
Table 3 shows the results for the fixed effect variables in the three hearing behavior equations. Among the exogenous fixed effect variables, the pattern of the estimated coefficients for sponsorship of Medicare bills parallels those of latent analytical capacity. Increasing the number of Medicare bills sponsored by one standard deviation above the mean increases participation by 26.6% above the baseline average and decreases experiential questions by 16% below the baseline. The direct effect of Medicare bills sponsored on analytical questions is not statistically significant, but the point estimate indicates a 6% increase above the baseline from a one standard deviation increase, and this marginal effect is statistically greater than that for experiential questions; the difference in this marginal effect between analytical question count and experiential question count is 21.7% (p = 0.010). In addition, the linear combination of the marginal effect for participation and the analytical question count from a one standard deviation change in sponsorship is associated with 29% increase in analytical questions over the baseline (p = 0.109). Although there are many institutional reasons why a member will sponsor a bill (Wawro 2000, 33–34), these findings suggest that bill sponsors tend to act as workhorses in the sense of engaging in analytical but not experiential discourse.
Holding constant a member's latent analytical capacity, several fixed effects results lend support to Fenno's (1978, 134; see also Hall 1996, 30) assertion that members use hearings to connect with constituents even as they engage in technical policy work that constituents otherwise would find inaccessible. First, notice that the direct effect of increasing the proportion of the district residents who are current Medicare beneficiaries by one standard deviation above the mean, or by about 5%, increases experiential questions by 19% (p = 0.022). Holding analytical capacity constant, members appear to use the hearing to publicly demonstrate their empathy and accountability, behavior Fenno labels “presentation of self.” Although statistically significant, this is a substantively small effect. Only members who are about one standard deviation above the average on the experiential question count variable (or expected to ask five experiential questions) would be expected to ask an additional question. This suggests that a member who especially is concerned with connecting with constituents will feel the need to attend to constituent interests using accessible and empathetic dialog in committee hearings.
Second, notice that the direct effect of contributions from health groups, holding constant analytical capacity, increases the expected experiential question count. Increasing health contributions by one standard deviation above the mean increases experiential questions by 195% (p = 0.004), an additional two experiential questions on average or about half of a standard deviation increase. At the same time, I demonstrate above that contributions and the tendency to ask experiential questions are negatively related: increasing a member's latent analytical capacity increases contributions and decreases the member's tendency to ask experiential questions. So the direct effect of contributions must be understood as marginal, holding constant a member's analytical capacity. As a typical member takes in more contributions, she will strive to enhance her “presentation of self” (Fenno 1978, 58–9) in public hearings by asking experiential questions.
The direct effect of total contributions reduces participation in health policy hearings, holding constant health-related contributions and analytical capacity. Increasing total contributions one standard deviation above the mean decreases participation by 45% below the baseline probability of 0.21, approximately a 9% decrease (p = 0.041). This finding also partially replicates the Hall and Wayman (1990) findings; receiving a greater proportion of contributions from groups that are not interested in health policy tends to mobilize members away from these health policy hearings.
Finally, consider the direct effects of information in the hearing behavior equations. Increasing the count of research based organizations on the panel by one standard deviation above the mean increases experiential questions by 47% of the baseline (p = 0.077). This finding suggests there is some expressive value in posing questions to those who are occupationally labeled “experts.” In contrast, holding constant the technical nature of the issue, increasing research-based information from lobbyists by one standard deviation leads members to ask 65% fewer analytical questions (or two fewer questions, p < 0.001) and 92% fewer experiential questions (or about one fewer, p < 0.001). This suggests there is a cost to asking questions of informed experts in a public hearing, with the information asymmetry problem perhaps easier to solve behind the scenes (Austen-Smith 1995). The research-based informed panel measure suppresses analytical questions at a lesser rate than experiential questions (the difference in marginal effect is 26.7%, p < 0.001); so when members do pose policy questions to these informed panels they tend focus on the analytical aspects of policies.
Supplemental Validity Analysis
Up to this point, I have interpreted the member-level latent variable as a measure of the member's “analytical capacity” based on the pattern of factor coefficients, as is the convention among factor analysis practitioners. Because this latent variable is closely associated with members' tendency to engage in analytic discourse and not to engage in experiential discourse, I label this latent dimension “analytical capacity.”17
In a separate analysis (not reported), I lend additional support that this latent variable measures analytical policymaking capacity. I regressed the count of Medicare bills the member sponsored on the member-level latent variable, and corresponding factor coefficient was positive and significant (p = 0.055). I take this variable as exogenous since sponsorship has many institutional, non-individual determinants.
I do not use the count of analytical questions to support agency staff to estimate the random effects in the full model because of the sparseness of the data (members ask too few questions of these witnesses).
The main independent variable is the member's empirical Bayes factor score predictions, depicted in Figure 2. For control variables, I include the member level variables from the main model. Here, increasing a member's estimated analytical capacity one standard deviation above the mean increases analytical questions posed to support agency personnel by 83% (p < 0.05) of the baseline, or about two additional questions, an increase approximately equal to the mean of the support agency question count variable. By contrast, increasing constituent interests by one standard deviation above the mean, measured as the percent of the district who are Medicare beneficiaries, decreases the analytical question count to support agency personnel by 29% (p < 0.05). This finding suggests members face a tradeoff between engaging in the analytical aspects of policies and improving their identification sense of empathy with constituents.
DISCUSSION
I show that hard money contributions and members' tendency to engage in analytical discourse and workhorse behavior tend to go hand-in-hand. Members with a higher analytical capacity to work on policies receive more contributions from groups and at the same time are more likely to ask analytical questions regarding the conditions, internal mechanics, or the current or likely future effects of policies at Medicare hearings. Members who focus on the symbolic aspects of policies, aspects that are of interest to constituents, tend to receive fewer contributions. In the short run, members are unlikely to be able to change their analytical capacity as a means to attract contributions, because this depends on such things as a member's personal traits, background, and staffing patterns. The aggregate pattern of contributions does give members a strong incentive to increase their analytical capacity in the long run. In addition, assuming greater contributions increase the probability that a member gets reelected, the electoral process may tend to select high capacity legislators across election cycles. These results support the claims of Hall and Wayman (1990) and Hall and Deardorff (2006) that interest groups often serve as service bureaus that expand the policymaking capacity of Congress.
To see the institutional effect of contributions requires one to consider the effect of aggregate contributions over and above the motivation behind individual contributors to purchase legislation and votes. To draw an analogy, like members' offices, firms differ in their degree of production efficiency, which they cannot change instantaneously. The profit motive gives firms incentives to improve productive efficiency over time through the construction of new facilities and new technology. In addition to improvements in the quality of firms' products, as a by-product efficiency improvements may inadvertently reduce air pollution if the new facility has reduced emissions (Tietenberg 2006). In this case, profits and emissions reductions can be positively correlated, even when consumers are unwilling to pay a higher price for goods that happen to be produced in clean facilities.
In contemporary regulatory policy, many policy analysts believe that government intervention can more effectively reach social goals using incentives rather than command-and-control approaches to regulation (Schultze 1977). The command-and-control approach to campaign finance reform would ban contributions and put in place public financing where each candidate gets a fixed lump sum (e.g., Mathias 1986). In my argument, this regulatory approach would reduce members' incentives to improve productive efficiency in specific policy areas because public financing gives each member a constant marginal probability of reelection, and there is little incentive in the electoral connection that compels members to attend to the analytical aspects of specific policies. The current system of private campaign finance, its other flaws notwithstanding, in effect creates a market for expertise and policy capacity that in some ways furthers the ends of good government and deliberative democracy.
CONCLUSION
Good government reformers periodically sound the alarm regarding hard money contributions in U.S. legislative politics (Bolling 1986; Mathias 1986; Claybrook 2000; Common Cause 2004). If one accepts the normative standards of deliberative democracy, where participants rely only on information and persuasion, the mere presence of contributions is reason for concern. As money exchanges hands, many wonder whether the recipient legislator will attend carefully to the “special interests” of the contributing group, interests that presumably lack public justification. This paper demonstrates that campaign contributions create long-run incentives for members to augment their analytical capacities, a type of subsidy that, perhaps unintentionally, improves the policymaking capacity and professionalism of the legislature. In this sense, hard money contributions provide a normative good to democracy. Augmenting the analytical capacity of Congress is in many ways socially desirable but is likely not the intent of individual PACs.
Even if one accepts this argument, however, a larger normative concern remains. As Hall and Wayman (1990, 815; also Hall 1996: 5) note, money always distorts the nature of legislative deliberations. To Hall and Wayman (1990), the mobilization of bias is among topics, where a contribution can induce a member to work on topic X instead of topic Y, even if her constituents would like her to prioritize her work on Y. I show in addition that contributions over the long run can lead members to favor the analytical aspects of policies that are of primary concern to organized groups over the symbolic aspects of policies that resonate with constituents. If one believes that the end of democratic politics is the direct expression of constituent interests through their representatives, then these effects of contributions are bad for democracy. Alternatively, if one believes that constituent preferences tend to be uninformed, and that the end of democratic politics is the production of informed policies regarding pressing social and economic problems, then contributions are good for democracy.
How one resolves this larger normative issue should affect one's position on campaign finance reform, and on the question of whether it is desirable to banish private money from politics. If one feels that democracies should prioritize the direct, if uninformed, preferences of constituents, one should loudly echo the call for limiting hard money contributions from the private sector (e.g., Bolling 1986; Mathias 1986; and Claybrook 2000). If one believes the end of democracy is to construct policies informed by research and evidence, however, one might be more hesitant in this call. Indeed, one could imagine framing PAC contributions as a tax on groups, which in turn subsidizes a public good of improved analytical capacity and increased professionalism in the legislature. To the extent contributions decrease electoral competitiveness, one must decide an optimal tradeoff between competitiveness and professionalism of the legislature. In this view, the normative worth of campaign contributions is more complex and nuanced than is commonly recognized, and empirical research in this vein should enter into debates over the need for and nature of reform.
APPENDIX A: CODING CATEGORIES FOR QUESTIONS AND ARGUMENTS
For both members' questions and lobbyists' testimony, I use an identical coding scheme that mutually exclusively and exhaustively classifies statements. I group subcodes as analytical arguments, experiential arguments, and other.
Analytical arguments are positive, falsifiable statements about the conditions or problems the policy is intended to address, causal effects of governmental action, or the internal mechanics of a policy instrument. Codes: verifiable factual statement regarding the conditions for policy action; description of how a program, policy, or organization operates at a general level; causal implication or argument about the effect of a current policy or program; and the hypothetical future effects of a proposal. Lobbyists' analytical arguments have a supplemental code for the type of research cited to support the argument. Analytical arguments are considered high cost if they cite external research to support the claim made in the statement, and low cost if they do not cite research. The following are the coding categories for the types of research cited: a citation to a peer review journal, research bulletin, or a GAO or CBO study; a citation to an interest group report; a citation to a commission report or agency study; an undocumented statistical finding; a general citation to the research literature; and other research.
Experiential arguments only reference the speaker's immediate experience, or the immediate experience of one's organization, with a policy or in a program. In contrast to analytical statements, these are nonfalsifiable. Codes: A person's or organization's particular experience in a program; and likely effects from program or an alternative generalized from personal experience. There are two residual categories of arguments. Opinion-based arguments are normative statements and position or preference statements that are explicitly qualified as the author's own belief or opinion. Miscellaneous arguments are mostly transition statements, or opening salutations or closing remarks.
APPENDIX B: RELIABILITY TESTS FOR CODING
A research assistant independently recoded a random sample of lobbyist statements (N = 578) for an intercoder reliability test, and the principle investigator re-coded a second random sample (N = 711) one year after completing the first round of coding to conduct an intracoder reliability test. The Cohen's Kappa reliability statistic for the intercoder reliability test is 0.57 with a 71% agreement rate (32% expected, p < 0.0001), and for intracoder reliability is .79 with an 85% agreement rate (30.5% expected, p < 0.0001). While there are no established thresholds for reliability, a kappa statistic in the range of .75 to .80 is widely considered excellent agreement beyond chance, and .40 to .75 fair to good agreement beyond chance (Neuendorf 2002, 143). All member questions were double-coded by both the research assistant and the principal investigator, with the latter resolving disagreements.
APPENDIX C: COEFFICIENT INTERPRETATION
The raw coefficients in logit and exponential mean count models are not easily interpreted, so I present all results as probability and incident rate ratios (respectively). These ratios are simply the exponentiated raw coefficients, and the standard errors are calculated as the product of the ratio and the untransformed standard error. To retrieve Z scores from the transformed parameters, divide the ratio by its standard error, and multiply that quantity by the natural log of the ratio. In all regressions, I standardize the continuous independent variables to improve convergence; as a side benefit, this transformation of the independent variables allows for a direct interpretation of all odds and rate ratios for the continuous variables as the effect of changing the variable from its mean to one standard deviation above the mean. The corresponding interpretation for the dichotomous variables comes from comparing the zero to the one category. The tables of raw estimates are available from the author on request.
APPENDIX D: ENDOGENOUS REGRESSOR EQUATIONS
The statistical model includes equations for each of four endogenous regressors. I include covariates in the contributions endogenous regressor equations that do not measure analytical capacity but that may also explain groups' contribution patterns. These include institutional variables such as whether the member is a committee chair, a member of the majority party, bill sponsorship activity, and the most recent margin of victory (I treat this last variable as exogenous to contributions because it is in effect a lagged variable). To capture omitted institutional correlates of contributions, I include the Committee's average aggregate contributions from both health groups and from all groups. To make this measure exogenous, I summed aggregate contributions across all members of the committee excluding the member whose aggregate contributions is being instrumented, and divide by the number of committee members minus one. In the equations for the endogenous information content variables, I include variables that indicate the salience of the issue: the news item count, the length, and an indicator variable if the hearing was held in a Presidential election year, which equals 1 if the year was 2000, and 0 otherwise. To measure committee policy capacity, I include the committee average health contributions instrument and a dummy variable for Specialized committee jurisdiction, which equals 1 if the subcommittee jurisdiction is primarily related to health (Ways and Means Subcommittee on Health; Commerce subcommittee on Health and the Environment).
I present the parameter estimates for the four endogenous regressor equations in Table A1. Space does not permit a discussion of these results. There is overall very little power in the informative panel and the research organization count equations since there are only 23 distinct hearings in the data set and because the results are clustered on committee. In the health contributions equations, the instrument for a member's aggregate health contributions is statistically significant. In addition, being a chair, being a member of the majority party, sponsoring Medicare bills and having a narrower margin of victory in the previous election attract additional contributions from health groups. In the total contributions equation, having a narrower margin of victory in the previous election also increases total contributions.
APPENDIX E: INDUCED CORRELATIONS AMONG EQUATIONS
Let j index equations and i+1 index levels in the multilevel model. Define the residual for each linear predictor as
, the sum of all included latent variables (multiplied by their respective factor coefficients) and additive error (if present). Assume the following distributions for the stochastic components:

Each stochastic variable is centered at zero. The variances
and ω are free parameters; ω is assumed constant for identification.
I derive the variances and covariances among the residuals from the estimated parameters using the covariance formula cov(X, Y) = E(XY) − [E(X)E(Y)] for arbitrary random variables X and Y. The formula yields a variance when X=Y. Application of this rule to the equations yields:


To construct the correlations
reported in Table 2, where j and
index equations, divide the covariance between two variables by the square root of the product of the variances of the two variables, as in equation (A6).19
I computed the standard errors for the correlations
using the delta method as implemented in Stata 9.

This project has received generous funding through a fellowship from the Robert Wood Johnson Scholars in Health Policy Research Program; through a fellowship at the A. Alfred Taubman Center for Public Policy at Brown University, and through two grants from the UC Riverside Academic Senate. An earlier version of this paper was presented at the Annual Meetings of the American Political Science Association, Chicago, Illinois, 2004. I thank Shaun Bowler, Jay Hamilton, Yoi Herrera, Marie Hojnacki, Martin Johnson, Bryan Jones, Andy Kydd, Mike Neblo, Mark Smith, Laura Stoker, Wendy Wong, Antoine Yoshinaka, participants in a seminar at the University of Washington Center for American Politics and Public Policy, and three anonymous reviewers for very helpful comments. I also thank Mike Sugar and Wendy Wong for excellent research assistance.



Comments
No Comments have been published for this article.