



%20--%3e%3c!DOCTYPE%20svg%20PUBLIC%20'-//W3C//DTD%20SVG%201.0//EN'%20'http://www.w3.org/TR/2001/REC-SVG-20010904/DTD/svg10.dtd'%3e%3csvg%20version='1.0'%20id='Layer_1'%20xmlns='http://www.w3.org/2000/svg'%20xmlns:xlink='http://www.w3.org/1999/xlink'%20x='0px'%20y='0px'%20width='64px'%20height='64px'%20viewBox='5.5%20-3.5%2064%2064'%20enable-background='new%205.5%20-3.5%2064%2064'%20xml:space='preserve'%3e%3cg%3e%3ccircle%20fill='%23FFFFFF'%20fill-opacity='0'%20cx='37.785'%20cy='28.501'%20r='28.836'/%3e%3cpath%20fill='%23595959'%20d='M37.441-3.5c8.951,0,16.572,3.125,22.857,9.372c3.008,3.009,5.295,6.448,6.857,10.314%20c1.561,3.867,2.344,7.971,2.344,12.314c0,4.381-0.773,8.486-2.314,12.313c-1.543,3.828-3.82,7.21-6.828,10.143%20c-3.123,3.085-6.666,5.448-10.629,7.086c-3.961,1.638-8.057,2.457-12.285,2.457s-8.276-0.808-12.143-2.429%20c-3.866-1.618-7.333-3.961-10.4-7.027c-3.067-3.066-5.4-6.524-7-10.372S5.5,32.767,5.5,28.5c0-4.229,0.809-8.295,2.428-12.2%20c1.619-3.905,3.972-7.4,7.057-10.486C21.08-0.394,28.565-3.5,37.441-3.5z%20M37.557,2.272c-7.314,0-13.467,2.553-18.458,7.657%20c-2.515,2.553-4.448,5.419-5.8,8.6c-1.354,3.181-2.029,6.505-2.029,9.972c0,3.429,0.675,6.734,2.029,9.913%20c1.353,3.183,3.285,6.021,5.8,8.516c2.514,2.496,5.351,4.399,8.515,5.715c3.161,1.314,6.476,1.971,9.943,1.971%20c3.428,0,6.75-0.665,9.973-1.999c3.219-1.335,6.121-3.257,8.713-5.771c4.99-4.876,7.484-10.99,7.484-18.344%20c0-3.543-0.648-6.895-1.943-10.057c-1.293-3.162-3.18-5.98-5.654-8.458C50.984,4.844,44.795,2.272,37.557,2.272z%20M37.156,23.187%20l-4.287,2.229c-0.458-0.951-1.019-1.619-1.685-2c-0.667-0.38-1.286-0.571-1.858-0.571c-2.856,0-4.286,1.885-4.286,5.657%20c0,1.714,0.362,3.084,1.085,4.113c0.724,1.029,1.791,1.544,3.201,1.544c1.867,0,3.181-0.915,3.944-2.743l3.942,2%20c-0.838,1.563-2,2.791-3.486,3.686c-1.484,0.896-3.123,1.343-4.914,1.343c-2.857,0-5.163-0.875-6.915-2.629%20c-1.752-1.752-2.628-4.19-2.628-7.313c0-3.048,0.886-5.466,2.657-7.257c1.771-1.79,4.009-2.686,6.715-2.686%20C32.604,18.558,35.441,20.101,37.156,23.187z%20M55.613,23.187l-4.229,2.229c-0.457-0.951-1.02-1.619-1.686-2%20c-0.668-0.38-1.307-0.571-1.914-0.571c-2.857,0-4.287,1.885-4.287,5.657c0,1.714,0.363,3.084,1.086,4.113%20c0.723,1.029,1.789,1.544,3.201,1.544c1.865,0,3.18-0.915,3.941-2.743l4,2c-0.875,1.563-2.057,2.791-3.541,3.686%20c-1.486,0.896-3.105,1.343-4.857,1.343c-2.896,0-5.209-0.875-6.941-2.629c-1.736-1.752-2.602-4.19-2.602-7.313%20c0-3.048,0.885-5.466,2.658-7.257c1.77-1.79,4.008-2.686,6.713-2.686C51.117,18.558,53.938,20.101,55.613,23.187z'/%3e%3c/g%3e%3c/svg%3e)
%20--%3e%3c!DOCTYPE%20svg%20PUBLIC%20'-//W3C//DTD%20SVG%201.0//EN'%20'http://www.w3.org/TR/2001/REC-SVG-20010904/DTD/svg10.dtd'%3e%3csvg%20version='1.0'%20id='Layer_1'%20xmlns='http://www.w3.org/2000/svg'%20xmlns:xlink='http://www.w3.org/1999/xlink'%20x='0px'%20y='0px'%20width='64px'%20height='64px'%20viewBox='5.5%20-3.5%2064%2064'%20enable-background='new%205.5%20-3.5%2064%2064'%20xml:space='preserve'%3e%3cg%3e%3ccircle%20fill='%23FFFFFF'%20fill-opacity='0'%20cx='37.637'%20cy='28.806'%20r='28.276'/%3e%3cg%3e%3cpath%20fill='%23595959'%20d='M37.443-3.5c8.988,0,16.57,3.085,22.742,9.257C66.393,11.967,69.5,19.548,69.5,28.5c0,8.991-3.049,16.476-9.145,22.456%20C53.879,57.319,46.242,60.5,37.443,60.5c-8.649,0-16.153-3.144-22.514-9.43C8.644,44.784,5.5,37.262,5.5,28.5%20c0-8.761,3.144-16.342,9.429-22.742C21.101-0.415,28.604-3.5,37.443-3.5z%20M37.557,2.272c-7.276,0-13.428,2.553-18.457,7.657%20c-5.22,5.334-7.829,11.525-7.829,18.572c0,7.086,2.59,13.22,7.77,18.398c5.181,5.182,11.352,7.771,18.514,7.771%20c7.123,0,13.334-2.607,18.629-7.828c5.029-4.838,7.543-10.952,7.543-18.343c0-7.276-2.553-13.465-7.656-18.571%20C50.967,4.824,44.795,2.272,37.557,2.272z%20M46.129,20.557v13.085h-3.656v15.542h-9.944V33.643h-3.656V20.557%20c0-0.572,0.2-1.057,0.599-1.457c0.401-0.399,0.887-0.6,1.457-0.6h13.144c0.533,0,1.01,0.2,1.428,0.6%20C45.918,19.5,46.129,19.986,46.129,20.557z%20M33.042,12.329c0-3.008,1.485-4.514,4.458-4.514s4.457,1.504,4.457,4.514%20c0,2.971-1.486,4.457-4.457,4.457S33.042,15.3,33.042,12.329z'/%3e%3c/g%3e%3c/g%3e%3c/svg%3e)
%20--%3e%3c!DOCTYPE%20svg%20PUBLIC%20'-//W3C//DTD%20SVG%201.0//EN'%20'http://www.w3.org/TR/2001/REC-SVG-20010904/DTD/svg10.dtd'%3e%3csvg%20version='1.0'%20id='Layer_1'%20xmlns='http://www.w3.org/2000/svg'%20xmlns:xlink='http://www.w3.org/1999/xlink'%20x='0px'%20y='0px'%20width='64px'%20height='64px'%20viewBox='5.5%20-3.5%2064%2064'%20enable-background='new%205.5%20-3.5%2064%2064'%20xml:space='preserve'%3e%3cg%3e%3ccircle%20fill='%23FFFFFF'%20fill-opacity='0'%20cx='36.924'%20cy='28.403'%20r='28.895'/%3e%3cpath%20fill='%23595959'%20d='M37.442-3.5c8.99,0,16.571,3.085,22.743,9.256C66.393,11.928,69.5,19.509,69.5,28.5c0,8.992-3.048,16.476-9.145,22.458%20C53.88,57.32,46.241,60.5,37.442,60.5c-8.686,0-16.19-3.162-22.513-9.485C8.644,44.728,5.5,37.225,5.5,28.5%20c0-8.762,3.144-16.343,9.429-22.743C21.1-0.414,28.604-3.5,37.442-3.5z%20M12.7,19.872c-0.952,2.628-1.429,5.505-1.429,8.629%20c0,7.086,2.59,13.22,7.77,18.4c5.219,5.144,11.391,7.715,18.514,7.715c7.201,0,13.409-2.608,18.63-7.829%20c1.867-1.79,3.332-3.657,4.398-5.602l-12.056-5.371c-0.421,2.02-1.439,3.667-3.057,4.942c-1.622,1.276-3.535,2.011-5.744,2.2%20v4.915h-3.714v-4.915c-3.543-0.036-6.782-1.312-9.714-3.827l4.4-4.457c2.094,1.942,4.476,2.913,7.143,2.913%20c1.104,0,2.048-0.246,2.83-0.743c0.78-0.494,1.172-1.312,1.172-2.457c0-0.801-0.287-1.448-0.858-1.943l-3.085-1.315l-3.771-1.715%20l-5.086-2.229L12.7,19.872z%20M37.557,2.214c-7.276,0-13.428,2.571-18.457,7.714c-1.258,1.258-2.439,2.686-3.543,4.287L27.786,19.7%20c0.533-1.676,1.542-3.019,3.029-4.028c1.484-1.009,3.218-1.571,5.2-1.686V9.071h3.715v4.915c2.934,0.153,5.6,1.143,8,2.971%20l-4.172,4.286c-1.793-1.257-3.619-1.885-5.486-1.885c-0.991,0-1.876,0.191-2.656,0.571c-0.781,0.381-1.172,1.029-1.172,1.943%20c0,0.267,0.095,0.533,0.285,0.8l4.057,1.83l2.8,1.257l5.144,2.285l16.397,7.314c0.535-2.248,0.801-4.533,0.801-6.857%20c0-7.353-2.552-13.543-7.656-18.573C51.005,4.785,44.831,2.214,37.557,2.214z'/%3e%3c/g%3e%3c/svg%3e)
%20--%3e%3c!DOCTYPE%20svg%20PUBLIC%20'-//W3C//DTD%20SVG%201.1//EN'%20'http://www.w3.org/Graphics/SVG/1.1/DTD/svg11.dtd'%3e%3csvg%20version='1.1'%20id='Layer_1'%20xmlns='http://www.w3.org/2000/svg'%20xmlns:xlink='http://www.w3.org/1999/xlink'%20x='0px'%20y='0px'%20width='64.000977px'%20height='64px'%20viewBox='0%200%2064.000977%2064'%20enable-background='new%200%200%2064.000977%2064'%20xml:space='preserve'%3e%3cg%3e%3ccircle%20fill='%23FFFFFF'%20fill-opacity='0'%20cx='32.064453'%20cy='31.788086'%20r='29.012695'/%3e%3cg%3e%3cpath%20fill='%23595959'%20d='M31.943848,0C40.896484,0,48.476562,3.105469,54.6875,9.314453C60.894531,15.486328,64.000977,23.045898,64.000977,32%20s-3.048828,16.457031-9.145508,22.513672C48.417969,60.837891,40.779297,64,31.942871,64%20c-8.648926,0-16.152832-3.142578-22.513672-9.429688C3.144043,48.286133,0,40.761719,0,32.000977%20c0-8.723633,3.144043-16.285156,9.429199-22.68457C15.640137,3.105469,23.14502,0,31.943848,0z%20M32.060547,5.771484%20c-7.275391,0-13.429688,2.570312-18.458496,7.714844C8.381836,18.783203,5.772949,24.954102,5.772949,32%20c0,7.125,2.589844,13.256836,7.77002,18.400391c5.181152,5.181641,11.352051,7.770508,18.515625,7.770508%20c7.123047,0,13.332031-2.608398,18.626953-7.828125C55.713867,45.466797,58.228516,39.353516,58.228516,32%20c0-7.3125-2.553711-13.484375-7.65625-18.513672C45.504883,8.341797,39.333984,5.771484,32.060547,5.771484z%20M44.117188,24.456055%20v5.485352H20.859863v-5.485352H44.117188z%20M44.117188,34.743164v5.481445H20.859863v-5.481445H44.117188z'/%3e%3c/g%3e%3c/g%3e%3c/svg%3e)
1. Introduction
The study and control of liquid–liquid interfaces in microfluidic devices has profound applications in a wide variety of fields, spanning engineering (Magnaudet & Mercier Reference Magnaudet and Mercier2020), bio-engineering (Hütten et al. Reference Hütten, Sudfeld, Ennen, Reiss, Hachmann, Heinzmann, Wojczykowski, Jutzi, Saikaly and Thomas2004) and chemistry (Ruiz-Martín et al. Reference Ruiz-Martín, Moreno-Boza, Marcilla, Vera and Sánchez-Sanz2022a). Nowadays, there is increasing interest in the development of particle sorting devices, required in many medical and biological situations. Thus the motion of particles crossing or flowing near the liquid–liquid interface of immiscible fluids has attracted significant attention recently, with several studies trying to understand different aspects of the dynamics of the particles (Lee et al. Reference Lee, Amini, Stone and Di Carlo2010; Sinha et al. Reference Sinha, Mollah, Hardt and Ganguly2013; Moon et al. Reference Moon, Hakimi, Hwang and Tsai2014; Ruiz-Martín, Rivero-Rodriguez & Sánchez-Sanz Reference Ruiz-Martín, Rivero-Rodriguez and Sánchez-Sanz2022b). The stability of the fluid flow is, however, crucial to predict the dynamics of the dispersed objects. In this paper, we investigate the stability of viscosity-stratified immiscible liquids co-flowing in a channel with a train of particles in one of the layers. The influence of the train of particles on the linear stability of the liquid–liquid interface remains unknown, and will be in the scope of this work. To evaluate the global stability of the flow, we will consider a two-dimensional physical space and perform a linear instability analysis in which two spatial directions are resolved and a time-periodic small-amplitude disturbance is superimposed upon a steady  $O(1)$ two-dimensional basic state. The flow will be said to be globally stable if it is stable to all finite-amplitude perturbations (Theofilis Reference Theofilis2003).
Most particle separation strategies rely basically on the understanding of the migration forces acting on the dispersed objects (see e.g. Pamme Reference Pamme2007). Xuan et al. (Reference Xuan, Liang, He and Wen2022) investigate the control of the transverse position of different typical particles flowing in a microchannel via a unilateral slip boundary condition, which adjust the parabolic velocity profile. Rinehart et al. (Reference Rinehart, Lcis, Salez and Bagheri2020) demonstrate that slip inhomogeneities induce a lift force, such that the transition from slip to no-slip boundary conditions leads to the particles moving away from the boundary. In the two-layer flow studied in this paper, this slip boundary effect is equivalent essentially to regulating the viscosity stratification when the particle travels in the less viscous layer.
The presence of a train of particles flowing in the two-layer flow introduces a new instability mechanism, via the migration of the particle, that might interact with other instability mechanisms to stabilize or destabilize the interface. This effect, never studied before, constitutes the main goal of this paper. Previous work is limited basically to the study of the particle migration stability and to the study of the stability of self-assembled particles in a single-phase flow. Yan, Morris & Koplik (Reference Yan, Morris and Koplik2007), for example, studied numerically the stability of particle pairs in a linear shear flow. Imposing periodic boundary conditions, they demonstrated that two solid particles migrating from symmetric initial conditions can reach asymptotically mirror image limit cycles. Their results indicated that streamwise periodicity can lead to uniform inter-particle distance. Later, Lee et al. (Reference Lee, Amini, Stone and Di Carlo2010) investigated, from an experimental point of view, the formation and stability of longitudinal self-assembly of particles flowing in channels, uncovering the hydrodynamics mechanism that enables to maintain the inter-particle distance.
Previous studies on the field of the interfacial stability of two-phase flows in the presence of particles are practically non-existent. Hazra et al. (Reference Hazra, Malik, Mitra and Sen2022) examine the interplay of droplet migration and the deformation of two co-flowing immiscible liquids. Their study predicts the convective instability of the flow, with interface deformations induced by the droplet growing spatially downstream, whereas constant amplitudes are observed at a fixed location for a train of particles. Regarding rigid particles, the only related papers that we found in the literature are those by Khavasi, Firoozabadi & Afshin (Reference Khavasi, Firoozabadi and Afshin2014) and Khavasi & Firoozabadi (Reference Khavasi and Firoozabadi2019). The former considered the linear stability of particle-laden stratified shear flows. Yet the authors considered single-phase flows, with stratification due only to the presence of the particles. The latter work analysed the linear spatial stability of the particle-laden stratified shear layer considering, again, that the flow was not affected by the presence of the particles.
The main goal of this work is to study precisely the effect that the presence of particles in one of the fluids might have on the stability of the fluid–fluid interface. To do so, we will identify first the different instability modes to evaluate, and later, their interactions. Following the nomenclature introduced by Boomkamp & Miesen (Reference Boomkamp and Miesen1996), Yiantsios & Higgins (Reference Yiantsios and Higgins1988) and Charru & Hinch (Reference Charru and Hinch2000), the instability mechanism associated with the different modes can be divided into three types, which are listed below.
In the first place, we find the migration of the particles. This mode has been analysed thoroughly in Ruiz-Martín et al. (Reference Ruiz-Martín, Rivero-Rodriguez and Sánchez-Sanz2022b), assessing the stable or unstable character of the potential particle positions for different flow parameters. The onset of the migration instability is associated with an imperfect pitchfork bifurcation that takes place when a small change in the value of one parameter around a well-defined threshold triggers a modification on the state of the system. For a train of particles flowing in a single-phase channel, Rivero-Rodriguez & Scheid (Reference Rivero-Rodriguez and Scheid2018) showed the existence of imperfect pitchfork bifurcations of the particle position, with the inertial migration force as the imperfection, and the particle diameter as the varying parameter. In particular, pitchfork bifurcations correspond to steady-state bifurcations between fixed points, as opposed to Hopf bifurcations in which a steady-state solution evolves towards a limit cycle oscillation about the former steady state (see e.g. Seydel Reference Seydel2009; Iooss & Joseph Reference Iooss and Joseph2012; Strogatz Reference Strogatz2018). Indeed, for small Reynolds number, the damping effect of viscosity leads to overdamped modes for the migration of the particle in which a particle that moves slightly from its equilibrium position is dragged back to equilibrium without oscillation. This, as we will show below, gives zero imaginary part for the eigenvalue of the linear perturbation of the base flow, and provides a method to identify the migration mode among the infinite number of eigenvalues existing when inertia is present.
In the second place, we identify shear instability. This mode is a short-wavelength instability of the Tollmien–Schlichting type linked to shear effects, and appears only at sufficiently large Reynolds numbers  $Re$. For the small Reynolds numbers considered in this work, this mode will always be stable with the real part of the eigenvalues negative and of the order
 $O(Re^{-1})$.
Finally, we find interfacial mode instability, which is in the scope of this study. The interplay between the liquid–liquid interface and the hydrodynamics of the particle represents a complex phenomenon still to be understood, particularly concerning its impact on flow stability and interface behaviour. As we show later in the text, for the set of flow parameters considered in this work, this mode can be identified by looking at eigenvalues with positive real part and non-zero imaginary part. In the absence of the particles in the flow, the stability of the interface formed by two superposed liquids with different viscosities in plane Poiseuille flow was examined thoroughly by Yiantsios & Higgins (Reference Yiantsios and Higgins1988). In this work, the authors extended the analysis provided in the seminal work of Yih (Reference Yih1967), developing an asymptotic solution in the limit of very long waves, and demonstrating that the flow can be unstable to an interfacial wave regardless of how small the Reynolds number is. The conditions for the growth of the interfacial wave were also investigated in terms of the viscosity ratio, the thickness ratio, the density ratio and the Reynolds and capillary numbers. For density ratio equal to unity, they showed that the interfacial mode is neutrally stable when the thickness ratio is equal to the square of the viscosity ratio. For larger values of the thickness of the more viscous fluid, long waves are stable but short waves are not. As the more viscous layer narrows, the situation is reversed and the interface becomes unstable to long-wavelength perturbations. This phenomenon is known as the thin-layer effect and has been analysed previously by Hooper (Reference Hooper1985) and Renardy (Reference Renardy1985), among others. Yiantsios & Higgins (Reference Yiantsios and Higgins1988) also demonstrate that the stabilizing effect of surface tension decreases as the wavelength of the perturbation becomes larger, with surface tension being negligible in the asymptotic limit of very long waves. In the present work, we will examine the influence that the presence of a train of particles in one of the liquids has on the conditions for the growth of interfacial disturbances.
The paper is structured as follows. In § 2, we describe the mathematical formulation of the problem. First, the non-dimensional equations and boundary conditions for the base-state undisturbed flow are presented, followed by the formulation of the linear stability problem. Also, this section includes a description of the numerical method for solving the eigenvalue problem. The different instability mechanisms are presented in § 3, describing the specific features of each one that will allow us to identify them. Henceforth, the paper focuses on the interfacial mode, discussing the effect of the migrating train of particles. Relevant numerical results for different flow parameters are illustrated in § 4. We first study the influence of the particle position and inter-particle distance, and next we vary the Reynolds and capillary number. An overview of our new findings is given in § 5. To verify our numerical method, Appendix A illustrates the agreement of our linearized results with the local stability analysis of the two-layer channel flow, the solution for the migrating particle in a single-phase channel, or the temporal evolution of the perturbed base-state flow computed integrating the fully coupled equations. Appendix B contains mathematical details of the linearized boundary conditions at the perturbed particle surface and fluid–fluid interface. Finally, the interaction of the different instability mechanisms is investigated in Appendix C. To do so, the contribution of each mode is assessed by cancelling successively some artificial parameters introduced in the linearized equations.
2. Formulation of the problem
We consider the flow of two superposed immiscible liquids co-flowing in a two-dimensional channel with height  $h$, as depicted in figure 1, carrying volumetric flow rates
 $Q_1$ and
 $Q_2$, respectively. The total volumetric flow rate of the two liquids is
 $Q = Q_1 + Q_2$, and we assume that the liquids have equal density
 $\rho =\rho _1 = \rho _2$, but different viscosities
 $\mu _1 \neq \mu _2$, with subscripts
 $i=1$ and
 $i=2$ referring to the lower and upper fluids, respectively.
Schematics of the flow configuration, including the geometrical and fluid-dynamical relevant parameters. The centre panel refers to the general problem, and the right-hand panel to the linearized configuration.

The interface separating the fluids is located at  $y=\varGamma$, and it is described by the function
 $\varGamma =\varGamma (x)$ defining each fluid domain
 $\mathcal {V}_i$, as indicated in figure 1. Immersed in fluid 2, we consider a train of particles with the same diameter
 $d$ that travels with a downstream constant velocity
 $V$ while maintaining a constant rotational velocity
 $\varOmega$ around the centre of the particle.
As suggested by the experimental observations by Lee et al. (Reference Lee, Amini, Stone and Di Carlo2010), the particles form a periodic flow structure with a single line in which each particle is separated from its closest neighbour by a distance  $L$ and has negligible inertia.
To describe the dynamics of the system, we use a reference system attached to a particle that moves at its terminal velocity  $V$ so that the centre of the particle is located at
 $\boldsymbol {x}_{p} = y_p \boldsymbol {e}_y$. The transverse location of the particle
 $y_p$ depends on the intensity of the uniform volumetric force
 $\boldsymbol {f}$ acting on both liquids. This relation is explored thoroughly in Ruiz-Martín et al. (Reference Ruiz-Martín, Rivero-Rodriguez and Sánchez-Sanz2022b).
2.1. Transient problem
To write the problem in non-dimensional form, we use the channel height  $l_c=h$, the average velocity
 $u_c=Q/h$, the residence time
 $t_c=h^2/ Q$, and
 $p_c=\mu _2 Q/h^2$, as the characteristic length, velocity, time and pressure. Hereafter, all new variables refer to non-dimensional variables, and those introduced previously refer to their non-dimensional counterparts scaled with their characteristic values defined above.
Using this scaling, the dimensionless density and surface tension are the Reynolds number  $Re=\rho Q/\mu _2$ and the inverse of the capillary number
 $Ca = \mu _2 Q / \gamma h$. With these non-dimensional variables, the continuity and momentum equations yield
 \begin{gather} \boldsymbol{\nabla}\boldsymbol{\cdot} \boldsymbol{v}_{i} =0 , \end{gather}
 \begin{gather}Re \left(\dfrac{\partial \boldsymbol{v}_{i}}{\partial t}+ \boldsymbol{v}_{i} \boldsymbol{\cdot} \boldsymbol{\nabla} \boldsymbol{v}_{i} \right) = \boldsymbol{\nabla}\boldsymbol{\cdot} \hat{\boldsymbol{T}}_i , \end{gather}
with the reduced stress tensor given by  $\hat {\boldsymbol {T}}_i=-\hat {p}_i \boldsymbol {I} + \mu ( \boldsymbol {\nabla } \boldsymbol {v}_i + \boldsymbol {\nabla } \boldsymbol {v}_i^{\rm T} )$, and
 $\boldsymbol {v}_i$ and
 $\hat {p}_i$ the velocity and reduced pressure of fluid
 $i$, respectively. The viscosity ratio is
 $\mu =\mu _1/\mu _2$ if
 $y < \varGamma$, and
 $\mu =1$ if
 $y > \varGamma$.
To simplify the formulation and computation of the problem, (2.1)–(2.2) are written in terms of the reduced stress tensor  $\hat {\boldsymbol {T}}_i$, with the reduced pressure field defined in terms of the pressure
 $p_i$ and the external force,
 $\hat {p}_i = p_i -\boldsymbol {f}\boldsymbol {\cdot } (\boldsymbol {x}-\boldsymbol {x}_p)$. The uniform volumetric force
 $\boldsymbol {f}$ that is acting on both liquids is assumed to have only non-zero vertical component
 $\boldsymbol {f}=f \boldsymbol {e_y}$. Introducing the stress tensor
 $\boldsymbol {T}_i = - p_i \boldsymbol {I} + \mu ( \boldsymbol {\nabla } \boldsymbol {v}_i + \boldsymbol {\nabla } \boldsymbol {v}_i^{\rm T} )$ in (2.2), and taking into account that
 $\widehat {\boldsymbol {T}_i} = \boldsymbol {T}_i + \boldsymbol {f} \boldsymbol {\cdot } ( \boldsymbol {x}-\boldsymbol {x}_p ) \boldsymbol {I}$, we would recover the momentum equation written in the traditional way.
To simplify the characterization of the position of the interface and the particle in order to carry out the computation and interpretation of the results, we define the normalized positions of the particle and the interface,  $\xi = [ y_p-(\varGamma _{L/2}+d/2) ] / [ 1-(d+\varGamma _{L/2}) ]$ and
 ${\eta =\varGamma _{L/2}/(1-d)}$, with
 $\varGamma _{L/2}=\varGamma (L/2)$. The variable
 $\xi$ is in the range
 $0 \leq \xi \leq 1$, and the two extreme values of
 $\xi$ correspond to the particle touching the interface
 ${y_p=\varGamma _{L/2}+d/2}$ when
 $\xi =0$, or the channel wall
 $y_p=1-d/2$ when
 $\xi =1$, respectively (see figure 2). The normalized position of the interface
 $0\leq \eta \leq 1$ defines the extreme cases in which only fluid 2 runs through the channel (
 $\eta =0$) and in which the particle is squeezed between the interface and the upper wall (
 $\eta =1$), as illustrated in figure 2.
Definitions of the normalized positions (a,b) of the particle  $\xi$ with arbitrary
 $\eta$, and (c,d) of the interface
 $\eta$.

2.2. Boundary conditions of the transient problem
The system of equations given by (2.1)–(2.2) is subject to the following boundary conditions. First, we enforce equilibrium of forces on the particle and assume that the particle inertia is negligible,  $\int _{\varSigma _p} {\boldsymbol {T}}_2 \boldsymbol {\cdot } \boldsymbol {n}_p \,\mathrm {d} \varSigma = \boldsymbol {0}$. After substituting the stress tensor by its reduced counterpart and using Gauss's theorem to write
 $\int _{\varSigma _p} \boldsymbol {f} \boldsymbol {\cdot } (\boldsymbol {x}-\boldsymbol {x}_p) \boldsymbol {n}_p \,\mathrm {d} \varSigma = \int _{\mathcal {V}_p} \boldsymbol {\nabla }\{\boldsymbol {f} \boldsymbol {\cdot }(\boldsymbol {x}-\boldsymbol {x}_p)\} \,\mathrm {d}\mathcal {V} = \mathcal {V}_p \boldsymbol {f}$, this condition reads
 \begin{equation} \int_{\varSigma_p} \hat{\boldsymbol{T}}_2 \boldsymbol{\cdot} \boldsymbol{n}_p \,\mathrm{d} \varSigma = \mathcal{V}_p \boldsymbol{f} , \end{equation}
with  $\boldsymbol {n}_{p}$ the unit vector normal to the particle pointing towards the fluid, and
 $\mathcal {V}_p$ the volume occupied by the particle. Thus the external force
 $\boldsymbol {f}$ acting on the liquids can also be understood as the volumetric migration force acting on the particle with hydrodynamics origin. Note that the vector equation (2.3) determines the terminal velocity
 $V$ and the body force
 $f$.
Furthermore, on the surface of the particle, we also impose the torque balance and the no-slip condition, considering that the particle moves as a rigid solid:
 \begin{gather} 0 = \int_{\varSigma_{p}} \boldsymbol{e}_z \boldsymbol{\cdot} \left\{ \hat{\boldsymbol{T}}_2 \times (\boldsymbol{x}-\boldsymbol{x}_p)\right\} \boldsymbol{\cdot} \boldsymbol{n}_p \,\mathrm{d}\varSigma , \end{gather}
 \begin{gather}\boldsymbol{v}_{2} = \boldsymbol{\varOmega} \times (\boldsymbol{x}-\boldsymbol{x}_p) + \frac{{\rm d}\kern0.7pt\boldsymbol{x}_p}{{\rm d}t} \quad \hbox{at}\ \varSigma_{p} , \end{gather}
where  $\boldsymbol {e}_z=\boldsymbol {e}_x \times \boldsymbol {e}_y$, and the rotation occurs within the plane with rotational velocity
 $\boldsymbol {\varOmega }= \varOmega \boldsymbol {e}_z$.
No-slip boundary conditions are imposed at the channels walls  $y=0$ and
 $y=1$, i.e.
 \begin{equation} \boldsymbol{v}={-}V \boldsymbol{e}_x , \end{equation}
whereas at the borders of the computational domain  $x=\pm L/2$, we assume periodic boundary conditions
 \begin{equation} \left.\boldsymbol{v}\right|_{L/2} = \left.\boldsymbol{v}\right|_{{-}L/2} , \quad \left.\partial_x \boldsymbol{v}\right|_{L/2} = \left.\partial_x \boldsymbol{v}\right|_{{-}L/2} ,\quad \left.p\right|_{L/2}= \left.p\right|_{{-}L/2} - \Delta p . \end{equation}
The problem under study is a pressure-driven flow, with the pressure drop  $\Delta p$ being equal to the corresponding value for the Poiseuille flow plus a correction term due to the presence of the particle. This pressure drop is unknown initially, and it is calculated as part of the solution after the position of the particle is imposed. To calculate
 $\Delta p$ and the location of the interface position
 $\varGamma$, we enforce the total flow rate
 $1=Q_1+Q_2$ and the flow rate ratio
 $Q_1/Q_2$ such that
 \begin{gather} \int_{0}^{\varGamma} (u_1+V) \,\mathrm{d} y + \int_{\varGamma}^{1} (u_2+V) \,\mathrm{d} y = 1 , \end{gather}
 \begin{gather}\int_{0}^{\varGamma} (u_1+V) \,\mathrm{d} y = \frac{Q_1}{Q_2} \int_{\varGamma}^{1} (u_2+V) \,\mathrm{d} y , \end{gather}
where it has been taken into consideration that the average velocity has been chosen as the characteristic velocity to render the problem non-dimensional. Once  $\mu _1/\mu _2$ and
 ${\eta }$ are chosen, there is only a value of
 $Q_1/Q_2$ that satisfies mass conservation
 $Q_{1}+Q_{2}=1$.
The implicit equation  $q(x,y,t) \equiv \varGamma (x,t)-y=0$ is used to describe the evolution of the interface. Because
 $q=0$ defines the interface at all times, the material derivative must satisfy
 \begin{equation} \dfrac{\partial q}{\partial t} + \boldsymbol{v} \boldsymbol{\cdot} \boldsymbol{\nabla} q = 0 \quad \hbox{at} \ \varGamma . \end{equation}
Then the unit vector normal to the surface  $\varGamma$ pointing from fluid 2 towards fluid 1 is defined using the function
 $q$ as
 $\boldsymbol {n}=\boldsymbol {\nabla } q/|\boldsymbol {\nabla } q|=(\varGamma _x \boldsymbol {e}_x-\boldsymbol {e}_y)/\sqrt {1+\varGamma _x^2}$.
Additionally, at the fluid–fluid interface, we also impose the continuity of velocities and the jump condition on the stress tensor,
 \begin{gather} {}[\boldsymbol{v}] = \boldsymbol{0}, \end{gather}
 \begin{gather}\boldsymbol{n} \boldsymbol{\cdot} [ \hat{\boldsymbol{T}}] = Ca^{{-}1} \left( -\boldsymbol{n}\,\boldsymbol{\nabla} \boldsymbol{\cdot} \boldsymbol{n} \right) \quad \text{at} \ \varGamma, \end{gather}
with the bracket operator indicating the jump of the variable included between them, e.g.  ${[{\mathcal {L}}]={\mathcal {L}}_2-{\mathcal {L}}_1}$. Note that
 $[\hat {\boldsymbol {T}}]$ has been used, since
 $[\boldsymbol {T}]= [\hat {\boldsymbol {T}}]$.
2.3. Global linear stability problem
To initiate the analysis, we calculate the steady-state solution of the problem's variables  ${\hat {p}_{i,0}, \boldsymbol {v}_{i,0}, \varGamma _0, V_0, \varOmega _0, f, \Delta p}$ for a given position of the particle
 $\boldsymbol {x}_{p,0}$ by integrating the system of equations described in the previous subsection without the unsteady terms in (2.2), (2.4b) and (2.9). This steady-state solution, denoted by the subscript
 $0$, was studied by Ruiz-Martín et al. (Reference Ruiz-Martín, Rivero-Rodriguez and Sánchez-Sanz2022b). To perform a global stability analysis, we superimpose a time-periodic small-amplitude disturbance upon this steady two-dimensional solution. The flow will be said to be globally stable if it is stable to all finite-amplitude perturbations (Theofilis Reference Theofilis2003).
To carry out the stability analysis, we perturb both the interface and the position of the particle. To do so, we start by introducing a small normal disturbance  $\delta \boldsymbol {n}_{0}$ to the unperturbed fluid–fluid interface
 $\varGamma _0$, such that
 $\boldsymbol {x} + \delta \boldsymbol {n}_{0} \in \varGamma$ for
 $\boldsymbol {x} \in \varGamma _0$, where
 $\varGamma$ represents the perturbed interface. Similarly, the position of the centre of mass of the particle is perturbed as
 ${\boldsymbol {x}_{p} = \boldsymbol {x}_{p,0} + \Delta \boldsymbol {x}_{p}}$, such that
 $\boldsymbol {x}_p$ is the centre of mass of
 $\varSigma _{p}$, and
 $\boldsymbol {x}_{p,0}$ is the centre of mass of
 $\varSigma _{p,0}$, where
 $\Delta \boldsymbol {x}_p$ is a small vertical displacement of the particle such that
 $\Delta \boldsymbol {x}_p \boldsymbol {\cdot } \boldsymbol {e}_x =0$. Alternatively, it is sometimes more convenient to consider the normal displacement of the surface
 $\delta _p$, such that
 $\boldsymbol {x} + \delta _p \boldsymbol {n}_0 \in \varSigma _p$ for
 $\boldsymbol {x} \in \varSigma _{p,0}$, which also lies on the perturbed surface as long as
 $\delta _p = \Delta \boldsymbol {x}_p \boldsymbol {\cdot } \boldsymbol {n}_0$, where
 $\boldsymbol {n}_0=-\boldsymbol {n}_p$ is the normal of the unperturbed surface.
Notice that  $\delta$ and
 $\Delta \boldsymbol {x}_{p}$ are a priori unknown and will be determined as part of the calculation process. For this reason, to impose the boundary conditions at the perturbed geometry, our resolution strategy starts by writing (2.3), (2.4a) and (2.4b) for the particle, and (2.9) and (2.10) for the interface on the unperturbed geometry (see Appendix B for a detailed explanation of this step). After doing this, in a second step, we perform the stability analysis for the variables by introducing the expansion
 \begin{gather} \psi(\boldsymbol{x}, t) = \psi_0(\boldsymbol{x}) +{\epsilon\,{\rm e}^{\lambda t}}\,\psi_1 (\boldsymbol{x}) , \end{gather}
 \begin{gather}\delta(\boldsymbol{x}, t) = {\epsilon\,{\rm e}^{\lambda t}}\,\delta_1 (\boldsymbol{x}) , \end{gather}
 \begin{gather}\delta_p(\boldsymbol{x}, t) = {\epsilon\,{\rm e}^{\lambda t}}\,\delta_{p,1} (\boldsymbol{x}) , \end{gather}
 \begin{gather}\boldsymbol{x}_p(t) = \boldsymbol{x}_{p,0} + {\epsilon\,{\rm e}^{\lambda t}}\,\boldsymbol{x}_{p,1} , \end{gather}
where  $\psi =\{\hat {p}_i, \boldsymbol {v}_i, \varGamma, V, \varOmega$}, and the subscript
 $0$ indicates the steady-state values of the corresponding variables. The small vertical displacement of the particle is
 ${\Delta \boldsymbol {x}_p={\epsilon \,{\rm e}^{\lambda t}}\,\boldsymbol {x}_{p,1}}$ with
 $\boldsymbol {x}_{p,1} \boldsymbol {\cdot } \boldsymbol {e}_x=0$, and the amplitude of the perturbation is small,
 ${{\epsilon \,{\rm e}^{\lambda t}} \ll 1}$. Additionally,
 $\delta _{p,1} = \boldsymbol {x}_{p,1} \boldsymbol {\cdot } \boldsymbol {n}_0$ is the first-order displacement of the particle in the direction normal to
 $\varSigma _{p,0}$. Notice that neither
 $\Delta p$ nor
 $\boldsymbol {f}$ is expanded.
The eigenvalue  $\lambda =\lambda _r + {\rm i} \lambda _i$ is a complex number, with its real
 $\lambda _r$ and imaginary
 $\lambda _i$ parts representing the perturbation's growth rate and its oscillation frequency, respectively. The base flow is then unstable when the real part of at least one eigenvalue is positive,
 $\lambda _{r}>0$. Unlike Salgado Sánchez (Reference Salgado Sánchez2020), we do not consider perturbations in the value of the volumetric force
 $\boldsymbol {f}$, which is why this variable is not in the list of expanded variables in (2.11). Note that for a generic variable
 $\psi _{i,j}$, the subscript
 $j=0$ represents the base state, while
 $j=1$ represents the linearized variable. The subscript
 $i$ has been defined previously to refer to the lower layer when
 $i=1$ and the upper layer when
 $i=2$. Thus
 $\boldsymbol {v}_{1,0}$,
 $\boldsymbol {v}_{1,1}$ are the velocity fields of the lower liquid for the unperturbed and linearized problems, and
 $\boldsymbol {v}_{2,0}$,
 $\boldsymbol {v}_{2,1}$ represent the base-state and perturbed velocities corresponding to the upper liquid. Subsequently, the jump of the variable across the interface is denoted as
 ${[{\mathcal {L}}]_j={\mathcal {L}}_{2,j}-{\mathcal {L}}_{1,j}}$.
Substituting (2.11a) in the dimensionless Navier–Stokes (NS) equations, we obtain for order  $O(\epsilon )$ the following system for the linearized problem:
 \begin{gather} \boldsymbol{\nabla} \boldsymbol{\cdot} \boldsymbol{v}_{i,1} = 0 , \end{gather}
 \begin{gather}Re\, (\alpha_{NS} \lambda \boldsymbol{v}_{i,1} + \boldsymbol{v}_{i,0} \boldsymbol{\cdot} \boldsymbol{\nabla} \boldsymbol{v}_{i,1} + \boldsymbol{v}_{i,1} \boldsymbol{\cdot} \boldsymbol{\nabla} \boldsymbol{v}_{i,0}) =\boldsymbol{\nabla} \boldsymbol{\cdot} \hat{\boldsymbol{T}}_{i,1} , \end{gather}
with  $\hat {\boldsymbol {T}}_{i,1}=-\hat {p}_{i,1}\boldsymbol {I} + \mu ( \boldsymbol {\nabla } \boldsymbol {v}_{i,1} + \boldsymbol {\nabla } \boldsymbol {v}_{i,1}^{\rm T} )$ the perturbed reduced stress tensor at first order. The artificial parameter
 $\alpha _{NS}$ is introduced in the equation to study the contribution of the shear mode on the interfacial stability (see Appendix C). In all calculations shown below,
 $\alpha _{NS}=1$, with
 $\alpha _{NS}=0$ only in Appendix C to identify the influence of this term in the development of the instability.
2.4. Boundary conditions of the stability problem
This subsection describes the boundary conditions to be imposed in the perturbed problem. To facilitate the reading of this subsection, the algebra has been reduced to a minimum. The interested reader can find all mathematical details in the Appendix B.
As explained above, we perturb the position of the particle by introducing a small displacement  $\Delta \boldsymbol {x}_p$. The perturbed position of the particle
 $\boldsymbol {x}_p$ is unknown and will be obtained as part of the calculation process. Consequently, the boundary conditions (2.3), (2.4a) and (2.4b) cannot be imposed explicitly. To circumvent this difficulty, we followed the methodology developed by Rivero-Rodriguez, Perez-Saborid & Scheid (Reference Rivero-Rodriguez, Perez-Saborid and Scheid2018) to write these boundary conditions referred to the unperturbed particle's position
 $\boldsymbol {x}_{p,0}$. This process resulted in (B3), (B5) and (B6), respectively, as outlined in detail in Appendix B. Once this is done, we introduce the expansion (2.11) in (B3), (B5) and (B6) to give the boundary conditions at the surface of the particle to first order in
 $\epsilon$:
 \begin{gather} \int_{\varSigma_{p,0}} \,\left(\boldsymbol{n}_{0} \boldsymbol{\cdot} \hat{\boldsymbol{T}}_{2,1} + Re \,\delta_{p,1} \boldsymbol{v}_{2,0} \boldsymbol{\cdot} \boldsymbol{\nabla} \boldsymbol{v}_{2,0}\right)\, {\rm d}\varSigma =\boldsymbol{0} , \end{gather}
 \begin{gather}\int_{\varSigma_{p,0}} \boldsymbol{e}_z \boldsymbol{\cdot} \,\left\{\left(\boldsymbol{n}_{0} \boldsymbol{\cdot} \hat{\boldsymbol{T}}_{2,1} + \delta_{p,1}\,Re \,\boldsymbol{v}_{2,0} \boldsymbol{\cdot} \boldsymbol{\nabla} \boldsymbol{v}_{2,0}\right) \times (\boldsymbol{x}-\boldsymbol{x}_{p,0} ) - \boldsymbol{n}_{0} \boldsymbol{\cdot} \hat{\boldsymbol{T}}_{2,0} \times \boldsymbol{x}_{p,1}\,\right\} {\rm d}\varSigma =0 , \end{gather}
 \begin{gather}\boldsymbol{v}_{2,1} + \delta_{p,1} \boldsymbol{n}_0 \boldsymbol{\cdot} \boldsymbol{\nabla} \boldsymbol{v}_{2,0} = \boldsymbol{\varOmega}_1 \times (\boldsymbol{x} -\boldsymbol{x}_{p,0})+ \boldsymbol{\varOmega}_0 \times (\delta_{p,1} \boldsymbol{n}_0 - \boldsymbol{x}_{p,1}) +\alpha_\epsilon \lambda \boldsymbol{x}_{p,1} \quad \text{at} \ \varSigma_{p,0} . \end{gather}
The artificial parameter  $\alpha _{\epsilon }$ takes the value
 $\alpha _{\epsilon }=1$ in all cases except in Appendix C, when we evaluate the effect of the migration mode in the solution of the linearized system and we impose
 $\alpha _{\epsilon }=0$.
Next, the velocities at the upper and lower walls,  $y=1$ and
 $y=0$, are also expanded:
 \begin{equation} \boldsymbol{v}_{i,1} ={-} V_1 \boldsymbol{e}_x , \end{equation}
where  $i=1$ for the lower wall, and
 $i=2$ for the upper one. The perturbation in the particle's position in the horizontal direction is considered through a perturbation of the terminal velocity that keeps the inter-particle distance
 $L$ constant to conserve the periodic character of the problem. Periodic boundary conditions are expanded as well:
 \begin{equation} \left.\boldsymbol{v}_{i,1}\right|_{L/2} = \left.\boldsymbol{v}_{i,1}\right|_{{-}L/2} , \quad \left.\partial_x \boldsymbol{v}_{i,1}\right|_{L/2} = \left.\partial_x \boldsymbol{v}_{i,1}\right|_{{-}L/2} ,\quad \left.p_{i,1}\right|_{L/2}= \left.p_{i,1} \right|_{{-}L/2} . \end{equation}
Additionally, it is worth mentioning that the pressure drop  $\Delta p$ has not been expanded.
Following the same procedure as with the particle, the interface separating the fluids is perturbed by applying a normal differential displacement  $\delta \boldsymbol {n}_0$ that creates a volume as a result of the displacement of the interface from
 $\varGamma _0$ to its perturbed position
 $\varGamma (\boldsymbol {x},t)$, where the boundary conditions of the problem must be enforced. To do so, we write the boundary conditions referred to their unperturbed counterpart
 $\varGamma _0$, and we substitute the perturbation (2.11) in the resulting equations (B7), (B10) and (B11). Collecting terms of first order, the kinematic condition (2.9), the continuity of velocities (2.10a) and the stress balance (2.10b) can be written as
 \begin{gather} \boldsymbol{v}_{2,1} \boldsymbol{\cdot} \boldsymbol{n}_0 - {\boldsymbol{D}}_{S} \boldsymbol{\cdot} ( \delta_{1} \boldsymbol{v}_{2,0} ) = \alpha_\delta \lambda \delta_1 \quad \mbox{at}\ \varGamma_0 , \end{gather}
 \begin{gather}{}[\boldsymbol{v}]_1 + \delta_1 \boldsymbol{n}_0 \boldsymbol{\cdot} \boldsymbol{\nabla} [\boldsymbol{v}]_0= \boldsymbol{0} \quad \mbox{at}\ \varGamma_0 , \end{gather}
 \begin{gather}{}[\hat{\boldsymbol{T}}]_1 \boldsymbol{\cdot} \boldsymbol{n}_0 - {\boldsymbol{D}}_{S} \boldsymbol{\cdot} \left(\delta_1 [\hat{\boldsymbol{T}}]_0\right) + Re \,\delta_1 [\boldsymbol{v} \boldsymbol{\cdot} \boldsymbol{\nabla} \boldsymbol{v}]_0 = Ca^{{-}1}\,{\boldsymbol{D}}_{S} \boldsymbol{\cdot} \boldsymbol{\mathcal{B}}_1 \quad\mbox{at}\ \varGamma_0 , \end{gather}
where  ${\boldsymbol {D}}_{S} \boldsymbol {\cdot } \boldsymbol {b} = \boldsymbol {\nabla }_S \boldsymbol {\cdot } \boldsymbol {b} - (\boldsymbol {\nabla }_S \boldsymbol {\cdot } \boldsymbol {n} )\boldsymbol {n} \boldsymbol {\cdot } \boldsymbol {b}$ and
 $\boldsymbol {\nabla }_S \boldsymbol {b}=(\mathcal {I}-\boldsymbol {n}\boldsymbol {n})\boldsymbol {\cdot }\boldsymbol {\nabla } \boldsymbol {b}$ for any arbitrary vectorial or tensorial field
 $\boldsymbol {b}$. The tensor
 ${\boldsymbol {\mathcal {B}}_1}$ is the first term of the perturbation of the rotation tensor
 $\boldsymbol {\mathcal {B}}= \boldsymbol {n}_{S_0} \boldsymbol {n}_{S}$, with
 $\boldsymbol {n}_{S_0}$ and
 $\boldsymbol {n}_{S}$ the tangential vectors to the unperturbed
 $\varGamma _0$ and perturbed interface
 $\varGamma$. As particularized from the three-dimensional case given in Rivero-Rodriguez et al. (Reference Rivero-Rodriguez, Perez-Saborid and Scheid2018), the tangential vector reads
 $\boldsymbol {n}_{S}=\boldsymbol {n}_{S_0} + \boldsymbol {n}_{S_0} \boldsymbol {\cdot } (\boldsymbol {\nabla }_S \delta ) \boldsymbol {n}_{0}$, to give, after using the expansion (2.11b), the term of order
 $O(\epsilon )$ of the rotation tensor
 ${\boldsymbol {\mathcal {B}}_1 = (\boldsymbol {\nabla }_S\delta _1) \boldsymbol {n}_{0}}$ (Ruiz-Martín et al. Reference Ruiz-Martín, Rivero-Rodriguez and Sánchez-Sanz2022b). The contribution of the interfacial mode on the stability of the flow is evaluated by introducing the artificial parameter
 $\alpha _{\delta }$, which takes the value
 $\alpha _{\delta }=0$ only when we study the importance of this term in the stability of the interface (Appendix C).
2.5. Numerical method
Once the problem is formulated in non-dimensional form, and taking into account that the size of the particle is set constant and equal to  $d=0.2$, it is possible to identify the parametric dependence of the variables of the base-state problem
 $\psi _0$,
 $f$,
 $\Delta p$ with
 $\mu _1/\mu _2$,
 $Re$,
 $Ca$,
 $\eta$,
 $\xi$ and
 $L$.
The functional dependence will be obtained by integrating numerically the system of equations detailed above in (2.1)–(2.2). Table 1 provides the range of variation of the values of the non-dimensional parameters. After imposing the parameters of the problem, the flow variables  $\psi$ are calculated simultaneously using a Newton's iterative method that continues until the error is below
 $10^{-6}$ (see Ruiz-Martín et al. Reference Ruiz-Martín, Rivero-Rodriguez and Sánchez-Sanz2022b).
Relevant non-dimensional parameters.

Once the base flow has been computed, we can solve the linearized system of equations formed by (2.12) and (2.13) with the boundary conditions (2.14), (2.15), (2.16a–c) and (2.17), such that one obtains the eigenfunctions of the velocity  $\boldsymbol {v}_{i,1}$ and pressure fields
 $\hat {p}_{i,1}$, the correction for the terminal
 $V_1$ and rotational
 $\varOmega _1$ velocities, particle displacement
 $\boldsymbol {x}_{p,1}$ and interface displacements
 $\delta _1$ along with the eigenvalues
 $\lambda$.
The system of equations is solved using the finite element method implemented in Comsol Multiphysics. Linear Lagrangian elements have been used for pressure, and quadratic Lagrangian elements for the rest of the variables. The liquid–liquid interface at zeroth order has been solved with the help of the arbitrary Lagrangian Eulerian method also implemented in the software.
3. Migration, shear and interfacial modes
According to the classification introduced by Boomkamp & Miesen (Reference Boomkamp and Miesen1996), the unstable character of the flow studied here can be associated with three different mechanisms: the shear of the flow, the liquid–liquid interface and the particle migration. The nature of the different modes will be evaluated by examining the real and imaginary parts of the eigenvalues, and their dependency on the Reynolds and capillary numbers.
First, we discuss the migration mode. At low values of the Reynolds number  $Re \ll 1$, the eigenvalues corresponding to the particle migration
 $\lambda =\lambda |_{{mig}}$ are overdamped (
 $\lambda _{i}|_{{mig}}=0$). Consequently, any combination of parameters in which
 $\lambda _r>0$ would evolve towards a new fixed point following a short and non-oscillating transient. In particular, the transition from stable to unstable migration modes corresponds to the existence of pitchfork bifurcations in the particle position
 $\xi$ (Rivero-Rodriguez et al. Reference Rivero-Rodriguez, Perez-Saborid and Scheid2018; Ruiz-Martín et al. Reference Ruiz-Martín, Rivero-Rodriguez and Sánchez-Sanz2022b).
To check this point, we plot in figure 3 the evolution of the real part of the migration eigenvalue  $\lambda _r|_{{mig}}$ and the force acting on the particle in terms of the particle position
 $\xi$. This figure includes the critical particle positions
 $\xi _{c}$ (red filled circles), defined as the particle positions at which the real part of the eigenvalue vanishes, to compare them with the transition positions obtained previously in Ruiz-Martín et al. (Reference Ruiz-Martín, Rivero-Rodriguez and Sánchez-Sanz2022b) as
 $\partial _{\xi } f_0=0$ (blue filled squares). In all cases, the imaginary part of the eigenvalue was checked to be equal to zero.
Evolution of the migration eigenvalue  $\lambda _r|_{{mig}}$ (red dashed line) and the body force
 $f_{0}$ (blue dash-dotted line) with the particle position
 $\xi$ for (a)
 $\mu _{1}/\mu _{2}=10$,
 $\eta = 0.45$,
 $Ca^{-1} = 10^{4}$, and (b)
 $\mu _{1}/\mu _{2}=0.1$,
 $\eta = 0.15$,
 $Ca^{-1} = 100$. Circle markers indicate critical points (
 $\lambda _{r}=0$), and square markers correspond to transition points (
 $\partial _{\xi }f_0=0$). The Reynolds number is
 $Re=0.05$, and the inter-particle distance is
 $L=5$. Letters S and U denote the stable and unstable regions, respectively.

The shear mode instability, which belongs to the modes of Tollmien–Schlichting type, is dominated by inertia and hence appears only at sufficiently high Reynolds number (see e.g. Hooper & Boyd Reference Hooper and Boyd1987; Drazin & Reid Reference Drazin and Reid2004). For small Reynolds numbers, as those considered in this work, shear eigenmodes are then stable. Considering that  $Re \ll 1$, we can identify shear mode eigenvalues by considering that convective terms are negligible and shear mode eigenvalues
 $\lambda _r \sim Re^{-1}$ are necessary for the unsteady term to match the order of magnitude of volumetric force term (see (2.13)).
For the set of flow parameters considered here, the interfacial instability can be identified as those eigenvalues with positive real part and non-zero imaginary part. The aim of this work is precisely to analyse the interfacial mode instability under the influence of the migration of the train of particles.
The interaction of the different instability modes presented here is investigated in Appendix C by cancelling successively the artificial parameters  $\alpha$ introduced previously. We conclude that the migration mode, associated with equilibrium solutions, is uncoupled from the other instability mechanisms and can be studied separately, whereas the interfacial instability is found to be coupled to the migration of the particle.
4. Interfacial mode: results and discussion
The numerical results obtained for the interfacial mode are presented here. When inertial effects are taken into account, there exists an infinite number of modes, and consequently we need to obtain a sufficiently large number of eigenvalues to assess accurately the stable (S) or unstable (U) character of the interfacial mode. In particular, for each set of fluid parameters, we obtained a total of 45 different eigenvalues, some of which are spurious modes that can be filtered out by repeating the calculations twice with a different computational grid. Once this is done, the eigenvalue with zero imaginary part is identified as the migration mode, as we demonstrated above. Eigenvalues corresponding to the shear instabilities are of order  $\lambda _r \sim Re^{-1}$ and are identified easily when the Reynolds number is small (
 $Re=0.05$ in our calculations). Once these two modes are identified, and for the set of fluid parameters analysed here, we can consider the rest of the eigenvalues with non-zero imaginary part as those controlling the stability of the interface, therefore we focus on the eigenvalue with the largest real part.
As we specified in the formulation in § 2.3, the perturbation of all variables is considered periodic in the portion of channel of length  $L$ separating two different particles, so that the particle interaction induced by perturbations whose region of influence includes more than one particle is not considered. Also, the presence of the particle modifies the position of the interface, and for constant flow rates ratio
 $Q_{1}/Q_{2}$, the position of the interface
 $\eta$ for the problem with and without particles might differ. For this reason, and to facilitate the comparison of our computations with previous results, in this section we use
 $Q_{1}/Q_{2}$ instead of
 $\eta$ as the parameter controlling the height of each fluid layer.
4.1. Particle position effect
To examine the influence of the particle position on the stability of the interface, we show in figure 4 the neutral stability diagrams in the  $L\unicode{x2013}\xi$ parametric space for different viscosity and flow rate ratios. In this figure, vertical solid lines represent the value of
 $L$ beyond which the interface is unstable in the case with no particle. In particular, figure 4(b) shows that when the particle is immersed in the most viscous liquid (
 $\mu _{1}/\mu _{2}=0.10$), the presence of the particle has a clear destabilizing effect, narrowing the combination of parameters for which the interface is stable.
Neutral stability diagram in the  $\xi \unicode{x2013}L$ plane (dashed lines) and comparison with the particle-free value of
 $L$ beyond which the interface is unstable (vertical solid lines) for
 $Re = 0.05$,
 $Ca^{-1}=1$ for different
 $\eta$ values, or equivalently flow rate ratios (see table 2), with (a)
 $\mu _{1}/\mu _{2}=10$, (b)
 ${\mu _1/\mu _2=0.10}$. In (a), the dashed orange line corresponding to
 $\eta =0.10$,
 $Q_{1}/Q_{2} = 2.40 \times 10^{-3}$ is not depicted because it is always unstable. In (b), the solutions for
 $\eta =0.10$,
 $Q_{1}/Q_{2} = 5.50 \times 10^{-2}$ (solid orange line) and
 $\eta =0.25$,
 $Q_{1}/Q_{2} = 2.25 \times 10^{-1}$ (solid brown line) are always stable in the particle-free case.

Interestingly, this figure illustrates how the particle can stabilize the interface when  $\mu _1/\mu _2=10$. As shown in Yiantsios & Higgins (Reference Yiantsios and Higgins1988), the two-phase Poiseuille flow becomes unstable to long-wavelength perturbations when the thickness of the most viscous fluid is sufficiently low (thin layer effect). Remarkably, when the particle travels in the less viscous fluid (
 $\mu _{1}/\mu _{2}=10$), an increment of the volumetric flow rate shifted the unstable modes towards the cases in which the particle is close to either the interface
 $\xi < 0.2$ or the upper wall
 $\xi >0.6$ (see figure 4). In this case, intermediate values
 $0.2<\xi <0.6$ seem to be stable,
 $\lambda _r<0$, with the presence of the particle stabilizing the interface for
 $L>26$. For instance, the interface is stable for
 $Q_1/Q_2=1.68$ and
 $L>26$ (blue line in figure 4a) when the particle is located at
 $0.30<\xi <0.60$, with this region being unstable in the particle-free problem. It is worth mentioning that the interaction between the particles induced by interface perturbations with a region of influence higher than the inter-particle distance is not considered in this work, and the disturbance always fits within the inter-particle distance
 $L$. Hence as we increase
 $L$, new unstable modes that could not develop at smaller values might emerge.
Values of the flow rate ratio  $Q_{1}/Q_{2}$ for
 $\mu _{1}/\mu _{2}=10$ and
 $\mu _{1}/\mu _{2}=0.10$ for different values of
 $\eta$, corresponding to the lines plotted in figure 4.

4.2. Inertial and capillary effects
In this subsection, we investigate the influence of inertial and capillary effects in the two-dimensional problem. In the frame of the local stability analysis carried out by Yiantsios & Higgins (Reference Yiantsios and Higgins1988) at small or moderate Reynolds numbers, the imaginary wave speed  $c_i$ of the two-layer Poiseuille flow depends linearly on the Reynolds number. Using our global stability analysis, we illustrate in figure 5 the dependence on the Reynolds number of the most dangerous eigenvalue
 $\lambda _r|_{max}$ for the interfacial mode. (Note that the most dangerous interfacial eigenvalue is that with the largest real part
 $\lambda _r|_{max}$ and
 $\lambda _i \ne 0$.) For the flow parameters considered here,
 $\lambda _r|_{max}$ is independent of the particle position
 $\xi$, and essentially follows the trend defined by the interface in the absence of the particle. For sufficiently low values of the Reynolds number, capillary effects become dominant and the particle changes the stability of the flow. Indeed, for
 $Re=0.05$ and the flow parameters considered in figure 5, the flow is stable only when the particle is sufficiently far from the interface
 $\xi >0.50$.
Most dangerous eigenvalue as a function of the Reynolds number for  $Ca^{-1}=1$, with dotted black line representing the level
 $\lambda _{r}|_{max}=0$. The inset in (b) shows the solution in the zoomed region
 $Re<1$. The red line represents the particle-free configuration solution, the violet line is for the particle located at
 $\xi =0.90$, the green line is for
 $\xi =0.50$, and the blue line is for
 $\xi =0.10$. Flow parameters are
 $\mu _{1}/\mu _{2}=0.1$,
 $L=20$ and (a)
 $\eta =0.07$,
 $Q_{1}/Q_{2}=3.31 \times 10^{-2}$, (b)
 $\eta =0.40$,
 $Q_{1}/Q_{2}=0.59$.

In figure 6, we show the evolution of the absolute real part of the most dangerous eigenvalue with the inverse of the capillary number for these flow parameters. Figure 6 illustrates that the presence of the particle becomes more noticeable in the limit of small surface tension, whilst as  $Ca^{-1} \gg 1$, the evolution of
 $\lambda _r|_{max}$ is independent of the particle position, and identical to the result obtained with the particle-free configuration. This is consistent with the fact that at high values of the surface tension, the interface deformation due to the presence of the particle becomes negligible, and consequently the influence of the particle on the interfacial mode decreases. The size of the perturbations is limited by the inter-particle distance, so that beyond a certain value of the surface tension, the eigenvalue is seen to increase linearly with
 $Ca^{-1}$. In figure 6(a), the greatest eigenvalue
 $\lambda _r|_{max}$ computed for small values of the volumetric flow ratio is negative for all values of
 $Ca^{-1}$ when the particle is far from the interface. For
 $\xi <0.6$, approximately,
 $\lambda _{r}|_{max}$ becomes positive at low surface tension, with small stability regions that emerged for intermediate values of
 $Ca^{-1}$ before
 $\lambda _{r}|_{max}$ finally achieves a positive constant value that is independent of the surface tension. As the flow ratio
 $Q_1/Q_2$ increases, the unstable behaviour of the interface emerges approximately at the same capillary number for all values of
 $\xi$, as illustrated in figure 6(b). This figure shows the variations on the evolution of the growth rate in the limit of small surface tension
 $Ca^{-1}$ due only to a change in the frequency of the wave.
Absolute real part of the most dangerous eigenvalue as a function of the inverse of the capillary number for  $Re=0.05$ and the same flow parameters as considered in figure 5. Solid lines for stable (negative) eigenvalues and dashed lines for unstable (positive) values.

To study this in more detail, we represent in figure 7 the evolution of the most dangerous eigenvalue  $\lambda _r|_{max}$ for the interfacial mode using
 $L=22$ and
 $Q_1/Q_2=2.05$. In this figure, we consider both the global stability solution as well as the results obtained for perturbations of wavenumber
 $k_L=2{\rm \pi} /L$. Note that the swift variations close to
 $Ca^{-1} = 10^{-3}$ and
 $Ca^{-1} =10^{-1}$ for the particle-free configuration are related to a change in the wavenumber of the perturbation with the maximum growth rate. In essence, the wavenumber of the most dangerous perturbation increases as
 $Ca^{-1} \to 0$, as the stabilizing effect of surface tension decreases at small values of the wavenumber. On the other hand, in the limit
 $Ca^{-1} \to \infty$, the wavelength is limited by the inter-particle length
 $L$, and beyond a certain value, the most dangerous eigenvalue is seen to depend linearly on
 $Ca^{-1}$.
Most dangerous eigenvalue as a function of the inverse of the capillary number. (a) The result obtained in the particle-free configuration is compared with the solution for perturbations of wavenumber  $k = 2 {\rm \pi}n / L = n k_{L}$. (b) The evolution of the most dangerous eigenvalue in the two-dimensional problem for different particle positions is compared with the particle-free global stability analysis (red line). Solid lines for stable (negative) eigenvalues and dashed lines for unstable (positive) values. Flow parameters are
 ${Re=0.05}$,
 ${\mu _1/\mu _2=0.1}$,
 $\eta =0.60$,
 $Q_{1}/Q_{2}=2.04$,
 $L=22$.

Neutral stability diagrams for  $\mu _1/\mu _2=0.10$ and different particle positions (
 $\xi =0.10$,
 $0.50$,
 ${0.90}$) are shown in figure 8 for
 $Re=0.05$ (figure 8(a) and solid lines in figure 8(b)) and for
 $Re=5$ (dashed lines in figure 8b). Figure 8 illustrates that at lower values of the Reynolds number, capillary migration becomes dominant and the interface deformation induced by the particle more significant. Consequently, the particle position has a higher impact on the stability of the flow, whereas for dominant inertial effects, the neutral lines collapse in the
 $\eta$–
 $L$ plane for the different particle positions. In addition, the unstable region for higher values of the Reynolds number widens towards lower values of the flow rate ratio and inter-particle distance (lower values of the perturbation wavelength). On the other hand, comparing the neutral stability diagram presented in figure 8(a) and that obtained for
 $Re=0.05$ and
 $Ca^{-1}=1$ with the results plotted in figure 8(b) with solid lines – which have also been obtained for
 $Re=0.05$ but for a higher surface tension
 $Ca^{-1}=10$ – we can see the stabilizing effect of the surface tension for lower values of the inter-particle distance. This is in agreement with the results obtained for the stability of the two-phase Poiseuille flow (Yiantsios & Higgins Reference Yiantsios and Higgins1988).
Neutral stability diagram in the  $Q_{1}/Q_{2}\unicode{x2013}L$ plane for
 $\mu _{1}/\mu _{2}=0.10$ and (a)
 $Ca^{-1}=1$,
 $Re=0.05$, and (b)
 $Ca^{-1}=10$,
 $Re=0.05$ for solid lines and
 $Re=5$ for dashed lines. The particle position is
 $\xi =0.10$ for the blue line,
 $\xi =0.50$ for the green line, and
 $\xi =0.90$ for the violet line. The red line corresponds to the particle-free configuration.

If the particle is immersed in the most viscous fluid ( $\mu _{1}/\mu _{2}\leq 1$), then the liquid–liquid interface becomes unstable at low values of the flow rate ratio when the particle is sufficiently close to the interface, independently of the inter-particle distance. Also, particle positions closer to the interface widen the unstable region towards lower values of the particle distance
 $L$. As mentioned before, the increase of the surface tension stabilizes the flow for relatively low values of
 $L$. Remarkably, the presence of the particle is stabilizing when the particle is in the less viscous fluid (
 $\mu _{1}/\mu _{2}=10$) in a narrow region at relatively high flow rate ratios (
 $Q_{1}/Q_{2} \sim 1$), regardless of the inter-particle distance considered (see figure 9). This stabilizing effect is more pronounced when the particle is far from the interface and appears only at low values of
 $Ca$ or large values of
 $Re$, as shown in figure 10.
Neutral stability diagram in the  $Q_{1}/Q_{2}\unicode{x2013}L$ plane for different values of the particle position,
 $Re = 0.05$,
 $\mu _{1}/\mu _{2}=10$ and
 $Ca^{-1}=1$. The particle position is (a)
 $\xi =0.50$ and (b)
 $\xi =0.90$. Red lines correspond to the particle-free configuration. In (b), the shaded region represents the parameter range for which we were unable to compute a solution. The particular case highlighted by the star marker (
 $\bigstar$) in the figures is analysed in detail in figure 14.

Neutral stability diagram in the  $Q_{1}/Q_{2}$–
 $L$ plane for
 $\mu _{1}/\mu _{2}=10$,
 $Ca^{-1}=10$ and (a,c,e)
 $Re=0.05$, (b,d,f)
 $Re=5$. Plots in each row are dedicated to a different particle position
 $\xi$. Red lines correspond to the particle-free configuration. Letters S and U denote the stable and unstable regions, respectively.

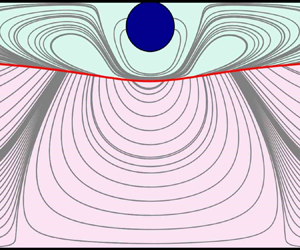
To understand further the effect of the particle on the interfacial instability, the eigenfunctions for the most unstable interfacial mode are plotted in figures 11 and 12, considering two sets of parameters. With the first set, the particle stabilizes the interface, whilst with the second set, the particle destabilizes the interface, which is stable in the particle-free problem. Due to the slenderness of the computational domain, the vertical axis has been stretched in figures 11 and 12 to facilitate the reading of the figures. The ellipsoidal geometry of the particle is only a visual consequence of that change of scale.
Contour plots of the perturbed streamlines (light grey lines). The positions of the unperturbed and perturbed interfaces are depicted with solid and dashed lines, respectively, for (a) a particle located at  $\xi =0.90$ with
 $\lambda = -3.4486 \times 10^{-5}+0.19373{\rm i}$, and (b) the particle-free configuration with
 $\lambda = 4.4319 \times 10^{-6} +0.38565{\rm i}$. The rest of the flow parameters are
 $Re=0.05$,
 $\mu _{1}/\mu _{2}=10$,
 $\eta =0.69$ (
 $Q_{1}/Q_{2}=0.629$),
 $L=30$,
 $Ca^{-1}=1$.

Contour plots of the perturbed streamlines (light grey lines). The position of the unperturbed and perturbed interfaces are depicted with solid and dashed lines, respectively, for (a) a particle located at  $\xi =0.90$ with
 $\lambda = 5.0833 \times 10^{-5}+0.20982{\rm i}$, and (b) the particle-free configuration with
 $\lambda = -1.6913 \times 10^{-6}+0.3139{\rm i}$. The rest of the flow parameters are
 $Re=0.05$,
 $\mu _{1}/\mu _{2}=10$,
 $\eta =0.95$ (
 $Q_{1}/Q_{2} = 3.17$),
 $L=30$,
 $Ca^{-1}=1$.

From figure 9, we identified a set of parameters in which the particle stabilizes the interface –  $Re=0.05$,
 $\mu _{1}/\mu _{2}=10$,
 $\eta =0.69$ (
 $Q_{1}/Q_{2} = 0.629$),
 $\xi =0.90$,
 $L=30$,
 $Ca^{-1}=1$ – before plotting the real part of the eigenfunctions in figure 11. To facilitate the comparison, we included in figure 11(b) the eigenfunction in the case without particles.
On the other hand, figure 12 includes the eigenfunctions of the most unstable mode for the same flow parameters considered previously, but with the interface closer to the upper wall:  $Re=0.05$,
 $\mu _{1}/\mu _{2}=10$,
 $\eta =0.95$ (
 $Q_{1}/Q_{2}=3.17$),
 $\xi =0.90$,
 $L=30$,
 $Ca^{-1}=1$. In this case, the particle induces the formation of a recirculating region near the particle that extends to affect the lower fluid, destabilizing the interface. The eigenfunction of the particle-free configuration is included in figure 12(b), illustrating the effect of the particle on the flow pattern. A more detailed plot of the region surrounding the particle is included in figure 13, comparing the cases
 $\eta =0.65$ and
 $0.95$. In this figure, we can identify the recirculating regions formed near the particle surface and at the lower and more viscous liquid.
Contour plots of the perturbed streamlines in the fluid near the particle for (a,c)  $\eta =0.65$ (
 $Q_{1}/Q_{2} = 0.629$) with
 $\lambda = -3.4486 \times 10^{-5}+0.19373{\rm i}$, and (b,d)
 $\eta =0.95$ (
 $Q_{1}/Q_{2} = 3.17$) with
 $\lambda = 5.0833 \times 10^{-5}+0.20982{\rm i}$. The real part of the velocity field is at the top, and the imaginary part is at the bottom. The unperturbed interface position
 $\varGamma _0$ is shown as a solid red line.The rest of the flow parameters are
 $Re=0.05$,
 $\mu _{1}/\mu _{2}=10$,
 $\xi =0.90$,
 $L=30$,
 $Ca^{-1}=1$.

The analysis of the eigenfunctions suggests that these regions of flow recirculation in the lower liquid play a key role in destabilizing the interface. In multi-layer flows without particles, it has been suggested that the interfacial instability can be explained by the out-of-phase vorticity disturbances that appear as a result of the vorticity advection by the base flow (see Hinch Reference Hinch1984; Charru & Hinch Reference Charru and Hinch2000; Govindarajan & Sahu Reference Govindarajan and Sahu2014). For the destabilizing case discussed above ( $Re=0.05$,
 $\mu _{1}/\mu _{2}=10$,
 $\eta =0.95$,
 $Q_{1}/Q_{2} = 3.17$,
 $\xi =0.90$,
 $L=30$,
 $Ca^{-1}=1$), the particle-free configuration is stable because the surface tension stabilizes short-wavelength interfacial disturbances. Also, long-wavelength disturbances remain stable (Charru & Hinch Reference Charru and Hinch2000) as the downstream convection of vorticity remains relevant only in the thicker, more viscous lower liquid layer. Interestingly, figure 12 suggests that the assumption of negligible advected vorticity is no longer valid in the thinner, less viscous liquid layer in the presence of particles. This figure shows a particle-induced vertical flow motion that extends to the lower and more viscous liquid. This effect is not observed in figure 11, when the particle stabilized the interface. An in-depth analysis of the physical mechanisms that trigger the instability is of unquestionable interest. However, that study is out of the scope of this work.
As the surface tension of the interface is reduced (lower values of  $Ca^{-1}$), the maximum deformation of the interface becomes larger, achieving deformation amplitudes
 ${g = \varGamma (x)-\varGamma _{L/2}}$ of the order of the size of the particle. An example of that effect is shown in figure 14 for
 $Re=0.05$,
 $\mu _{1}/\mu _{2}=10$,
 $Q_{1}/Q_{2} = 0.35$ (
 $\eta = 0.60$),
 $\xi =0.90$,
 $L = 14$ and
 $Ca^{-1} = 1$. Keeping the other parameters unchanged, the range
 $L\in [5,40]$ gives a very small radius of curvature of the interface, which is what hinders the numerical calculation of the problem. This region is identified in figure 9(b) by using shading. This problem becomes especially acute when the particle is immersed in the less viscous fluid and the interface becomes unstable to long-wavelength perturbations (Yih Reference Yih1967). An example of this behaviour is included in figure 14(a), where we plot the deformation of the interface
 $g$ for different values of the surface tension
 $Ca^{-1}$, with
 $\varGamma _{L/2}=\varGamma (L/2)$. As shown in this figure, the maximum value of
 $g$ increases, creating a sharp gradient near the particle that sharpens further as
 $Ca^{-1}$ is reduced. In figure 14(b), we plot the evolution of the maximum value of the normal vector in the axial direction
 $n_{x}$ at the interface
 $\varGamma$. As the surface tension lowers,
 $n_{x}$ increases to become
 $n_x \simeq |\boldsymbol {n}|$ for sufficiently small values of the surface tension. This causes the interface deformation gradient
 ${\rm d}g/{\rm d}\kern0.7pt x$ to become infinite, anticipating the multi-evaluation of the function
 $g$ at a range of values of
 $x$. This behaviour is illustrated in the inset of figure 14(a). The information depicted in this figure suggests, therefore, that the breakdown of the code at
 $Ca^{-1}=1$, identified in figure 9(b) with a black star, is associated with wave steepening of the interface that would need specific numerical techniques in order to be described.
(a) Interface deformation  $g/d$ for different values of the inverse of the capillary number
 $Ca^{-1}$. (b) Evolution with the inverse of the capillary number of the maximum value of the normal vector at the interface
 $\varGamma$ in the axial direction
 $n_{x}$. The rest of the parameters are
 $Re = 0.05$,
 $\mu _{1}/\mu _{2}=10$,
 $Q_{1}/Q_{2}=0.35$ (
 $\eta =0.60$),
 $\xi =0.90$,
 $L=14$.

The wave steeping of the interface illustrated in figure 14 suggests what could be expected beyond the linear regime considered in the present work. In this regard, Boeck et al. (Reference Boeck, Li, López-Pagés, Yecko and Zaleski2007) showed that for a two-layer channel flow without the train of particles, the nonlinear temporal instability associated with the interfacial mode usually results in the formation of ligaments. Valluri et al. (Reference Valluri, Naraigh, Ding and Spelt2010) described the nonlinear spatio-temporal instability in two-layer Poiseuille flow, also illustrating the formation of ligaments. The nonlinear interaction of these ligaments with the particle might trigger an unexpected behaviour that is difficult to anticipate. That question opens the door to new research that is, undoubtedly, of great interest for future study. All the same, different numerical studies in viscosity-stratified flows have concluded that the linear global analysis can anticipate the initial nonlinear performance (see e.g. Tammisola et al. Reference Tammisola, Lundell, Schlatter, Wehrfritz and Söderberg2011; Govindarajan & Sahu Reference Govindarajan and Sahu2014), with a final saturated state that, even if different, is closely related to the linear origin.
5. Conclusions
This work considers the effect of a train of particles on the stability of the interface formed by two immiscible liquids from a numerical point of view. To do this, we have adapted the use of the method developed by Rivero-Rodriguez & Scheid (Reference Rivero-Rodriguez and Scheid2018), used therein for expansion of the variables in  $Re$ and
 $Ca$, to a stability analysis approach that we have also validated against full transient simulations.
During our analysis, we have identified shear, migration and interfacial modes as the three instability mechanisms. For the small values of the Reynolds number considered in this work, the eigenvalues associated with the shear mode have large negative real part  $\lambda _{r} \sim Re^{-1}$. The eigenvalues of the migration mode, described extensively in Ruiz-Martín et al. (Reference Ruiz-Martín, Rivero-Rodriguez and Sánchez-Sanz2022b), have zero imaginary part and are uncoupled from the other instability modes. On the contrary, the interfacial mode is clearly affected by the migration of the particle. In general, our numerical results show that the presence of the solid particles have a destabilizing effect.
When the particle is in the more viscous fluid ( $\mu _1/\mu _2<1$), the existence of migrating particles always promotes the unstable character of the liquid–liquid interface. On the contrary, when the particle is in the less viscous fluid (
 $\mu _1/\mu _2>1$), we find a range of parameters for which the presence of the particle stabilizes the interface, independently of the inter-particle distance and especially when the particle is close to the upper wall.
The results obtained demonstrate that the position of the particle plays a crucial role in determining the stability of the interface, and becomes more significant as  $Ca$ increases or
 $Re$ decreases.
The stability of the flow is linked closely to the deformation of the interface caused by the vertical force exerted by the particle and by the out-of-phase vorticity disturbances that appear as a result of the vorticity advection by the base flow (see e.g. Hinch Reference Hinch1984; Charru & Hinch Reference Charru and Hinch2000; Govindarajan & Sahu Reference Govindarajan and Sahu2014). Vorticity disturbances are created on both sides of the interface and advected downstream, creating vortex pairs that are out of phase with the interface deformation (Charru & Hinch Reference Charru and Hinch2000).
Declaration of interests
The authors report no conflict of interest.
Appendix A. Code verification
To verify our numerical code, we compare the solution obtained by integrating the above-described system of equations in the absence of particle with the asymptotic solution obtained by Yiantsios & Higgins (Reference Yiantsios and Higgins1988) in the limit of long-wavelength perturbations. Additionally, our results are compared with the Chebyshev tau method developed by Blyth & Pozrikidis (Reference Blyth and Pozrikidis2004) for different values of the thickness ratio in figure 15. To facilitate the comparison, we adopt the notation used in their local stability analysis, in which the perturbed variable is written as  $\psi _1(\boldsymbol {x})=\phi (y) \exp [{\rm i}k(x-ct)]$, where
 $k$ is a prescribed real wavenumber, and
 $c$ is the complex wave speed. Thus for a particular computational domain of length
 $L$, the wavenumber of the fundamental mode (wavelength equal to
 $L$) is defined as
 $k=2{\rm \pi} /L$, whereas the wave speed is
 $c={\rm i} \lambda /k$. In addition, neutral stability diagrams in the
 $r_{1}/r_{2}\unicode{x2013}k$ plane, with
 $r_{1}/r_{2}=\varGamma /(1-\varGamma )$, are shown for
 $\mu _{1}/\mu _{2}=10$ and
 $\mu _{1}/\mu _{2}=0.1$ in figure 16.
Comparison of the solution in the absence of particles for  $Re=0.5$,
 $k=0.1$ and (a)
 $Ca^{-1}=0$, (b)
 $Ca^{-1}=1$. The parameter
 $r_{1}/r_{2}$ represents the liquid thickness ratio.

Neutral stability diagrams in the  $r_{1}/r_{2}\unicode{x2013}k$ plane for different values of the capillary number
 $Ca$,
 $Re=0.5$, and (a)
 $\mu _{1}/\mu _{2} = 10$, (b)
 $\mu _{1}/\mu _{2} = 0.1$. Solid black lines show the results obtained with the Chebyshev method, and dashed blue lines show our global stability analysis.

The verification of the linearized equilibrium of forces, torque balance and no-slip boundary conditions at the particle surface (2.14) has been carried out by analysing the time-dependent migration of the particle. We have considered first that the particle is immersed in a single-layer channel flow. The initial position of the particle is  $y_{p}(t_0)$, and we impose a body force
 $\boldsymbol {f}_{{imp}}$ different to the value necessary to maintain the particle at the initial position
 $y_{p}(t_0)$. During a short time
 $t_{c}\sim 10^{-4}$, we introduce a perturbation in the form
 $Q=\int _{0}^{1} u \,{{\rm d}y} = 1 - {\rm e}^{-t/t_c}$, so that the particle moves away from its initial location
 $y_{p}(t_0)$.
If the combination of parameters chosen in the calculations falls inside a stable region, then a steady solution is reached at sufficiently long times  $t_1 \gg t_c$, with the particle landing at
 $y_{p}(t_1)$, where the condition
 \begin{equation} \int_{\varSigma_p} \boldsymbol{\hat{T}} \boldsymbol{\cdot} \boldsymbol{n}_{p} \,\mathrm{d}\varSigma = \boldsymbol{f}_{{imp}} \mathcal{V}_{p} \end{equation}
is satisfied. The evolution with time of the particle position follows an exponential law  ${y_{p}(t) - y_{p}(t_1) = \hat {A}\,{\rm e}^{\varLambda t}}$, with the exponent
 $\varLambda$ obtained using numerical fitting, equal to the eigenvalue associated with the final steady solution (the perturbed base-state flow with the particle located at
 $y_{p}(t_1)$).
The comparison of the exponent  $\varLambda$ with the eigenvalue
 $\lambda$ obtained by integrating the linearized problem formulated in § 2.3 is given in table 3 for different Reynolds numbers and particle equilibrium positions
 $y_{p}(t_1)$. As shown in table 3, the eigenvalues given by the linearized problem formulated above are in excellent agreement with the results obtained with the transient computation, with relative errors with respect to the transient solution approximately 0.17 %.
Comparison of the eigenvalues obtained with the transient code and the linearized system of equations for a particle immersed in a single-layer channel flow with  $L=2$.

The full system of equations, with the particle embedded in a two-layer channel flow, was validated in Ruiz-Martín (Reference Ruiz-Martín2022) using the same technique as above. In particular, the equilibrium of forces on the particle surface in the vertical direction is perturbed during a short period of time in the form  $(\int _{\varSigma _{p}} \boldsymbol {n}_{p} \boldsymbol {\cdot } \hat {\boldsymbol {T}}_2 \,\mathrm {d}\varSigma ) \boldsymbol {\cdot } \boldsymbol {e}_{y} = f \mathcal {V}_{p}+ \mathcal {A}\,{\rm e}^{-t/t_{c}}$, with
 $\mathcal {A}$ an arbitrary amplitude such that the particle position
 $\xi$ is changed by a distance of order
 $O(10^{-3})$. If the steady-state solution is stable, then the perturbation fades away and the solution evolves to recover the initial condition. The different modes – shear, migration and interfacial – are coupled but get damped progressively so that at long times, the most dangerous eigenvalue dominates and the fluid variables evolve with time following an exponential law. The different fluid variables
 $\psi$ can then be expressed as
 ${\psi _{p}(t) = \psi _{p}(0) + \mathcal {C}\,{\rm e}^{\varLambda t}}$, where
 $\mathcal {C}$ and
 $\varLambda$ are obtained from the transient simulations. For a perturbed stable solution
 $\mu _{1}/\mu _{2} = 0.10$,
 $\eta =0.15$,
 $\xi =0.50$,
 $L=5$,
 $Ca^{-1}=100$, the temporal evolution of the particle position provides
 $\varLambda \simeq -1.2 \times 10^{-3}$, a value that agrees with the result obtained for the migration mode in figure 3(b). On the contrary, for the perturbed unstable solution
 ${\mu _1/\mu _2 = 10}$,
 ${\eta =0.75}$,
 ${\xi =0.50}$,
 ${L= 40}$,
 ${Ca^{-1}=1}$, an exponential growth is observed, in agreement with an unstable solution with eigenvalue
 $\varLambda >0$, in which case the solution moves away from the base-state flow. This method to verify the fully coupled equations has been extended further here to a wider range of flow parameters (see table 4). Up to six distinct cases have been studied, for both the small and large viscosity ratio considered here, with different values of the surface tension, interface and particle positions for each sample.
Comparison of the migration eigenvalues obtained with the transient problem and the linearized system of equations for a particle immersed in a two-layer channel flow with  $\mu _{1}/\mu _{2}=0.10$ and
 $Re=0.05$. The flow parameters of the first case study (first row) are the same as in figure 3. For the rest of the case studies, the neutral diagram is shown in figure 8.

To verify our calculations further, we have considered a different strategy to emphasize the coupling of the particle and interface equations. To do so, we perturbed the liquid–liquid interface, introducing a random noise to calculate the temporal evolution of the particle migration using (2.1)–(2.2). Both the growth rate and temporal frequency are compared with the most dangerous eigenvalue for the interfacial mode computed using our linearized system of equations. As we will show below, the agreement between the calculations is excellent. The form of the random perturbation of the interface is similar to that used by Valluri et al. (Reference Valluri, Naraigh, Ding and Spelt2010). Specifically, during a short period of time of  $O(t_c)$, we introduce a small-amplitude sinusoidal perturbation at the interface of the form
 $A(x,t)\,\mathrm {e}^{-t/tc}$ that vanishes for large values of
 $t$, with
 $A(x,t)$ being a random-phase perturbation defined as
 \begin{align} A(x,t)&=\left(
\int_0^\infty \left| \hat{A}(w_f) \right| \exp({{\rm
i}[\omega_ft +\theta(\omega_f)]})\, \mathrm{d}\omega_f
\right)\nonumber\\ &\quad\times \left( \int_0^\infty \left| \hat{A}(\bar{w}_f)
\right| \exp({{\rm i}[\bar{\omega}_fx
+\bar{\theta}(\bar{\omega}_f)]}) \,
\mathrm{d}\bar{\omega}_f \right) \nonumber\\ &\simeq A_0
\left( \dfrac{1}{N_f} \sum_{j=0}^{N_f} \exp({{\rm i} (j
\omega_{{max}} t/N_f+\theta_j)}) \right) \left(
\dfrac{1}{\bar{N}_f} \sum_{j=0}^{\bar{N}_f} \exp({{\rm i}
(j \bar{\omega}_{{max}} x/\bar{N}_f+\bar{\theta}_j)})
\right),
\end{align}
with  $A_{0}$ such that the amplitude of the perturbation is
 $O(10^{-3})$,
 $N_f=\bar {N}_f=1000$, and the phases
 $0<\theta _j$,
 $\bar {\theta }_j<2{\rm \pi}$ are generated randomly. The cut-off frequencies
 $\omega _{max}$,
 $\bar {\omega }_{max}$ are taken sufficiently large to consider a wide range of frequency spectrum. As typical values we chose
 $\omega _{max}=3$,
 $\bar {\omega }_{max}=3.6$, whereas
 $t_c=3.5$.
After perturbing the interface as defined in (A2), we advanced the solution in time to monitor the behaviour of the interface. We chose two different sets of parameters in which the interfacial mode is stable (parameters given in the caption of table 5). Using them, our unsteady evolution calculations confirmed that the perturbed interface evolved to return to its original unperturbed shape in times  $t \sim \lambda _{r}^{-1}$, with
 $\lambda _{r}$ the real part of the most dangerous mode. The time evolution of the particle position relative to its final equilibrium position
 $y_{p}^{*}$ is shown in figure 17 for this combination of parameters. Remembering that the perturbation of the variables follows the form
 ${\psi (\boldsymbol {x},t)= \psi _0 (\boldsymbol {x}) + \exp ({(\lambda _r + {\rm i} \lambda _i)t})\,\psi _1(\boldsymbol {x})}$, we fit the unsteady evolution of the particle to a damped sinusoidal curve
 ${{y}_p - y_{p}^{*}= g_1\,{\rm e}^{g_2 t} \sin ( g_3 t + g_4)+ g_5}$, with
 $g_i$ the vector of parameters determined using the least squares method. The values of the fitting parameters
 $g_i$ are summarized in table 5 for the two cases considered. For the first set of parameters (case 4), the fitted curve is plotted in figure 17(a) with
 $g_2=-0.0099$ and
 $g_3=0.04840$ for a sum of square residuals below
 $5\times 10^{-5}$. The agreement with the most dangerous eigenvalue calculated with the stability analysis for the interfacial mode
 $\lambda _r=-0.009366$ and
 $\lambda _i=\pm 0.04846$ is excellent. For case 5, the fitted curve is plotted in figure 17(b), and we obtained
 $g_2=-0.003480$ and
 $g_3 =0.3093$ versus the values
 $\lambda _{r}=-0.00354$ and
 $\lambda _{i}= 0.3093$ computed using the stability analysis.
Fitting parameters for a damped sinusoidal curve of the form  ${y}_p = g_1\,{\rm e}^{g_2 t} \sin (g_3 t + g_4) +g_5$ for
 $Re=0.05$,
 $\xi =0.50$,
 $L=5$,
 $Ca^{-1}=1$, with
 $\mu _1/\mu _2=0.1$ and
 $\eta =0.21$ (case 4) and
 $\mu _1/\mu _2=10$ and
 $\eta =0.63$ (case 5).

Evolution of the particle position  $y_{p}$ with time relative to its final equilibrium position
 $y_{p}^{*}$ for a randomly perturbed interface. The red line shows the numerical solution, and the blue line shows the fitted curve
 ${{y}_p = g_1\,{\rm e}^{g_2 t} \sin (g_3 t + g_4) +g_5}$ for (a) case 4 and (b) case 5 of table 5. The fitting parameters
 $g_i$ are included in table 5.

Appendix B. Boundary conditions at perturbed geometries
In this appendix, we provide details about the perturbation of the boundary conditions at deformable boundaries, namely at the particle surface and the interface between the two liquids, around the unperturbed geometry. To do so, we will make use of two versions of the divergence theorem given in Weatherburn (Reference Weatherburn1927) for three-dimensional geometries, which we rewrite for two-dimensional geometries for any vectorial or tensorial field  $\boldsymbol {b}$ as
 \begin{gather} \int_{S} \boldsymbol{\nabla} \boldsymbol{\cdot} \boldsymbol{b} \,\mathrm{d} S = \int_{\partial S} \boldsymbol{n} \boldsymbol{\cdot} \boldsymbol{b} \,\mathrm{d} l , \end{gather}
 \begin{gather}\int_L {\boldsymbol{D}}_{S} \boldsymbol{\cdot} \boldsymbol{b} \,\mathrm{d} L = \int_{\partial l} \boldsymbol{n}_S \boldsymbol{\cdot} \boldsymbol{b} \,\mathrm{d} (\partial l) , \end{gather}
where  $S$,
 $l$,
 $\boldsymbol {n}$ and
 $\boldsymbol {n}_S$ are a generic surface, a generic curve, the outer normal vector to the contour of the surface
 $\partial S$, and the outer normal vector to the contour of the curve
 $\partial L$, which is perpendicular to
 $\boldsymbol {n}$, i.e. tangent to the curve
 $l$. Equation (B1b) has been written in a shorter form using the operator
 ${\boldsymbol {D}}_{S} \boldsymbol {\cdot } \boldsymbol {b} = \boldsymbol {\nabla }_S \boldsymbol {\cdot } \boldsymbol {b} - (\boldsymbol {\nabla }_S \boldsymbol {\cdot } \boldsymbol {n} ) \boldsymbol {n} \boldsymbol {\cdot } \boldsymbol {b}$.
B.1. Boundary conditions of a solid body at the perturbed particle surface
To satisfy the boundary conditions, the integral on the surface of the particle  $\varSigma _p$, given in (2.3), needs to be transformed into one that is evaluated on the unperturbed surface of the particle
 $\varSigma _{p,0}$. To do this, we integrate the momentum equation (2.2) on the volume
 $\mathcal {V}_{p,1}$ enclosed between the perturbed and unperturbed surfaces,
 $\varSigma _p$ and
 $\varSigma _{p,0}$, as indicated in figure 18. After applying the divergence theorem (B1a) and rearranging terms, we have
 \begin{equation} \int_{\varSigma_{p,0}} \left\{ \boldsymbol{n}_{0} \boldsymbol{\cdot} \hat{\boldsymbol{T}}_2 + Re \,\delta_p \left({\frac{\partial \boldsymbol{v}_{2}}{\partial t}} + \boldsymbol{v}_2 \boldsymbol{\cdot} \boldsymbol{\nabla} \boldsymbol{v}_{2}\right) \right\} {\rm d}\varSigma = \int_{\varSigma_{p}} \boldsymbol{n} \boldsymbol{\cdot} \hat{\boldsymbol{T}}_2 \,\mathrm{d}\varSigma , \end{equation}
where  $\delta _p=\Delta \boldsymbol {x}_p \boldsymbol {\cdot } \boldsymbol {n}_0$ is the displacement of the particle in the direction normal to the unperturbed surface of the particle
 $\varSigma _{p,0}$ (see figure 18). It has been taken into account that for a small displacement
 $\delta _p$, a differential of the referred enclosed volume can be written as
 ${\rm d} \mathcal {V}_p = \delta _p \,\mathrm {d} \varSigma$ on
 $\varSigma _{p,0}$. Hence, using (B2), (2.3) can be written as
 \begin{equation} \int_{\varSigma_{p,0}} \left\{ \boldsymbol{n}_{0} \boldsymbol{\cdot} \hat{\boldsymbol{T}}_2 + Re \,\delta_p \left({\frac{\partial \boldsymbol{v}_{2}}{\partial t}} + \boldsymbol{v}_2 \boldsymbol{\cdot} \boldsymbol{\nabla} \boldsymbol{v}_{2}\right) \right\} {\rm d}\varSigma +\mathcal{V}_p \boldsymbol{f} = \boldsymbol{0} . \end{equation}
Volume of fluid created by the particle as a consequence of the displacement from  $\boldsymbol {x}_{p,0}$ to
 $\boldsymbol {x}_p=\boldsymbol {x}_{p,0} + \Delta \boldsymbol {x}_p$, with
 ${{\delta }_p}=\Delta \boldsymbol {x}_p\boldsymbol {\cdot } \boldsymbol {n}_0$ the normal displacement of a point on the surface of
 $\varSigma _{p,0}$ such that
 ${\rm d}\mathcal {V}= \delta _p \,\mathrm {d} \varSigma$.

The torque balance (2.4a) can be rewritten in a similar manner, but in this case, the momentum balance is first rotated around  $\boldsymbol {x}_p$ by taking the wedge product of (2.2) and
 $\boldsymbol {x}-\boldsymbol {x}_p$. In so doing, one obtains
 \begin{align}
\int_{\varSigma_{p,0}}\left\{ \boldsymbol{n}_{0}
\boldsymbol{\cdot} \hat{\boldsymbol{T}}_2 \!+\! Re
\,\delta_p \left({\frac{\partial
\boldsymbol{v}_{2}}{\partial t}} + \boldsymbol{v}_2
\boldsymbol{\cdot} \boldsymbol{\nabla}
\boldsymbol{v}_{2}\right) \right\} \times
(\boldsymbol{x}-\boldsymbol{x}_p)\, {\rm
d}\varSigma =\int_{\varSigma_{p}} \boldsymbol{n}
\boldsymbol{\cdot} \hat{\boldsymbol{T}}_2 \times
(\boldsymbol{x}-\boldsymbol{x}_p )\, {\rm
d}\varSigma,
\end{align}
where it has been taken into account that  $( \boldsymbol {\nabla } \boldsymbol {\cdot } \hat {\boldsymbol {T}}_2 ) \times (\boldsymbol {x}-\boldsymbol {x}_p) = \boldsymbol {\nabla } \boldsymbol {\cdot } [\hat {\boldsymbol {T}}_2 \times (\boldsymbol {x}-\boldsymbol {x}_p)]$, since the stress tensor is symmetric. Hence, using (B4), the boundary condition (2.4a) can be written as
 \begin{equation} \int_{\varSigma_{p,0}} \left\{ \boldsymbol{n}_{0} \boldsymbol{\cdot} \hat{\boldsymbol{T}}_2 + Re \,\delta_p \left({\frac{\partial \boldsymbol{v}_{2}}{\partial t}} + \boldsymbol{v}_2 \boldsymbol{\cdot} \boldsymbol{\nabla} \boldsymbol{v}_{2}\right) \right\} \times (\boldsymbol{x}-\boldsymbol{x}_p)\, {\rm d}\varSigma = 0 . \end{equation}
Finally, the no-slip condition at the particle surface (2.4b) can be written at  $\varSigma _{p,0}$ by performing a Taylor expansion in the normal direction:
 \begin{equation} \boldsymbol{v}_{2} + \delta_p \boldsymbol{n}_0 \boldsymbol{\cdot} \boldsymbol{\nabla} \boldsymbol{v}_{2} = \boldsymbol{\varOmega} \times (\boldsymbol{x} + \delta_p \boldsymbol{n}_0-\boldsymbol{x}_p) + \frac{{\rm d}\kern0.7pt \boldsymbol{x}_p}{{\rm d} t} \quad \text{at}\ \varSigma_{p,0} ,\end{equation}
where all variables and the outer normal vector are defined at  $\varSigma _{p,0}$.
B.2. Boundary conditions of the fluid-fluid interface
The continuity of velocities at the fluid–fluid interface (2.10a) can be written at the unperturbed interface by performing a Taylor expansion in the normal direction, i.e.
 \begin{equation} [\boldsymbol{v}] + \delta \boldsymbol{n}_0 \boldsymbol{\cdot} \boldsymbol{\nabla} [\boldsymbol{v}]=0 \quad \mbox{at}\ \varGamma_0 . \end{equation}
To write the jump condition on the stress tensor at the unperturbed surface  $\varGamma _0$, we start by considering the left-hand side of the boundary condition (2.10b). First, we apply the bracket operator to (2.2) at the interface. Second, we integrate the resulting equation on the volume generated by displacing any arbitrary surface
 $\varGamma '_0$ lying on
 $\varGamma _0$ by an amount
 $\delta \boldsymbol {n}_0$ towards
 $\varGamma '$, with
 $\varGamma '$ lying on
 $\varGamma$. After using the divergence theorem and rearranging terms, as well as considering that the normal vector to the generatrix is
 $\boldsymbol {n}_{S_0}$, we obtain
 \begin{equation} \int_{\varGamma'} [\hat{\boldsymbol{T}} ] \boldsymbol{\cdot} \boldsymbol{n} \,\mathrm{d} \varGamma = \int_{\varGamma'_0} \left\{ [\hat{\boldsymbol{T}}] \boldsymbol{\cdot} \boldsymbol{n}_0 - {\boldsymbol{D}}_{S} \boldsymbol{\cdot} \left(\delta [\hat{\boldsymbol{T}}] \right) + Re \,\delta \left(\dfrac{\partial \boldsymbol{v}_{i}}{\partial t}+ \boldsymbol{v}_{i} \boldsymbol{\cdot} \boldsymbol{\nabla} \boldsymbol{v}_{i} \right) \right\} {\rm d}\varGamma , \end{equation}
where the surface integral at the generatrix has been written, by virtue of the divergence theorem (B1b), as  $\int _{\partial \varGamma _0} \boldsymbol {n}_S \boldsymbol {\cdot } ( \delta [\hat {\boldsymbol {T}}] ) \,\mathrm {d} (\partial \varGamma ) = \int _{\varGamma _0} {\boldsymbol {D}}_{S} \boldsymbol {\cdot } ( \delta [\hat {\boldsymbol {T}}] ) \,\mathrm {d} \varGamma$. For more details of this procedure, readers are referred to Rivero-Rodriguez & Scheid (Reference Rivero-Rodriguez and Scheid2018), Ruiz-Martín et al. (Reference Ruiz-Martín, Rivero-Rodriguez and Sánchez-Sanz2022b) and Cappello et al. (Reference Cappello, Rivero-Rodríguez, Vitry, Dewandre, Sobac and Scheid2023).
The right-hand side of (2.10b) can be written at  $\varGamma _0$ using the divergence theorem (B1b) to give
 \begin{equation} \int_{\varGamma'} \left( - \boldsymbol{n} \boldsymbol{\nabla} \boldsymbol{\cdot} \boldsymbol{n} \right) {\rm d} \varGamma = \int_{\partial \varGamma'} \boldsymbol{n}_S \,\mathrm{d} ( \partial \varGamma ) = \int_{\partial \varGamma'_0} \boldsymbol{n}_{S_0} \boldsymbol{\cdot} \boldsymbol{\mathcal{B}} \,\mathrm{d}\kern0.7pt x = \int_{\varGamma'_0} {\boldsymbol{D}}_{S} \boldsymbol{\cdot} \boldsymbol{\mathcal{B}} \,\mathrm{d} \varGamma, \end{equation}
where  $\boldsymbol {\mathcal {B}}= \boldsymbol {n}_{S_0} \boldsymbol {n}_{S}$ is the rotation tensor, and
 $\boldsymbol {n}_{S_0}$ and
 $\boldsymbol {n}_{S}$ are the vectors tangential to the unperturbed
 $\varGamma _0$ and perturbed interface
 $\varGamma$, respectively.
Finally, using (B8) and (B9), and considering that they are valid for any arbitrary  $\varGamma '_0$, (2.10b) can be rewritten as
 \begin{equation} [\hat{\boldsymbol{T}}] \boldsymbol{\cdot} \boldsymbol{n}_0 - {\boldsymbol{D}}_{S} \boldsymbol{\cdot} \left( \delta [\hat{\boldsymbol{T}}] \right) + Re \,\delta \left(\dfrac{\partial \boldsymbol{v}_{i}}{\partial t}+ \boldsymbol{v}_{i} \boldsymbol{\cdot} \boldsymbol{\nabla} \boldsymbol{v}_{i} \right) = Ca^{{-}1}\,{\boldsymbol{D}}_{S} \boldsymbol{\cdot} \boldsymbol{\mathcal{B}} \quad\mbox{at}\ \varGamma_0 . \end{equation}
Similarly, the kinematic condition (2.9) can be written at the unperturbed interface by integrating (2.1) for liquid 2 on the same generated volume, yielding
 \begin{equation} \boldsymbol{v}_2 \boldsymbol{\cdot} \boldsymbol{n}_0 - {\boldsymbol{D}}_{S} \boldsymbol{\cdot} (\delta \boldsymbol{v}_2) = \frac{\partial \delta}{\partial t} \quad \mbox{at} \ \varGamma_0 . \end{equation}
Appendix C. A simple mathematical strategy to analyse the interaction of the different modes
To check whether the particle migration, interfacial and shear modes are coupled, the significance of each contribution can be assessed by cancelling out successively the corresponding local term in the linearized system of equations. To do so, we introduce the artificial parameter  $\alpha _{NS}$ in the first term in the momentum equation (2.13) for the shear mode,
 $\alpha _{\delta }$ in the first term on the right-hand side of (2.17a) for the interfacial mode, and
 $\alpha _{\epsilon }$ in the last term on the right-hand side of (2.14c) for the migration mode. The interaction of the different modes will be evaluated by switching the factor
 $\alpha _{NS}$,
 $\alpha _{\delta }$,
 $\alpha _{\epsilon }$ from 1, if the contribution of the mode is accounted for, to 0 when it is neglected.
For the interfacial instability ( $\lambda _{i} \neq 0$), the evolution of the real part of the largest (most dangerous) eigenvalue with the particle position
 $\xi$ is shown in figure 19 for different interface positions
 $\eta$ or, equivalently, flow rate ratios. In figure 19(a), we consider the full system of linearized equations. To analyse their relative importance, we cancel the shear mode with
 $\alpha _{NS}=0$ in figure 19(b) and the particle migration with
 $\alpha _\epsilon =0$ in figure 19(c). The evolution of the pure interfacial mode (
 $\alpha _\epsilon =\alpha _{NS}=0$) is shown in figure 19(d). Comparing figures 19(a) and 19(b), we understand that the coupling between the different instability mechanisms can introduce additional unstable modes. The potential destabilizing effect of the shear mode is illustrated in figures 19(a) and 19(b) for
 $\eta =0.50$ (red line), with the zeroing of the shear mode contribution stabilizing the system for
 $\xi >0.70$ even at very small Reynolds number
 $Re=0.05$. The comparison between figures 19(a) and 19(c) reveals that particle migration affects significantly the interfacial mode by increasing the maximum growth rate, especially when the particle is near the interface.
Most dangerous eigenvalue for  $Re=0.05$,
 $\mu _{1}/\mu _{2}=0.1$,
 $L=40$,
 $Ca^{-1}=1$ and different values of the interface position
 $\eta$ corresponding to: (a) full linearized system,
 $\alpha _{\delta }=\alpha _{\epsilon }=\alpha _{NS}=1$; (b) no shear mode system,
 $\alpha _{\delta }=\alpha _{\epsilon }=1$,
 $\alpha _{NS}=0$; (c) no migration mode system,
 $\alpha _{\delta }=\alpha _{NS}=1$,
 $\alpha _{\epsilon }=0$, (d) pure interfacial system,
 $\alpha _{\delta }=1$,
 $\alpha _{\epsilon }=\alpha _{NS}=0$.

Considering the same values of the interface position  $\eta$ considered in figure 19, we illustrate in figure 20(a) the evolution of the migration, and in figures 20(b–d) shear modes with the particle position. As anticipated, the migration mode, associated with equilibrium solutions, is uncoupled from the other instability mechanisms and can be studied separately (Ruiz-Martín et al. Reference Ruiz-Martín, Rivero-Rodriguez and Sánchez-Sanz2022b). In figures 20(b–d), we plot the real parts of the eigenvalues with non-zero imaginary part. From the figure we can check that they are of order
 $\lambda _r \sim O(Re^{-1})$, a value that is characteristic of eigenvalues that belong to the shear mode. Comparing figures 20(b) and 20(c), we can see that the shear mode is barely affected by the particle migration, whereas comparing figures 20(b) and 20(d), we see that the interfacial mode increases the growth rate of the shear mode, especially at smaller values of
 $\eta$. The inset in figure 20(b) shows the evolution of the shear mode with the Reynolds number
 $\eta =0.50$, demonstrating the linear dependency
 $\lambda _{r} \sim -Re^{-1}$ anticipated in § 3.
(a) Eigenvalue associated with the particle migration. Red lines with circle markers represent the solution given by the full linearized system; blue lines with cross markers indicate zero interfacial mode contribution ( $\alpha _{\delta }=0$); asterisk markers are for vanishing NS local term (
 $\alpha _{NS}=0$, zero hydrodynamics mode contribution); and up arrows are for the pure migration system (
 $\alpha _{\delta }=\alpha _{NS}=0$). (b) Pure shear mode (
 $\alpha _{NS}=1$,
 $\alpha _{\epsilon }=\alpha _{\delta }=0$). The inset shows the evolution of the most dangerous shear mode with
 $Re$ for
 $\xi =0.50$. (c) Shear mode without the effect of the interfacial mode (
 $\alpha _{NS}=\alpha _{\epsilon }=1$,
 $\alpha _{\delta }=0$). (d) Shear mode without the effect of the particle migration (
 $\alpha _{NS}=\alpha _{\delta }=1$,
 $\alpha _{\epsilon }=0$). The flow parameters are the same as in figure 19.


 Open access

