

Introduction
Wideband antennas have attracted much research interest during the last years, especially for their low-cost, ease of fabrication, and low profile. They can be designed considering different fabrication technologies, such as microstrip on printed circuit board (PCB), 3D printing, or substrate-integrated waveguide (SIW) technology [Reference Loconsole, Portosi, Francione, Roberto, Anelli and Prudenzano1–Reference Puskely, Lacik, Raida and Arthaber7]. Antipodal Vivaldi antennas (AVAs) are wideband and low cost. They can exhibit multiple flares, improving their compactness [Reference Fei, Jiao, Hu and Zhang4–Reference De Oliveira, Perotoni, Kofuji and Justo6]. The gain can be enhanced by considering metamaterials (MTMs) [Reference Shi, Cao, Hu, Luo, Yang and Ye8]. MTMs are defined as engineered artificial materials with unusual properties, not available in nature. MTMs are structures composed by very little cell elements, compared to the guided wavelength. Therefore, they can be considered homogeneous material, from an electromagnetic point of view. An array of elementary cells can act as a metalens to improve antenna performance in terms of directivity and gain, by keeping a compact size and low profile [Reference Shi, Cao, Hu, Luo, Yang and Ye8–Reference Mustacchio, Boccia, Arnieri and Amendola11]. MTMs can also improve the matching with biological tissues for medical applicators, along with electromagnetic tracking systems for surgical navigation [Reference Portosi, Loconsole and Prudenzano9, Reference Portosi, Loconsole, Valori, Marrocco, Bonelli, Pascazio, Lampignano, Fasano and Prudenzano12, Reference Attivissimo, Lanzolla, Carlone, Larizza and Brunetti13].
In this work, a wideband AVA has been designed and optimized. After this step, the possibility of increasing the gain over the whole operating bandwidth is investigated by employing ad hoc designed metalenses. Different metalenses have been proposed and combined. The prototypes have been constructed and characterized, showing agreement with the simulations.
An earlier version of this paper was presented at the XXI Mediterranean Microwave Symposium and was published in its Proceedings [Reference Loconsole, Portosi, Francione, Roberto, Anelli and Prudenzano1].
Recall of theory
AVA can be designed starting from well-known formulas describing the exponential flares [Reference Loconsole, Portosi, Francione, Roberto, Anelli and Prudenzano1, Reference Hood, Karacolak and Topsakal3]:
 \begin{equation}{x_i} = {C_1}_i{e^{{R_i}y}} + {C_{{2_i}}}\end{equation}
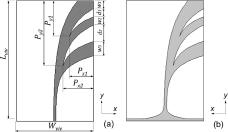
where R is the exponential opening rate. The coordinates of the start and ending points of the exponential curves 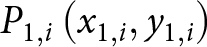 ${P_{1,i}} \left( {{x_{1,i}},{y_{1,i}}} \right)$ and
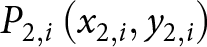 ${P_{2,i}} \left( {{x_{2,i}},{y_{2,i}}} \right)$ (see Figure 1) determine the coefficients
 ${C_{{1_i}}}$ and
 ${C_{{2_i}}}$, according to equations (2) and (3).
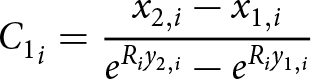 \begin{equation}{C_1}_i = {{{x_{2,i}} - {x_{1,i}}} \over {{e^{{R_i}{y_{2,i}}}} - {e^{{R_i}{y_{1,i}}}}}}\end{equation}
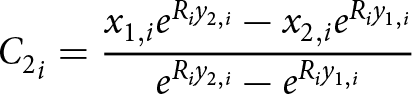 \begin{equation}{C_2}_i = {{{x_{1,i}}{e^{{R_i}{y_{2,i}}}} - {x_{2,i}}{e^{{R_i}{y_{1,i}}}}} \over {{e^{{R_i}{y_{2,i}}}} - {e^{{R_i}{y_{1,i}}}}}}\end{equation}
Scheme of the AVA: (a) Top view, and (b) Bottom view.
The electromagnetic properties of an MTM can be described by its effective parameters, which can be calculated considering the average of the local charge, current, and field distribution. The MTM numerical characterization, based on the assumption of homogenization, can be exploited with the S-parameter retrieval method, based on the Kramers–Kronig relationship [Reference Smith, Vier, Koschny and Soukoulis14, Reference Szabo, Park, Hedge and Li15]. The effective electric permittivity ( ${\varepsilon _{{\textrm{eff}}}}$) and the effective magnetic permeability (
 ${\mu _{{\textrm{eff}}}}$) are calculated from the complex wave impedance (
 ${Z_{{\textrm{eff}}}}$) and complex refractive index (
 ${N_{{\textrm{eff}}}}$), obtained from the S-parameters.
Design
The antennas have been designed considering the substrate Rogers RO4350B, with dielectric permittivity 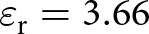 ${\varepsilon _{\textrm{r}}} = 3.66$ and loss tangent
 ${\textrm{tan}}\;\delta = 0.0037$, with commercial thickness
 ${t_{{\rm{sub}}}} = 0.762\;{\rm{mm}}$ and standard copper cladding with thickness
 ${t_{\rm{c}}} = 0.035\;{\rm{mm}}$.
Antipodal Vivaldi antenna
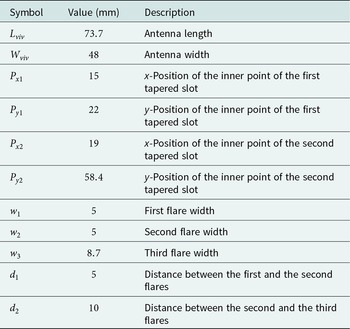
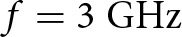
The layout of the designed AVA is reported in Figure 1. It is characterized by three flares and an operating bandwidth from 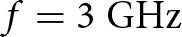 $f = 3\;{\textrm{GHz}}$ to
 $f = 13\;{\textrm{GHz}}$. Each tapered flare has been designed by considering equations (1–3). To minimize the antenna size, two tapered slots have been optimized [Reference Hood, Karacolak and Topsakal3]. In the design, numerical simulations have been performed with CST Studio Suite® by varying (i) the flares widths
 ${w_1}, {w_2}, {w_3}$, and (ii) the distances between the flares
 ${d_1}, {d_2}$. The optimized geometric parameters, in terms of maximum gain over the whole operating bandwidth, are listed in Table 1.
Geometric parameters of AVA

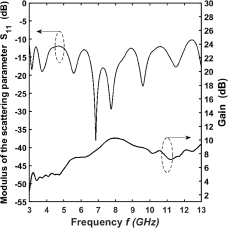
Figure 2 shows the modulus of the scattering parameter  ${S_{11}}$ and the gain
 $G$ as a function of the frequency
 $f$ of the AVA simulated with the parameters of Table 1. The simulated maximum gain is about
 ${G_{{\rm{max}}}} = 10.3\;{\rm{dB}}$ at the frequency
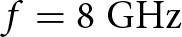 $f = 8\;{\rm{GHz}}$.
Simulated modulus of the scattering parameter  ${S_{11}}$ and realized gain
 $G$ as a function of the frequency
 $f$ of the AVA.
Metalens
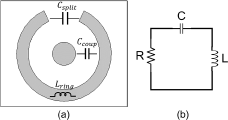
The geometry of the unit cell consists of a modified version of the well-known split-ring resonator (SRR), as shown in Fig. 3(a). Its equivalent resonant circuit is shown in Fig. 3(b). When electromagnetic radiation propagates through the metalens, currents and local charges are induced on the metal rings. Capacitive effects  ${C_{{\textrm{split}}}}$ occur at the non-parallel capacitive gap. A metal dot, placed in the center of the circular ring, induces the capacitive coupling effect
 ${C_{{\textrm{coup}}}}$ with the ring, increasing the metalens’ global effective capacitance. Self-inductance effects
 ${L_{{\textrm{ring}}}}$ occur along the circular ring. The metal inclusions are placed on both sides of the substrate, so strong mutual coupling effects occur between the top and bottom layer of the unit cell.
(a) Scheme of the designed SRR unit cell and (b) its equivalent circuit.
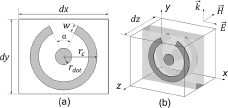
The unit cell geometry has been optimized by numerical simulations when arranged in planar arrays integrated on the AVA substrate. The SRR unit cell scheme, with the geometric parameters considered for the modeling and the simulations, is shown in Figure 4. For the optimization, geometries with and without the central dot have been considered by varying (i) the ring radius  ${r_c} $; (ii) the angular aperture of the split
 $\alpha $; (iii) the strip width
 $w$; and (iv) the unit cell lattice lengths
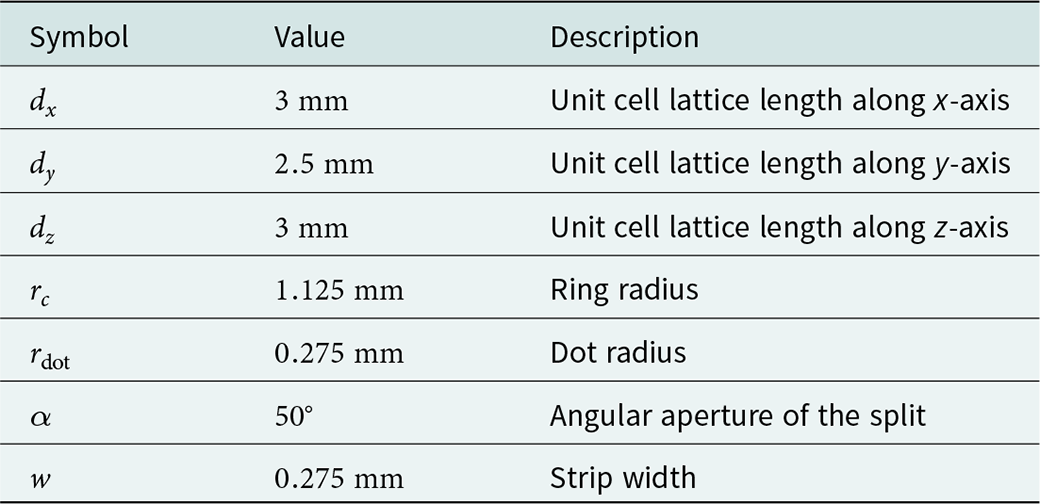
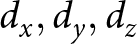 ${d_x}, {d_y}, {d_z}$. The optimized geometric parameters of the SRR unit cell are listed in Table 2.
Scheme of the SRR unit cell: (a) Top and bottom view, and (b) 3D view.
Geometric parameters of the SRR unit cell
To investigate the transmission properties of the designed metalens, numerical analysis has been performed by following two different approaches.
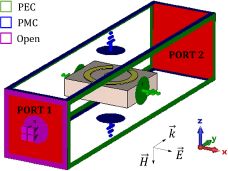
In the first step, a single unit cell under appropriate boundary conditions, as shown in Figure 5, has been considered. Starting from the simulated S-parameters of the structure of Figure 4, with the values listed in Table 2, the metalens effective parameters have been calculated using the S-parameter retrieval method [Reference Smith, Vier, Koschny and Soukoulis14, Reference Szabo, Park, Hedge and Li15]. The simulated modulus of the S-parameters of SRR unit cell as a function of the frequency  $f$ is shown in the Fig. 6(a). The retrieved effective parameters as a function of the frequency
 $f$, complex refractive index (
 ${N_{{\textrm{eff}}}}$), effective electric permittivity (
 ${\varepsilon _{{\textrm{eff}}}}$), and effective magnetic permeability (
 ${\mu _{{\textrm{eff}}}}$) are shown in Fig. 6(b–6) respectively. The modulus of the scattering parameter
 ${S_{11}}$ is smaller than
 $ - 4\;{\textrm{dB}}$ for frequencies below
 $f \lt 13\;{\textrm{GHz}}$, as shown in Fig. 6(a). The complex effective refractive index
 ${N_{{\textrm{eff}}}} = {n_{{\textrm{eff}}}} + j{k_{{\textrm{eff}}}}$ of Fig. 6(b) shows a constant non-resonant value in the whole bandwidth.
Simulation model and the boundary conditions for the effective parameters retrieval.
(a) The simulated S-parameters and the retrieved effective parameters as a function of the frequency  $f$, (b) complex refractive index (
 ${N_{{\textrm{eff}}}}$), (c) effective electric permittivity (
 ${\varepsilon _{{\textrm{eff}}}}$), and (d) effective magnetic permeability (
 ${\mu _{{\textrm{eff}}}}$) of SRR unit cell.
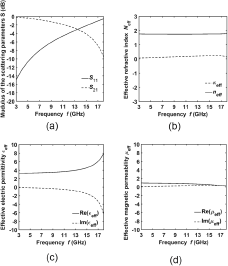
These results, even if approximated, give valuable information regarding a non-resonant and promising good behavior for all the considered metalenses over the bandwidth of interest [Reference Li, Zhou, Gao, Wang and Lv16, Reference Chen, Lei, Yang, Fan and Shi17].
In a second step, all the different metalenses, constituted by the actual number of cells have been investigated too, with and without the AVA, confirming the feasibility of the chosen geometry. The results are not reported for the sake of shortness.
Antenna with metalenses (AVA SRR)
Different configurations of metalenses have been considered. Three of the most interesting and optimized antennas are shown in Figure 7.
Scheme of the designed antenna with metalenses: (a) AVA SRR#1, (b) AVA SRR#2, and (c) AVA SRR#3.
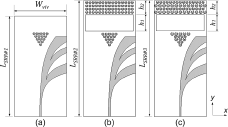
The antenna with a triangular metalens, labeled as AVA SRR#1, is shown in Fig. 7(a). The metalens, placed between the flares of the antenna in the end-fire direction, consists of a triangular array of 15 SRR unit cells.
The second antenna, labeled as AVA SRR#2 in Fig. 7(b), has been obtained from AVA SRR#1 by introducing a rectangular metalens at a distance  ${h_1}$ from the triangular one, with an air gap between them. The rectangular metalens consists of 60 elements arranged in a
 $N \times M = 4 \times 15$ array.
For the metalenses of the third antenna, labeled as AVA SRR#3 in Fig. 7(c), variable unit cells size has been exploited to have a good behavior for different frequencies.
In the design, the optimization of the AVA with these three different SRR metalenses has been performed in the frequency range  $f = 3 \div 13\;{\textrm{GHz}}$, varying (i) the metalens position; (ii) the number of unit cells for both triangular and rectangular array; (iii) the distance between triangular and rectangular metalens
 ${h_1}$; and (iv) the scaling factor
 $k$ of the unit cells in the case of alternate rows, i.e. for AVA SRR#3. The optimized geometric parameters of the AVA SRR antennas are listed in Table 3. An optimized scaling factor of
 $k = 1.125$ has been identified, after several simulations, to scale up the unit cells of the alternate rows for both triangular and rectangular metalenses of AVA SRR#3.
Geometric parameters of the AVA SRR antennas
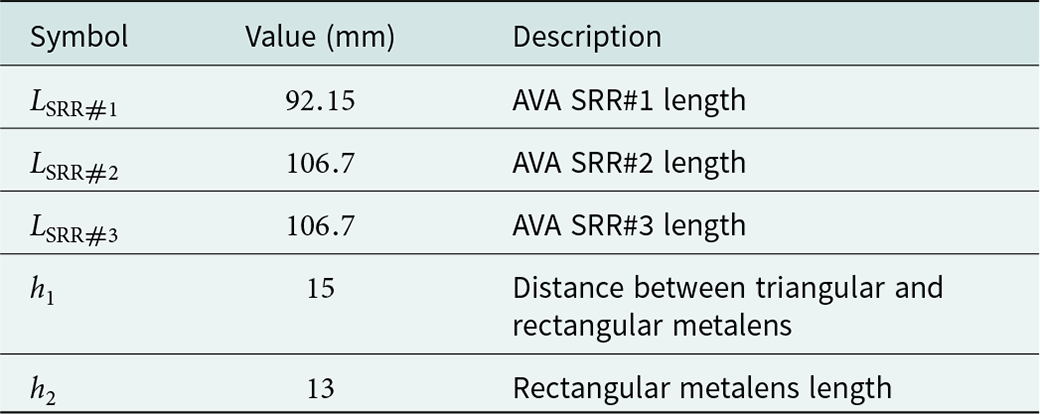
Figure 8 depicts the simulated modulus of the scattering parameter  ${S_{11}}$ as a function of the frequency
 $f$. The optimized AVA SRR#1 (dashed line) maintains the wideband pristine behavior of AVA. For the optimized AVA SRR#2 (dash-dotted line) and AVA SRR#3 (dotted line), the introduction of rectangular metalens in addition to the triangular one, slightly reduces the
 $ - 10\;{\textrm{dB}}$ bandwidth at high frequencies.
Simulated modulus of the scattering parameter  ${S_{11}}$ as a function of the frequency
 $f$, for the AVA without metalens (solid line), the AVA SRR#1 (dashed line), the AVA SRR#2 (dash-dotted line), and the AVA SRR#3 (dotted line).
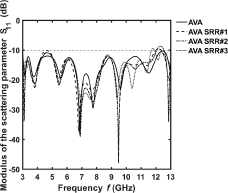
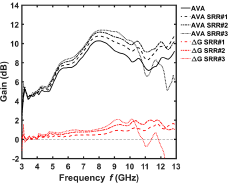
Figure 9 shows the simulated gain G (black lines) and gain increase  ${{\Delta }}G{\ }$(red lines) as a function of frequency
 $f$. For AVA SRR#1 a maximum gain of
 ${G_{{\rm{max}}}} = 10.8\;{\rm{dB}}$ and a maximum gain increase of
 $\Delta {G_{{\rm{max}}}} = 1.7\;{\rm{dB}}$ at the frequency
 $f = 12.9\;{\rm{GHz}}$ have been simulated. Better gain performances are obtained over the whole bandwidth for AVA SRR#2, with a maximum gain
 ${G_{{\rm{max}}}} = 11.2\;{\rm{dB}}$ at
 $f = 8.1\;{\textrm{GHz}}$ and a maximum gain increase
 $\Delta {G_{{\rm{max}}}} = 2\;{\textrm{dB}}$ at
 $f = 11.8\;{\textrm{GHz}}$. AVA SRR#3 exhibits the highest gain only below
 $f \lt 10.3\;{\rm{GHz}}$ with a maximum value
 ${G_{{\rm{max}}}} = 11.4\;{\textrm{dB}}$ at
 $f = 8.2\;GHz$ and a maximum gain increase of
 $\Delta {G_{{\rm{max}}}} = 2.1\;{\textrm{dB}}$ at
 $f = 10.1\;{\rm{GHz}}$.
Simulated gain G (black lines) and gain increase  ${{\Delta }}G{\ }$(red lines) as a function of frequency
 $f$, for the AVA without metalens (solid line), the AVA SRR#1 (dashed line), the AVA SRR#2 (dash-dotted line), and the AVA SRR#3 (dotted line).
Fabrication and characterization
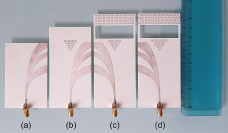
The antenna prototypes, shown in Figure 10, have been fabricated with Rogers RO4350B dielectric substrate using the easy and low-cost PCB fabrication process. The geometrical parameters are listed in Tables 1 and 2. They have been characterized with the N5224A PNA Microwave Network Analyzer and the Satimo StarLab Antenna Pattern Measurement System, shown in Figure 11.
Constructed prototypes: (a) AVA, (b) AVA SRR#1, (c) AVA SRR#2, and (d) AVA SRR#3.
Characterization of the AVA SRR#2 prototype with the Satimo StarLab Antenna Pattern Measurement System.
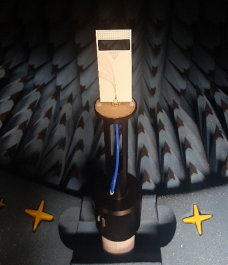
Figure 12 shows the measured modulus of the scattering parameter  $\left| {{S_{11}}} \right| $ as a function of frequency
 $f$ for all the AVA prototypes. The experimental results confirm the
 $ - 10\;{\rm{dB}}$ bandwidth over the entire band
 $f = 3\;{\rm{GHz}} \div 13\;{\rm{GHz}}$ in all cases.
Measured modulus of the scattering parameter  ${S_{11}}$ as a function of the frequency
 $f$, for the AVA without metalens (black line), the AVA SRR#1 (magenta line), the AVA SRR#2 (green line), and the AVA SRR#3 (cyan line).

Figure 13 shows the comparison between simulated (solid lines) and measured (dotted lines) gain  $G$ as a function of frequency
 $f$ for the four AVA antennas. The experimental results agree with the simulations, confirming that the designed metalenses allow a gain improvement over the entire band in the case of AVA SRR#1 and AVA SRR#2, and at low frequencies for AVA SRR#3. A maximum gain of
 ${G_{{\rm{max}}}} = 11.5\;{\rm{dB}}$ at
 $f = 13\;{\rm{GHz}}$ for AVA SRR#1, of
 ${G_{{\rm{max}}}} = 11.4\;{\rm{dB}}$ at
 $f = 8.6\;{\rm{GHz}}$ for AVA SRR#2, and of
 ${G_{{\rm{max}}}} = 12\;{\rm{dB}}$ at
 $f = 8.6\;{\rm{GHz}}$ for AVA SRR#3, have been measured.
Simulated (solid lines) and measured (dotted lines) gain as a function of frequency  $f$, for the AVA without metalens (black line), the AVA SRR#1 (magenta line), the AVA SRR#2 (green line), and the AVA SRR#3 (cyan line).
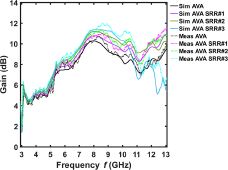
Figure 14 allows an easier comparison between simulated (solid lines) and measured (dotted lines) gains, illustrating the increase  ${{\Delta }}G$ of the three AVA with metalens with respect to the AVA without metalens. The measured curves are close enough with the simulated ones.
Simulated (solid lines) and measured (dotted lines) gain increase as a function of frequency  $f$, for the AVA SRR#1 (magenta line), the AVA SRR#2 (green line), and the AVA SRR#3 (cyan line).

Table 4 summarizes the main results.
Simulated and measured maximum gain  ${G_{{\textrm{max}}}}$ and maximum gain increase
 $\Delta {G_{{\textrm{max}}}}\;$of the AVA SRR antennas
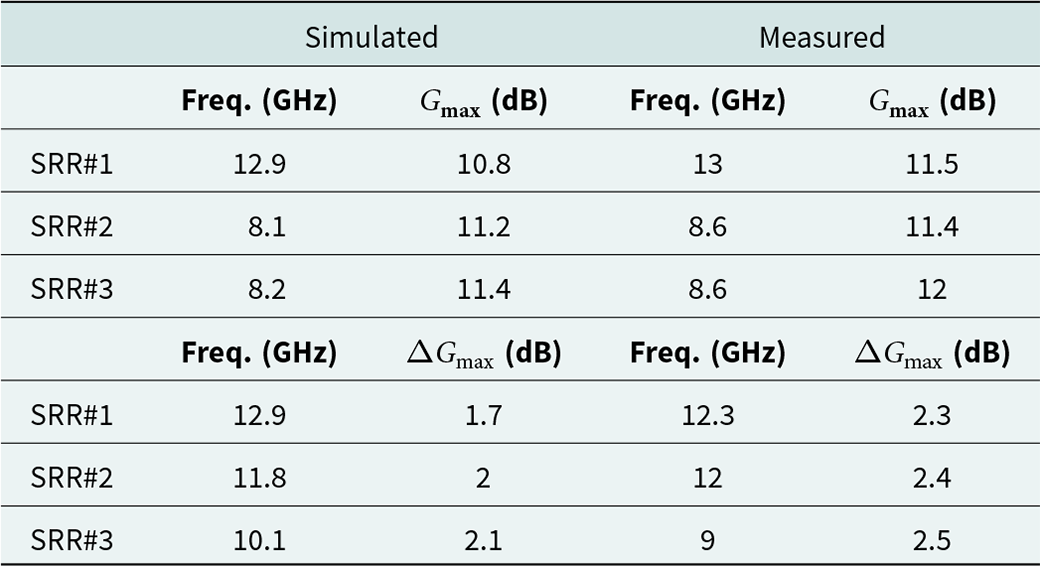
Figure 15 shows the measured E-plane and H-plane radiation patterns of the AVA with metalens compared to that of AVA without metalens at the frequencies where the maximum gain increase  ${{\Delta }}G$ occurs. The measured half-power beamwidth (HPBW) of the AVA is reduced over the entire band when the metalenses are integrated on the antenna. The measured
 $ - 3\;{\textrm{dB}}$ beamwidth in the H-plane is reduced from
 $HPB{W_{{\textrm{AVA}}}} = {\textrm{ }}46.36^\circ {\textrm{ }}$ to
 $HPB{W_{SRR\# 1}} = 40.70^\circ $ for AVA SRR#1 at
 $f = 12.3\;{\textrm{GHz}}$, from
 $HPB{W_{AVA}} = 51.27^\circ $ to
 $HPB{W_{SRR\# 2}} = 33.6^\circ $ for AVA SRR#2 at
 $f = 12\;{\textrm{GHz}}$, and from
 $HPB{W_{AVA}} = 62.91^\circ $ to
 $HPB{W_{SRR\# 3}} = 43.29^\circ $ for AVA SRR#3 at
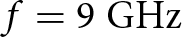 $f = 9\;{\textrm{GHz}}$.
Measured E-plane (left column) and H-plane (right column) radiation patterns of the AVA (solid line) and (a) AVA SRR#1 (dotted line) at frequency  $f = 12.3\;{\textrm{GHz}}$, (b) AVA SRR#2 (dotted line) at frequency
 $f = 12\;{\textrm{GHz}}$, and (c) AVA SRR#3 (dotted line) at frequency
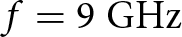 $f = 9\;{\textrm{GHz}}$.

A comparison between the proposed AVAs SRR and other AVAs reported in literature is shown in Table 5. In particular, our AVAs SRR max gain is higher than that of [Reference Natarajan, George, Kanagasabai and Kumar Shrivastav2–Reference Fei, Jiao, Hu and Zhang4, Reference De Oliveira, Perotoni, Kofuji and Justo6] for similar operating bandwidth. Moreover, the AVAs SRR of this work enable higher miniaturization degree than that of [Reference Puskely, Lacik, Raida and Arthaber7, Reference Shi, Cao, Hu, Luo, Yang and Ye8, Reference Chen, Lei, Yang, Fan and Shi17]. The antenna reported in [Reference Shi, Cao, Hu, Luo, Yang and Ye8] allows a higher max gain but it benefits of both a metalens and a director element requiring a size increase.
Measured results comparison
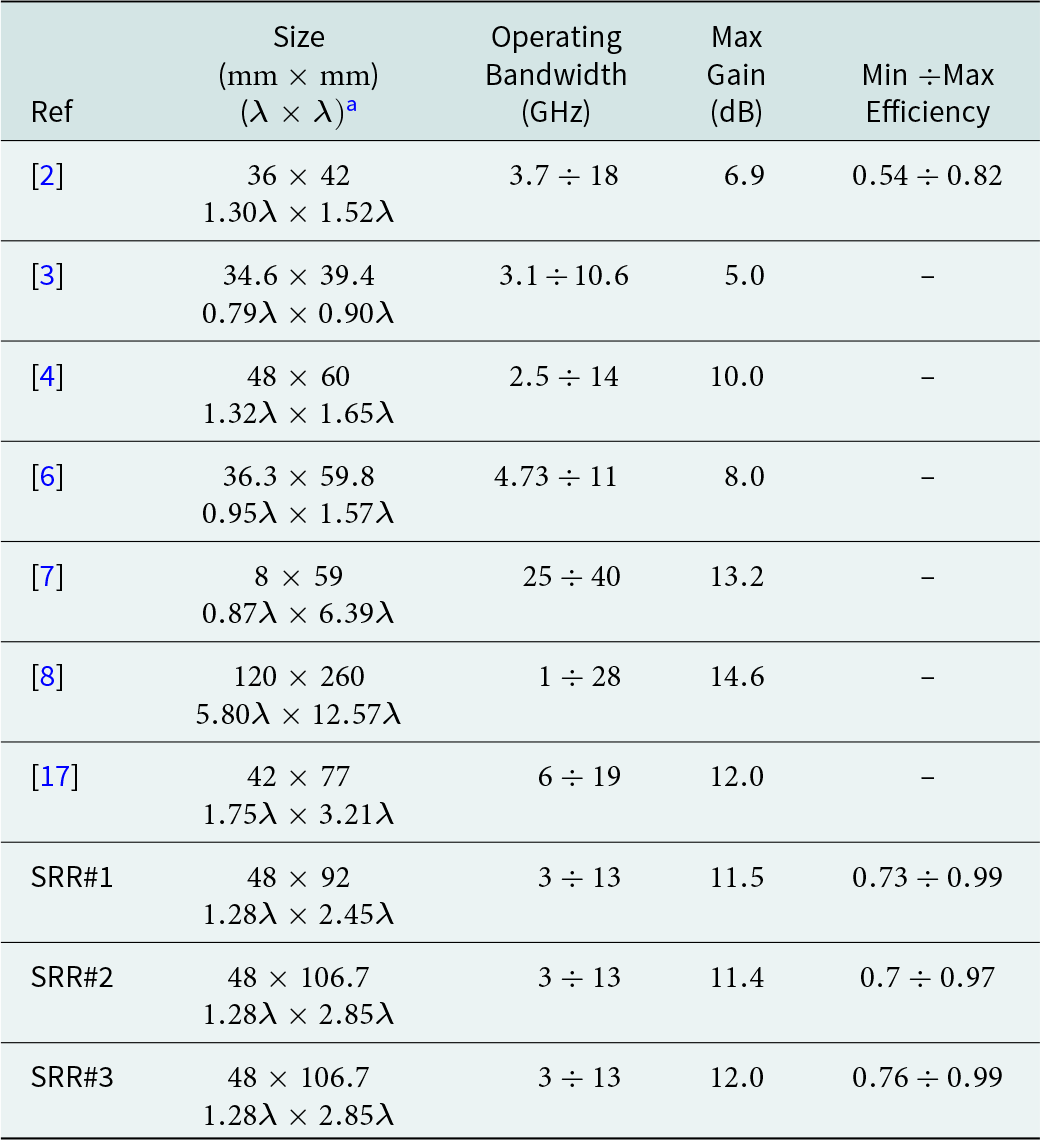
a  $\lambda$ is the wavelength at the center frequency of the operating bandwidth.
Conclusion
Microstrip AVAs with metalenses have been designed, constructed, and characterized in the frequency band  $f = 3 \div 13\;{\rm{GHz}}$. Simulated and measured performances are in good agreement, confirming the improvement of the gain in a wide frequency range, preserving the operating bandwidth. A maximum gain of about
 ${G_{{\rm{max}}}} = 12\;{\rm{dB}}$ and a maximum gain increase of about
 $\Delta {G_{{\rm{max}}}} = 2.5\;{\textrm{dB}}$ have been measured.
Acknowledgements
This work was partially supported by the European Union under the Italian National Recovery and Resilience Plan (NRRP) of NextGenerationEU, with particular reference to the partnership on “Telecommunications of the Future” (PE00000001 - program “RESTART”, CUP: D93C22000910001) – DREAM - Antennas & Devices foR mixing, dEtection And Manipulation of mmWaves; MIUR “Agriculture Green & Digital – AGREED”, PNR 2015/20, n. ARS01_00254; H2020-ICT-37-2020 “Photonic Accurate and Portable Sensor Systems Exploiting Photo-Acoustic and Photo-Thermal Based Spectroscopy for Real-Time Outdoor Air Pollution Monitoring – PASSEPARTOUT” n. 101016956.
Competing interests
All authors declare none.

Antonella Maria Loconsole received the M.Sc. degree in 2019 in Telecommunication Engineering (cum laude) from Politecnico di Bari, Bari, Italy, where she is currently working toward the Ph.D. degree in Electrical and Information Engineering. Her research interests include SIW antennas, microwave applicators for medical applications, and optical fiber lasers, amplifiers, and sensors.

Vincenza Portosi received the M.Sc. degree in 2018 in Electronic Engineering (cum laude) from Politecnico di Bari, Bari, Italy, where she is currently PhD student in Electrical and Information Engineering. Her research interests include microwave applicators for medical applications, metamaterials, SIW antennas, characterization of antennas, and microwave and optical resonators.

Vito Vincenzo Francione received the M.Sc. degree in 2021 in Automation Engineering (cum laude) from Politecnico di Bari, Bari, Italy, where he is Ph.D. student in Electrical and Information Engineering. His research interests include the modeling and the characterization of antennas, metamaterials, optical fiber sensors, and optical devices.

Francesco Anelli received the M.Sc. degree in 2021 in Electronic Engineering (cum laude) from Politecnico di Bari, Bari, Italy, where he is Ph.D. student in Electrical and Information Engineering. His research interests include the modeling and the characterization of antennas, metamaterials, optical fiber grating sensors and optical devices for multispectral gas monitoring.

Andrea Annunziato received the M.Sc. degree in electronic engineering (cum laude) from Politecnico di Bari, Bari, Italy, in 2020. He is currently working toward the Ph.D. degree in aerospace sciences and engineering at Politecnico di Bari. His research interests include optical fiber sensors, lasers, and amplifiers.

Mario Christian Falconi received the M.Sc. degree in Electronic Engineering (cum laude) and the Ph.D. degree in Electrical and Information Engineering, both from Politecnico di Bari, Bari, Italy, in 2015 and 2019, respectively. He was a Research Fellow in 2019 and is currently a Research Assistant in Electromagnetic Fields with the Department of Electrical and Information Engineering, Politecnico di Bari, Bari, Italy. His research interests include fiber lasers and amplifiers, photonic crystal fibers, and nonlinear effects in optical fibers.

Francesco Prudenzano (Member, IEEE, SPIE) received the Ph.D. degree in electronic engineering from Politecnico di Bari, Italy, in November 1996. Since 2018, he has been a Full Professor in Electromagnetic Fields with the Department of Electrical and Information Engineering, Politecnico di Bari, Italy. He is currently the Head of Microwave and Optical Engineering Group, Department of Electrical and Information Engineering, Politecnico di Bari. From 2016 to 2015 – vice Chair and from 2017 to 2018 – Chair of SIOF, the Italian Society of Optics and Photonics (Italian branch of EOS – European Optical Society). From 2018 to 2020 – Vice Chair of CoRiFI – The Italian Coordination of Innovation and Research on Photonic. Since 2021 Member of Politecnico di Bari Board Directors. From 2016 to 2021 Chair of Teacher Council of the first level degree in Electronic and Communication Engineering; since 2021 Chair of the second level degree in Communication Engineering. He is involved in several national and international research and cooperation projects, also with the role of Scientific Coordinator. Project Leader and co-Leader within COST MP0702 and MP1401, actions in the field of photonics. Chair of national and international conferences. He has coauthored more than 450 publications, many of which got published in journals and international conferences, lectures, and invited paper.