


1 Introduction
Epidemic theory for homogeneous populations has shown that the basic reproductive number (which maybe considered as the fitness of a pathogen in a given population) must be greater than unity for the pathogen to invade a susceptible population. In modelling specific infectious diseases, such as COVID-19, populations tend to be inhomogeneous and there are nonlocal interactions as the disease spreads spatially via travelling. Therefore, it is very important to investigate the effects of host heterogeneity on the spatial spread of infectious diseases. Population mobility is indeed a key factor for the spatial spread of infectious diseases. Reaction-diffusion equations, using Laplacian operators to describe the random population diffusion, have been extensively used to characterize the spatial transmission dynamics of various infectious diseases, we refer to Murray [Reference Murray16] for fundamental theory on epidemic models described by reaction-diffusion equations and to Fitzgibbon and Langlais [Reference Fitzgibbon and Langlais6], Ruan [Reference Ruan19], and Ruan and Wu [Reference Ruan and Wu20] for surveys on various diffusive models of infectious diseases involving spatial domains. See also Allen et al. [Reference Allen, Bolker, Lou and Nevai1], Lei et al. [Reference Lei, Li and Liu10], Li et al. [Reference Li, Peng and Wang11], Lin and Zhu [Reference Lin and Zhu13], Magal et al. [Reference Magal, Webb and Wu14], Song et al. [Reference Song, Lou and Xiao22], Yang et al. [Reference Yang, Li and Ruan26] and the references cited therein for recent theoretical studies on diffusive epidemic models.
Note that when Laplacian operators are used to describe population mobility it is assumed that the direction of population diffusion is isotropic; i.e., the probability of moving to any direction is equal. However, in real life it is not the case. For example, COVID-19 has been spread geographically from cities to cities and from countries to countries via air travelling (WHO [24]), in which passengers travel following certain flight routes. These routine patterns form complex networks connecting different cities. In the past two decades, epidemic transmission in heterogeneous networks has been widely investigated. We refer to a comprehensive review by Pastor-Satorras et al. [Reference Pastor-Satorras, Castellano, Van Mieghem and Vespignani18] and the references therein. Most studies on networked epidemic dynamics have been carried out on non-weighted graphs, i.e., the number of individuals travelled between each pair of cities is assumed to be constant. While in reality, the number of individuals traveling between each pair of cities is always different. To investigate the effect of heterogeneous human mobility, in this paper, we consider epidemic dynamic models on weighted graphs.
From the mathematical viewpoint a network is a graph
 $\mathcal{G} = (V , E)$
consisted of a set of vertices
 $V= \{1, 2, \cdots, n\}$
and a set of edges
 $E=\{(x, y), x, y \in V: (x, y) \text{ connects vertices } x \text{ and } y\}.$
If a vertex y is adjacent to a vertex x, we write
 $y\sim x$
. A graph is weighted if each pair of adjacent vertices x and y is assigned a weight
 $\omega(x, y)$
, where
 $\omega:V\times V\rightarrow [0, \infty)$
is a function satisfying that
 $\omega(x, y)=\omega(y, x)$
and
 $\omega(x, y)>0$
if and only if
 $x\sim y$
. By regarding the graph as a spatial domain, we extend some concepts from continuous spaces to finite weighted graphs. Define the degree of x as follows:
 \begin{equation}D_\omega (x): = \sum_{y\sim x, y\in V} \omega (x, y),\end{equation}
and the graph Laplacian operator by
 \begin{equation}\Delta_{\omega}f(x): = \sum_{y\sim x, y\in V} (f(y)-f(x))\omega(x, y),\end{equation}
where
 $f: V\rightarrow \mathbb{R}$
. For differential equations with graph Laplacian operators, various methods and techniques have been developed to study the existence and qualitative properties of solutions (Bauer et al. [Reference Bauer, Horn, Lin, Lippner, Mangoubi and Yau2], Chung et al. [Reference Chung and Choi3, Reference Chung, Lee and Chung4], Du et al. [Reference Du, Lou, Peng and Zhou5], Grigoryan et al. [Reference Grigoryan, Lin and Yang7, Reference Grigoryan, Lin and Yang8], Li and Shuai [Reference Li and Shuai12], Tian and Ruan [Reference Tian and Ruan23], Zhang et al. [Reference Zhang, Small, Fu, Sun and Wang27]).
In this paper we consider a susceptible-exposed-infectious-recovered (SEIR) epidemic model defined on a finite weighted graph:
 \begin{align}&\frac{\partial S}{\partial t}- d_1\Delta_\omega S=\Lambda-\beta SI-\mu_S S, (x, t)\in V\times (0, \infty), \nonumber \\
&\frac{\partial E}{\partial t}- d_2\Delta_\omega E=\beta SI-\alpha_E E-\mu_E E, (x, t)\in V\times (0, \infty), \nonumber \\
&\frac{\partial I}{\partial t}- d_3\Delta_\omega I= \alpha_E E- \mu_I I-\gamma_I I, (x, t)\in V\times (0, \infty), \nonumber \\
&\frac{\partial R}{\partial t}- d_4\Delta_\omega R= \gamma_I I-\mu_R R, (x, t)\in V\times (0, \infty), \nonumber \\
&S(x, 0)=S_0(x), \; E(x, 0)=E_0(x), \; I(x, 0)=I_0(x), \; R(x, 0)= R_0(x), x\in V,\end{align}
where
 $S(x, t), E(x, t), I(x, t)$
and R(x, t) represent the population densities of susceptible, exposed, infectious and recovered individuals at vertex
 $x \in V$
and time t, respectively.
 $\Delta_\omega$
is the graph Laplacian operator defined in (1.2) and
 $d_i (i=1, 2, 3, 4)$
are the diffusion rates of the four subpopulations, respectively, among vertices.
 $\Lambda$
denotes the recruitment rate of the susceptible class, and
 $\beta$
is the transmission rate between susceptible and infectious populations.
 $\mu_S$
,
 $\mu_E$
,
 $\mu_I$
and
 $\mu_R$
are the natural death rates of the corresponding populations S, E, I and R, respectively.
 $\alpha_E$
is the progression ratio from exposed class to infectious class.
 $\gamma_I$
is the recover/removal rate of infectious individuals. A well-mixed SEIR epidemic model possesses a globally asymptotically stable disease-free equilibrium if the basic reproduction number is less than one and a globally asymptotically stable endemic equilibrium (EE) if the basic reproduction number is greater than one (see, for example, Martcheva [Reference Martcheva15]). Our main goal here is to study the effect of the graph Laplacian operator on the global dynamics of system (1.3).
The rest of the article is organized as follows. In Section 2, we prove the global existence and uniqueness of solutions to system (1.3). In Section 3, we investigate the globally asymptotical stability of disease-free and endemic equilibria of the system. In Section 4, we carry out numerical simulations to confirm our analytical findings and illustrate the small-time dynamical behaviour. Discussion and conclusions are given in Section 5.
2 Existence and uniqueness
We use the method of coupled upper and lower solutions to establish the existence of solutions to system (1.3). The method of coupled upper and lower solutions was introduced by Pao [Reference Pao17] to deal with reaction-diffusion systems. We extend the method to treat the graph Laplacian diffusion system (1.3). By using the right-hand side of (1.3) as fixed functions (i.e. the coupled upper and lower solutions), we build two monotone function sequences and show that the sequence converges to the solution of the reaction-diffusion system associated with (1.3) is monotone. The regularity of the spatial variable is guaranteed by the dominated convergence theorem.
For the sake of simplicity, throughout this paper we denote
 \begin{eqnarray}\mathbf{f}(\mathbf{u})=(f_1(u_1, u_2, u_3, u_4),\ f_2(u_1, u_2, u_3, u_4),\ f_3(u_1, u_2, u_3, u_4),\ f_4(u_1, u_2, u_3, u_4)),\end{eqnarray}
here
 \begin{align} f_1(u_1, u_2, u_3, u_4)&=\Lambda-\beta u_1u_3-\mu_S u_1,\nonumber\\ f_2(u_1, u_2, u_3, u_4)&=\beta u_1u_3-\alpha_E u_2-\mu_E u_2,\nonumber\\ f_3(u_1, u_2, u_3, u_4)&=\alpha_E u_2- \mu_I u_3-\gamma_I u_3,\nonumber\\ f_4(u_1, u_2, u_3, u_4)&=\gamma_I u_3-\mu_R u_4.\end{align}
Definition 2.1. Suppose that
 $\tilde u_i(x, \cdot), {\mathop{{u}}\limits_{\widetilde{}}} {}_{i}(x, \cdot)\in C[0, T] (i=1, \cdots, 4)$
are differentiable in (0, T] for each
 $x\in V$
. A pair of functions
 $\tilde{\bf u}=\left(\tilde u_1, \tilde u_2, \tilde u_3, \tilde u_4\right), {\mathop{\mathbf{u}}\limits_{\widetilde{}}}=({\mathop{{u}}\limits_{\widetilde{}}} {}_{1}, {\mathop{{u}}\limits_{\widetilde{}}} {}_{2}, {\mathop{{u}}\limits_{\widetilde{}}} {}_{3}, {\mathop{{u}}\limits_{\widetilde{}}} {}_{4})$
are called coupled upper and lower solutions of system (1.3) if
 $\tilde{\bf u}\geq {\mathop{\mathbf{u}}\limits_{\widetilde{}}} \geq \mathbf{0}$
and satisfy
 \begin{align}&\frac{\partial \tilde u_1}{\partial t}-d_1\Delta_\omega \tilde u_1\geq f_1(\tilde u_1, {\mathop{{u}}\limits_{\widetilde{}}} {}_{3}),\ (x, t)\in V\times (0, T], \nonumber\\
&\frac{\partial \tilde u_2}{\partial t}-d_2\Delta_\omega \tilde u_2\geq f_2(\tilde u_1, \tilde u_2, \tilde u_3),\ (x, t)\in V\times (0, T], \nonumber
\end{align}
 \begin{align}
&\frac{\partial \tilde u_3}{\partial t}-d_3\Delta_\omega \tilde u_3\geq f_3(\tilde u_2, \tilde u_3),\ (x, t)\in V\times (0, T], \nonumber\\[2pt]
&\frac{\partial \tilde u_4}{\partial t}-d_4\Delta_\omega \tilde u_4\geq f_4(\tilde u_3, \tilde u_4),\ (x, t)\in V\times (0, T], \nonumber \\[2pt]
&\frac{\partial {\mathop{{u}}\limits_{\widetilde{}}} {}_{1}}{\partial t}-d_1\Delta_\omega {\mathop{{u}}\limits_{\widetilde{}}} {}_{1}\leq f_1({\mathop{{u}}\limits_{\widetilde{}}} {}_{1}, \tilde u_3),\ (x, t)\in V\times (0, T], \nonumber\\[2pt]
&\frac{\partial {\mathop{{u}}\limits_{\widetilde{}}} {}_{2}}{\partial t}-d_2\Delta_\omega {\mathop{{u}}\limits_{\widetilde{}}} {}_{2}\leq f_2({\mathop{{u}}\limits_{\widetilde{}}} {}_{1}, {\mathop{{u}}\limits_{\widetilde{}}} {}_{2}, {\mathop{{u}}\limits_{\widetilde{}}} {}_{3}),\ (x, t)\in V\times (0, T], \nonumber\\[2pt]
&\frac{\partial {\mathop{{u}}\limits_{\widetilde{}}} {}_{3}}{\partial t}-d_3\Delta_\omega {\mathop{{u}}\limits_{\widetilde{}}} {}_{3}\leq f_3({\mathop{{u}}\limits_{\widetilde{}}} {}_{2}, {\mathop{{u}}\limits_{\widetilde{}}} {}_{3}),\ (x, t)\in V\times (0, T], \nonumber\\[2pt]
&\frac{\partial {\mathop{{u}}\limits_{\widetilde{}}} {}_{4}}{\partial t}-d_4\Delta_\omega {{\mathop{{u}}\limits_{\widetilde{}}}}\leq f_4({\mathop{{u}}\limits_{\widetilde{}}} {}_{3}, {\mathop{{u}}\limits_{\widetilde{}}} {}_{4}),\ (x, t)\in V\times (0, T], \nonumber\\[2pt]
&\tilde u_i(x, 0)\geq u_{i0}(x), {\mathop{{u}}\limits_{\widetilde{}}} {}_{i}(x, 0)\leq u_{i0}(x) \mbox{ for }i=1,\cdots,4, x\in V.\end{align}
Here we define an order on
 $\mathbb{R}^4$
by
 $\tilde{\bf u}\geq {\mathop{\mathbf{u}}\limits_{\widetilde{}}}$
if for any index i the inequality
 $\tilde u_i\geq {\mathop{{u}}\limits_{\widetilde{}}} {}_{i}$
is satisfied.
For a given pair of coupled upper and lower solutions
 $\tilde{\bf u}$
and
 $ {\mathop{\mathbf{u}}\limits_{\widetilde{}}},$
set
 \begin{eqnarray}\Pi_i\equiv\{u_i(x, \cdot)\in C[0, T]:{\mathop{{u}}\limits_{\widetilde{}}} {}_{i}\leq u\leq\tilde u_i\},\quad\Pi\equiv\{\mathbf{u}: {\mathop{\mathbf{u}}\limits_{\widetilde{}}} \leq \mathbf{u}\leq \tilde{\bf u}\}.\end{eqnarray}
There exist constants
 $K_i (i=1,\cdots, 4)$
such that
 \begin{eqnarray}K_i u_i+\frac{\partial f_i}{\partial u_i}(\mathbf{u})\geq 0 \texttt{ for }\mathbf{u}\in \Pi.\end{eqnarray}
In fact, as for system (1.3) it suffices to choose some
 $K_i$
satisfying
 \begin{eqnarray}K_1=\mu_S+\beta||\tilde u_3||_\infty, K_2=\alpha_E+\mu_E, K_3=\mu_I+\gamma_I, K_4=\mu_R.\end{eqnarray}
For each
 $i=1, \cdots, 4$
, define
 \begin{eqnarray}F_i(u_1, u_2, u_3, u_4)=K_iu_i+f_i(u_1, u_2, u_3, u_4).\end{eqnarray}
Consider the system
 \begin{align}&\frac{\partial u_i}{\partial t}- d_i\Delta_\omega u_i+K_i u_i=F_i(u_1, u_2, u_3, u_4), i=1,\cdots,4, (x, t)\in V\times (0, T], \nonumber\\
& u_i(x, 0)=u_{i0}(x), i=1,\cdots,4, x\in V.\end{align}
Then system (2.8) is equivalent to system (1.3) in a finite time interval. To build the iterative sequence, we need to give the local existence theorem and maximum principles of the graph Laplacian equations. The proofs of the following five lemmas are given in Appendix.
Lemma 2.2 (Local Existence). Suppose that
 $d (>0)$
is a constant and K(x) and f(x) are bounded functions in V. Then there exists some small
 $T>0$
such that the system
 \begin{align}&\frac{\partial u}{\partial t}-d\Delta_\omega u+K(x) u= f(x), (x, t)\in V\times (0, T], \nonumber\\
&u(x, 0)= u_0(x), x\in V\end{align}
admits a unique local solution for
 $t\in (0, T]$
.
Lemma 2.3 (Maximum Principle). Suppose that
 $d (>0)$
is a constant and K(x, t) is a bounded function in
 $V\times (0, T]$
. If u(x, t) is continuously differentiable with respect to t on
 $V\times [0, T]$
and satisfies
 \begin{align}&\frac{\partial u}{\partial t}-d\Delta_\omega u+K u\geq 0, (x, t)\in V\times (0, T], \nonumber\\
&u(x, 0)\geq 0, x\in V,\end{align}
then
 $u(x, t)\geq 0$
on
 $V\times [0, T]$
.
Lemma 2.4 (Strong Maximum Principle). Suppose that
 $d (>0)$
is a constant and K(x, t) is a bounded function on
 $V\times (0, T]$
. Assume that u(x, t) is continuously differentiable with respect to t on
 $V\times [0, T]$
and satisfies (2.10). If
 $u(x^*, 0)>0$
for some
 $x^*\in V$
, then
 $u(x, t)>0$
on
 $V\times (0, T]$
.
Lemma 2.5. Suppose that
 $d_i (>0)$
are constants and
 $K_{ij}(x, t)(i, j=1, \cdots, m)$
are bounded functions on
 $V\times [0, T]$
,
 $K_{ij}(x, t)\leq 0$
for
 $i\neq j$
. If
 $u_i(x, t)$
for
 $i=1, \cdots, m$
are continuously differentiable with respect to t on
 $V\times [0, T]$
and further satisfy
 \begin{align}&\frac{\partial u_i}{\partial t}-d_i\Delta_\omega u_i+K_{ii} u_i +\sum_{j=1, j\neq i}^m K_{ij} u_j> 0 \mbox{ for }i=1, \cdots, m, (x, t)\in V\times (0, T],\nonumber\\
&u_i(x, 0)> 0 \mbox{ for }i=1, \cdots, m, x\in V,\end{align}
then for
 $i=1, \cdots, m$
,
 $u_i(x, t)>0$
on
 $V\times (0, T]$
.
Lemma 2.6. Suppose that
 $d_i (>0)$
are constants and
 $K_{ij}(x, t)(i, j=1, \cdots, m)$
are bounded functions on
 $V\times [0, T]$
,
 $K_{ij}(x, t)\leq 0$
for
 $i\neq j$
. If
 $u_i(x, t)$
for
 $i=1, \cdots, m$
are continuously differentiable with respect to t on
 $V\times [0, T]$
and further satisfy
 \begin{align}&\frac{\partial u_i}{\partial t}-d_i\Delta_\omega u_i+K_{ii} u_i +\sum_{j=1, j\neq i}^m K_{ij} u_j\geq0 \mbox{ for }i=1, \cdots, m, (x, t)\in V\times (0, T], \nonumber\\
&u_i(x, 0)\geq 0 \mbox{ for }i=1, \cdots, m, x\in V,\end{align}
then for
 $i=1, \cdots, m$
,
 $u_i(x, t)\geq 0$
in
 $V\times [0, T]$
. Moreover, if
 $u_i(x, 0)\not\equiv0$
, then
 $u_i(x, t)> 0$
on
 $V\times [0, T]$
.
By using
 $\mathbf{\underline u}^{(0)}= {\mathop{\mathbf{u}}\limits_{\widetilde{}}}$
and
 $\mathbf{\overline u}^{(0)}=\tilde{\bf u}$
as the initial iterations, we can construct sequences
 $\left\{\mathbf{\overline u}^{(m)}\right\}_{m=1}^\infty$
and
 $\left\{\mathbf{\underline u}^{(m)}\right\}_{m=1}^\infty$
from the iteration process of scalar equations:
 \begin{align}&\frac{\partial \overline u_1^{(m)}}{\partial t}- d_1\Delta_\omega \overline u_1^{(m)}+K_1 \overline u_1^{(m)}=F_1\!\left(\overline u_1^{(m-1)}, \underline u_3^{(m-1)}\right), (x, t)\in V\times (0, T], \nonumber\\[3pt]
&\frac{\partial \overline u_2^{(m)}}{\partial t}- d_2\Delta_\omega \overline u_2^{(m)}+K_2 \overline u_2^{(m)}=F_2\!\left(\overline u_1^{(m-1)}, \overline u_2^{(m-1)}, \overline u_3^{(m-1)}\right), (x, t)\in V\times (0, T], \nonumber\\[3pt]
&\frac{\partial \overline u_3^{(m)}}{\partial t}- d_3\Delta_\omega \overline u_3^{(m)}+K_3 \overline u_3^{(m)}=F_3\!\left(\overline u_2^{(m-1)}, \overline u_3^{(m-1)}\right), (x, t)\in V\times (0, T], \nonumber\\[3pt]
&\frac{\partial \overline u_4^{(m)}}{\partial t}- d_4\Delta_\omega \overline u_4^{(m)}+K_4 \overline u_4^{(m)}=F_4\!\left(\overline u_3^{(m-1)}, \overline u_4^{(m-1)}\right), (x, t)\in V\times (0, T], \nonumber\\[3pt]
&\frac{\partial \underline u_1^{(m)}}{\partial t}- d_1\Delta_\omega \underline u_1^{(m)}+K_1 \underline u_1^{(m)}=F_1\!\left( \underline u_1^{(m-1)}, \overline u_3^{(m-1)}\right),(x, t)\in V\times (0, T], \nonumber \\[3pt]
&\frac{\partial \underline u_2^{(m)}}{\partial t}- d_2\Delta_\omega \underline u_2^{(m)}+K_2 \underline u_2^{(m)}=F_2\!\left(\underline u_1^{(m-1)}, \underline u_2^{(m-1)}, \underline u_3^{(m-1)}\right),(x, t)\in V\times (0, T], \nonumber\\[3pt]
&\frac{\partial \underline u_3^{(m)}}{\partial t}- d_3\Delta_\omega \underline u_3^{(m)}+K_3 \underline u_3^{(m)}=F_3\!\left(\underline u_2^{(m-1)}, \underline u_3^{(m-1)}\right),(x, t)\in V\times (0, T], \nonumber\\[3pt]
&\frac{\partial \underline u_4^{(m)}}{\partial t}- d_4\Delta_\omega \underline u_4^{(m)}+K_4 \underline u_4^{(m)}=F_4\!\left(\underline u_3^{(m-1)}, \underline u_4^{(m-1)}\right),(x, t)\in V\times (0, T], \nonumber\\[3pt]
&\overline u_i^{(m)}(x, 0)=\underline u_i^{(m)}(x, 0)=u_{i0}(x),\mbox{ for }i=1,\cdots,4, x\in V.\end{align}
Since system (2.13) is a scalar graph Laplacian system on network, it follows from the local existence (Lemma 2.2) that the sequences
 $\left\{\mathbf{\overline u}^{(m)}\right\}_{m=1}^\infty$
and
 $\left\{\mathbf{\underline u}^{(m)}\right\}_{m=1}^\infty$
exist and are unique for a small T. In the following, we aim to show the monotonicity property of the sequences.
Lemma 2.7. The sequences
 $\left\{\mathbf{\overline u}^{(m)}\right\}_{m=1}^\infty$
and
 $\left\{\mathbf{\underline u}^{(m)}\right\}_{m=1}^\infty$
governed by (2.13) possess the monotonicity property
 \begin{eqnarray} {\mathop{\mathbf{u}}\limits_{\widetilde{}}} \leq\mathbf{\underline u^{(m)}}\leq \mathbf{\underline u^{(m+1)}}\leq\mathbf{\overline u^{(m+1)}}\leq\mathbf{\overline u^{(m)}}\leq \tilde{\bf u}\mbox{ for }m=1,2,\cdots\end{eqnarray}
for
 $(x, t)\in V\times [0, T]$
. Moreover, for each
 $m=1,2,\cdots$
,
 $\mathbf{\overline u^{(m)}}$
and
 $\mathbf{\underline u^{(m)}}$
are coupled upper and lower solutions of (1.3).
Proof Notice that (2.13) is a monotone dynamical system (Smith [Reference Smith21]). Our method is to use the maximum principle for graph Laplacian.
Let
 $\underline w_i^{(1)}=\underline u_i^{(1)}-\underline u_i^{(0)}$
,
 $i=1, \cdots, 4$
. Then by (2.3) and (2.13), for
 $(x, t)\in V\times(0, T]$
,
 $\underline w_1^{(1)}$
satisfies
 \begin{align}\frac{\partial \underline w_1^{(1)}}{\partial t}- d_1\Delta_\omega \underline w_1^{(1)}+K_1 \underline w_1^{(1)} &= F_1\!\left( {\underline u}_1^{(0)}, {\overline u}_3^{(0)}\right) -\left(\frac{\partial \underline u_1^{(0)} }{\partial t}- d_1\Delta_\omega \underline u_1^{(0)} +K_1 \underline u_1^{(0)} \right)\nonumber \\
&= K_1{\mathop{{u}}\limits_{\widetilde{}}} {}_{1}+f_1( {\mathop{{u}}\limits_{\widetilde{}}} {}_{1}, \tilde u_3) - \left(\frac{\partial {\mathop{{u}}\limits_{\widetilde{}}} {}_{1} }{\partial t}- d_1\Delta_\omega {\mathop{{u}}\limits_{\widetilde{}}} {}_{1} +K_1 {\mathop{{u}}\limits_{\widetilde{}}} {}_{1}\right).\end{align}
Meanwhile
 $\underline w_1^{(1)}(x, 0)=0$
for
 $x\in V$
. By the maximum principle (Lemma 2.3),
 $\underline w^{(1)}_1(x, t)\geq0$
for
 $(x, t)\in V\times[0, T]$
. Therefore,
 $\underline u_1^{(0)}(x, t)\leq \underline u_1^{(1)}(x, t)$
for
 $(x, t)\in V\times[0, T]$
. A similar argument yields
 $\underline u_i^{(0)}(x, t)\leq \underline u_i^{(1)}(x, t)$
for
 $(x, t)\in V\times[0, T]$
and
 $i=2, 3, 4$
. Thus, we have
 \begin{eqnarray}\mathbf{\underline u^{(0)}}(x, t)\leq \mathbf{\underline u^{(1)}}(x, t)\mbox{ for } (x, t)\in V\times[0, T].\end{eqnarray}
On the other hand, we have
 \begin{eqnarray}\mathbf{\overline u^{(0)}}(x, t)\geq \mathbf{\overline u^{(1)}}(x, t)\mbox{ for } (x, t)\in V\times[0, T].\end{eqnarray}
Moreover, letting
 $z^{(1)}_i=\overline u^{(1)}_i-\underline u^{(1)}_i$
, it follows from (2.13) that for
 $(x, t)\in V\times(0, T]$
,
 \begin{align}\frac{\partial z_1^{(1)}}{\partial t}- d_1\Delta_\omega z_1^{(1)}+K_1 z_1^{(1)}&=F_1\!\left({\overline u}_1^{(0)}, {\underline u}_3^{(0)}\right)-F_1\!\left( {\underline u}_1^{(0)}, {\overline u}_3^{(0)}\right)\nonumber\\
&\geq F_1\!\left({\overline u}_1^{(0)}, {\underline u}_3^{(0)}\right)-F_1\!\left( {\underline u}_1^{(0)}, {\underline u}_3^{(0)}\right)\nonumber\\
&= K_1z_1^{(1)} +\frac{\partial f_1}{\partial u_1}\left( {\xi^{(0)}}, {\underline u}_3^{(0)}\right)z_1^{(1)}\geq 0,\end{align}
where
 $ {\xi^{(0)}}(x, t)$
is some intermediate value between
 $\underline u_1^{(0)}$
and
 $\overline u_1^{(0)}$
. It follows again from the maximum principle (Lemma 2.3) that
 ${\overline u}_1^{(1)}\geq{\underline u}_1^{(1)},$
and thus,
 \begin{eqnarray}\mathbf{\overline u}^{(1)}(x, t)\geq\mathbf{\underline u}^{(1)}(x, t) \mbox{ for } (x, t)\in V\times[0, T].\end{eqnarray}
The above conclusions (2.16), (2.17) and (2.19) show that
 \begin{eqnarray} \mathbf{\underline u}^{(0)}\leq \mathbf{\underline u}^{(1)}\leq\mathbf{\overline u}^{(1)}\leq\mathbf{\overline u}^{(0)}.\end{eqnarray}
In the following, we show that
 $\mathbf{\overline u}^{(1)}$
and
 $\mathbf{\underline u}^{(1)}$
are coupled upper and lower solutions of (1.3). It suffices to show that
 $\mathbf{\overline u}^{(1)}$
and
 $\mathbf{\underline u}^{(1)}$
satisfy (2.3). By (2.13) and (2.20), for
 $(x, t)\in V\times(0, T]$
, we have
 \begin{align}\frac{\partial \overline u_1^{(1)}}{\partial t}- d_1\Delta_\omega \overline u_1^{(1)}+K_1 \overline u_1^{(1)}&=F_1\!\left( {\overline u}_1^{(0)}, {\underline u}_3^{(0)}\right)\geq F_1\!\left( {\overline u}_1^{(0)}, {\underline u}_3^{(1)}\right)\nonumber\\
&=F_1\!\left( {\overline u}_1^{(1)}, {\underline u}_3^{(1)}\right)+\left(F_1\!\left( {\overline u}_1^{(0)}, {\underline u}_3^{(1)}\right)-F_1\!\left( {\overline u}_1^{(1)}, {\underline u}_3^{(1)}\right)\right)\nonumber\\
&=F_1\!\left( {\overline u}_1^{(1)}, {\underline u}_3^{(1)}\right)+K_1\!\left({\overline u}_1^{(0)}- {\overline u}_1^{(1)}\right)+\frac{\partial f_1}{\partial u_1}\!\left( {\xi^{(1)}}, {\underline u}_3^{(1)}\right)\left({\overline u}_1^{(0)}- {\overline u}_1^{(1)}\right)\nonumber\\
&\geq F_1\!\left( {\overline u}_1^{(1)}, {\underline u}_3^{(1)}\right),\end{align}
where
 $ {\xi^{(1)}}(x, t)$
is some intermediate value between
 $\overline u_1^{(1)}$
and
 $\overline u_1^{(0)}$
. By applying the above argument to
 $\underline u_1^{(1)}$
and the other components, it follows that
 $\mathbf{\overline u}^{(1)}$
and
 $\mathbf{\underline u}^{(1)}$
satisfy (2.3).
Next, we use an induction method. By choosing
 $\mathbf{\overline u}^{(1)}$
and
 $\mathbf{\underline u}^{(1)}$
as a couple of coupled upper and lower solutions
 ${\tilde{\mathbf{u}}}$
and
 ${{{\mathop{{u}}\limits_{\widetilde{}}}}}$
and following a similar argument as above, we have
 \begin{eqnarray}\mathbf{\underline u}^{(1)}\leq \mathbf{\underline u}^{(2)}\leq\mathbf{\overline u}^{(2)}\leq\mathbf{\overline u}^{(1)}.\end{eqnarray}
So
 $\mathbf{\overline u}^{(2)}$
and
 $\mathbf{\underline u}^{(2)}$
are also a pair of coupled upper and lower solutions of (1.3). The conclusion of the lemma follows from the induction principle.
In view of Lemma 2.7, the pointwise limits
 \begin{eqnarray}\lim_{m\rightarrow\infty}\mathbf{\overline u^{(m)}}=\mathbf{\overline u},\quad\lim_{m\rightarrow\infty}\mathbf{\underline u^{(m)}}=\mathbf{\underline u}\end{eqnarray}
exist for
 $(x, t)\in V\times (0, T]$
. In the following theorem, we show the local existence of solutions to system (2.8).
Theorem 2.8. Let
 $\tilde{\bf u}$
and
 ${\mathop{\mathbf{u}}\limits_{\widetilde{}}}$
be a pair of coupled upper and lower solutions of system (1.3) that are bounded on
 $V\times (0, T]$
. Let
 $(\overline u_1, \overline u_2, \overline u_3, \overline u_4)$
and
 $(\underline u_1, \underline u_2, \underline u_3, \underline u_4)$
be given by (2.23). Then
 $\mathbf{\underline u}= \mathbf{\overline u} \; (\equiv \mathbf{u^*})$
and
 $\mathbf{u^*}$
is a unique solution of system (2.8) for
 $t\in (0, T]$
.
Proof By fixing any
 $x\in V$
, we can regard (2.13) as the differential equation with respect to t. Hence, for
 $(x, t)\in V\times (0, T]$
we have
 \begin{align} \overline u_1^{(m)}(x, t)&= u_{10}(x)+ \int_0^t \left(d_1\Delta_\omega \overline u_1^{(m)}-K_1 \overline u_1^{(m)}+F_1\!\left(\overline u_1^{(m-1)}, \underline u_3^{(m-1)}\right)\right)ds, \nonumber \\
\underline u_1^{(m)}(x, t)&= u_{10}(x)+ \int_0^t \left(d_1\Delta_\omega \underline u_1^{(m)}-K_1 \underline u_1^{(m)}+F_1\!\left(\underline u_1^{(m-1)}, \overline u_3^{(m-1)}\right)\right)ds.\end{align}
Since
 ${\mathop{{u}}\limits_{\widetilde{}}} {}_{i}\leq\overline u_i^{(m)}\leq \tilde u_i$
for
 $(x, t)\in V\times [0, T]$
, the dominated convergence theorem implies that for
 $t\in [0, T]$
the limits
 $\overline u_1(x, t)$
and
 $\underline u_1(x, t)$
satisfy the relations
 \begin{align}\overline u_1(x, t)&= u_{10}(x)+ \int_0^t \left(d_1\Delta_\omega \overline u_1-K_1 \overline u_1+F_1\!\left(\overline u_1, \underline u_3\right)\right)ds, \nonumber \\
\underline u_1(x, t)&= u_{10}(x)+ \int_0^t \left(d_1\Delta_\omega \underline u_1-K_1 \underline u_1+F_1\!\left(\underline u_1, \overline u_3\right)\right)ds.\end{align}
In view of (2.25), we have
 \begin{align}\overline u_1-\underline u_1&= \int_0^t\left(d_1\Delta_\omega \left(\overline u_1-\underline u_1\right)-K_1 \!\left(\overline u_1-\underline u_1\right)+F_1\!\left(\overline u_1, \underline u_3\right)-F_1\!\left(\underline u_1, \overline u_3\right)\right)ds\nonumber\\
&= t\left|\left|d_1\Delta_\omega \left(\overline u_1-\underline u_1\right)-K_1 \!\left(\overline u_1-\underline u_1\right)+F_1\!\left(\overline u_1, \underline u_3\right)-F_1\!\left(\underline u_1, \overline u_3\right)\right|\right|_\infty.\end{align}
Next, we show the boundedness of (2.26). By the definition of (1.2), we have
 \begin{eqnarray}\Delta_\omega \!\left(\overline u_1-\underline u_1\right)\leq 2n\max_{x\in V} D_\omega (x)||\overline u_1-\underline u_1||_\infty,\end{eqnarray}
where n is the number of vertices of the graph. Moreover,
 \begin{align}\left|F_1\!\left(\overline u_1, \underline u_3\right)-F_1\!\left(\underline u_1, \overline u_3\right)\right|=\left(K_1+\left|\left|\frac{\partial f_1}{\partial u_1}\right|\right|_\infty\right)||\overline u_1-\underline u_1||_\infty+\left|\left|\frac{\partial f_1}{\partial u_3}\right|\right|_\infty||\overline u_3-\underline u_3||_\infty.\end{align}
By plugging (2.27) and (2.28) into (2.26), we have
 \begin{eqnarray}||\overline u_1-\underline u_1||_\infty\leq tC_1\!\left(||\overline u_1-\underline u_1||_\infty+||\overline u_3-\underline u_3||_\infty\right),\end{eqnarray}
where
 $C_1$
only depends on
 $K_1$
,
 $d_1$
, n,
 $\max_{x\in V} D_\omega (x)$
,
 $\left|\left|\frac{\partial f_1}{\partial u_1}\right|\right|_\infty$
and
 $\left|\left|\frac{\partial f_1}{\partial u_3}\right|\right|_\infty$
.
Likewise, using a similar argument, we can obtain that
 \begin{eqnarray}\left|\left|\overline u_i-\underline u_i\right|\right|_\infty\leq tC_i\sum_{j=1}^4\left|\left|\overline u_j-\underline u_j\right|\right|_\infty,\end{eqnarray}
where
 $C_i$
only depends on
 $K_i$
,
 $d_i$
, n,
 $\max_{x\in V} D_\omega (x)$
and
 $\left|\left|\frac{\partial f_i}{\partial u_i}\right|\right|_\infty$
. It follows from (2.30) that
 \begin{eqnarray}\sum_{i=1}^4\left|\left|\overline u_i-\underline u_i\right|\right|_\infty\leq t(C_1+C_2+C_3+C_4)\sum_{i=1}^4\left|\left|\overline u_i-\underline u_i\right|\right|_\infty.\end{eqnarray}
Thus, there exists a constant
 $T_0:=\min\{(C_1+C_2+C_3+C_4)/2, T\}$
such that
 $\sum_{i=1}^4||\overline u_i-$
 $\underline u_i||_\infty=0$
; that is, for
 $i=1, \cdots, 4$
,
 $\overline u_i\equiv \underline u_i$
holds for
 $t\in (0, T_0]$
. Owing to the fact that the above
 $C_i$
does not depend on the initial value,
 $T_0$
can be extended to time T. This completes the proof.
We extend the local solution obtained in Theorem 2.8 to the maximal time. To do so, we need the following a priori estimate and some comparison principle.
Lemma 2.9. Suppose that for each
 $x\in V$
,
 $w(x, \cdot)\in C([0, \infty))$
is differentiable on
 $(0, \infty)$
. Assume that
 \begin{eqnarray}d>0, \alpha>0, \beta>0\end{eqnarray}
are constants. If w satisfies
 \begin{align}&\frac{\partial w}{\partial t}-d\Delta_\omega w\geq(\leq)\, \alpha-\beta w, (x, t)\in V\times (0, +\infty), \nonumber\\
&w(x, 0)=w_{0}(x)\geq0 \mbox{ and }w_{0}(x)\not\equiv 0, x\in V\end{align}
or
 \begin{align}&\frac{\partial w}{\partial t}-d\Delta_\omega w\geq(\leq)\, w(\alpha-\beta w), (x, t)\in V\times (0, +\infty), \nonumber\\
&w(x, 0)=w_{0}(x)\geq0 \mbox{ and }w_{0}(x)\not\equiv 0, x\in V,\end{align}
then
 \begin{eqnarray}&& \liminf_{t\rightarrow\infty} w(x,t)\geq \frac{\alpha}{\beta} \!\left(\limsup_{t\rightarrow\infty}w(x,t)\leq \frac{\alpha}{\beta}\right) \mbox{ on } x\in V.\end{eqnarray}
Moreover, for any given
 $\varepsilon>0$
, there exists a
 $t_\varepsilon>0$
such that
 \begin{eqnarray}w(x,t)>\frac{\alpha}{\beta}-\varepsilon \!\left(w(x,t)<\frac{\alpha}{\beta}+\varepsilon\right) \mbox{ for }(x,t)\in V\times [t_\varepsilon, +\infty).\end{eqnarray}
Proof We only show the case of (2.33) and the case of (2.34) can be proved in a similar routine. We first show that solutions of the following scalar equation converge to
 $\frac{\alpha}{\beta}$
on
 $x\in V$
:
 \begin{align}&\frac{\partial z}{\partial t}-d\Delta_\omega z = \alpha-\beta z, (x, t)\in V\times (0, \infty), \nonumber\\
&z(x, 0)=w_{0}(x)\not\equiv 0, x\in V.\end{align}
Since
 $w_{0}(x)\not\equiv 0$
for
 $x\in V$
, the strong maximum principle (Lemma 2.4) implies that
 $z(x, t)>0$
for
 $(x, t)\in V\times(0,\infty)$
. For any small
 $t_1>0$
, we set
 $\delta=\min_{x\in V} z(x, t_1)$
, then
 $\delta>0$
. Consider
 $\underline z(x, t)$
which satisfies the following equation:
 \begin{align}&\frac{d \underline z}{d t} =\underline \alpha-\beta\underline z, x\in V, t\in (t_1, +\infty), \nonumber\\
&\underline z(x, t_1)=\delta, x\in V.\end{align}
Since V is finite, we have
 \begin{eqnarray}\lim_{t\rightarrow\infty}\underline z(x, t)=\frac{\alpha}{\beta} \mbox{ on } x\in V.\end{eqnarray}
Moreover, owing to (1.2), we have
 $\Delta_\omega\underline z(x, t)=\sum_{y\sim x}\omega_{xy}(\underline z(y, t)-\underline z(x, t))\equiv 0$
. Hence,
 $\underline z$
is a lower solution of system (2.37) with
 $t\in[t_1, \infty)$
. The maximum principle implies that
 $z(x, t)\geq \underline z(x, t)$
for
 $(x, t)\in V\times [t_1, \infty)$
. Combining with (2.39), we obtain
 \begin{eqnarray}&& \liminf_{t\rightarrow\infty} z(x,t)\geq \frac{\alpha}{\beta} \mbox{ on } x\in V.\end{eqnarray}
On the other hand, after a similar argument, we have
 \begin{eqnarray}&& \limsup_{t\rightarrow\infty} z(x,t)\leq \frac{\alpha}{\beta} \mbox{ on } x\in V.\end{eqnarray}
Combining (2.40) and (2.41), we deduce that
 \begin{eqnarray}&& \lim_{t\rightarrow\infty} z(x,t)= \frac{\alpha}{\beta} \mbox{ on } x\in V.\end{eqnarray}
Since w satisfies (2.33), the maximum principle (Lemma 2.4) implies
 $w(x, t)\geq z(x, t)$
for
 $(x, t)\in V\times [0, \infty)$
. It follows from (2.42) that (2.35) holds, which immediately induces (2.36).
In the above proof, when
 $\alpha\leq 0$
the limit in (2.42) is 0. Thus, we obtain the following lemma.
Lemma 2.10. Suppose that for each
 $x\in V$
,
 $w(x, \cdot)\in C([0, \infty))$
is differentiable on
 $(0, \infty)$
. Assume that
 \begin{eqnarray}d>0, \alpha\leq0, \beta>0\end{eqnarray}
are constants. If w satisfies
 \begin{align}&\frac{\partial w}{\partial t}-d\Delta_\omega w\leq \alpha-\beta w, (x, t)\in V\times (0, \infty), \nonumber\\
&w(x, 0)=w_{0}(x)\geq0, x\in V,\end{align}
then
 \begin{eqnarray}&& \lim_{t\rightarrow\infty} w(x,t)= 0 \mbox{ on } x\in V.\end{eqnarray}
Lemma 2.11. Let
 $(u_1, u_2, u_3, u_4)$
be a solution to system (2.8) defined for
 $t\in (0, T]$
for some
 $T\in (0, \infty)$
. Define the basic reproduction number
 \begin{eqnarray}{\mathcal R}_0:=\frac{\beta\alpha_E\Lambda}{\mu_S(\alpha_E+\mu_E)(\gamma_I+\mu_I)}.\end{eqnarray}
Then the following statements hold:
-
(i) If
 ${\mathcal R}_0<1$
and
$ \max_{x\in V} S_0(x) \leq \frac{\Lambda}{\mu_S}$
, then for
$i=1, \cdots, 4$
, there exist a constant
$M_1$
independent of T such that
(2.47)where
\begin{eqnarray}0\leq u_i(x, t)\leq M_1 \mbox{ for } (x, t)\in V\times [0, T],\end{eqnarray}
$M_1=\max_{i=1}^4 C_i$
, and
$C_i$
is defined in (2.49);
-
(ii) If
$d_1=d_2=d_3=d_4\equiv d$
, then for
$i=1, \cdots, 4$
, there exist a constant
$M_2$
independent of T such that
(2.48)where
\begin{eqnarray}0\leq u_i(x, t)\leq M_2 \mbox{ for } (x, t)\in V\times [0, T],\end{eqnarray}
\[M_2=\max\left\{ \sum_{i=1}^4 \max_{x\in V} u_{i0}(x) , \frac{\Lambda}{\min\{\mu_S, \mu_E, \mu_I, \mu_R\}}\right\}.\]


Proof (i) We only need to construct a pair of upper and lower solutions of system (1.3). Set the lower solution
 $({\mathop{{u}}\limits_{\widetilde{}}} {}_{1}, {\mathop{{u}}\limits_{\widetilde{}}} {}_{2}, {\mathop{{u}}\limits_{\widetilde{}}} {}_{3}, {\mathop{{u}}\limits_{\widetilde{}}} {}_{4})=(0, 0, 0, 0)$
and the upper solution
 $(\tilde u_1, \tilde u_2, \tilde u_3, \tilde u_4)=(C_1, C_2, C_3, C_4)$
by choosing
 \begin{eqnarray}&& C_1= \frac{\Lambda}{\mu_S}, C_2=\max\left\{\max_{x\in V} E_0(x) , \frac{\beta \Lambda \max_{x\in V} I_0(x) }{\mu_S(\alpha_E+\mu_E)}\right\},\nonumber\\[7pt]
&& C_3=\max\left\{\max_{x\in V} I_0(x), \frac{\alpha_E C_2}{\mu_I+\gamma_I}\right\}, C_4=\max\left\{\max_{x\in V} R_0(x), \frac{\gamma_I C_3}{\mu_R}\right\}.\end{eqnarray}
If
 ${\mathcal R}_0< 1$
, it can be easily verified that
 $(\tilde u_1, \tilde u_2, \tilde u_3, \tilde u_4)=(C_1, C_2, C_3, C_4)$
and
 $({\mathop{{u}}\limits_{\widetilde{}}} {}_{1}, {\mathop{{u}}\limits_{\widetilde{}}} {}_{2}, {\mathop{{u}}\limits_{\widetilde{}}} {}_{3}, {\mathop{{u}}\limits_{\widetilde{}}} {}_{4})=(0, 0, 0, 0)$
satisfy (2.3), by using Theorem 2.8, which immediately yields that the solution of system (1.3) exists and satisfies
 $0\leq u_i(x, t)\leq C_i$
. Thus, (2.47) holds.
(ii) By directly using the maximum principle (Lemma 2.6), we obtain the positivity of the solution. In the following, we estimate the upper bound. Set
 $u=\sum_{i=1}^4 u_i$
. Then, we have
 \begin{align}& \frac{\partial u}{\partial t}- d\Delta_\omega u\leq \Lambda-\min\left\{\mu_S, \mu_E, \mu_I, \mu_R\right\}u, (x, t)\in V\times (0, T],\nonumber\\
&u(x, 0)=\sum_{i=1}^4 u_{i0}(x), x\in V.\end{align}
Choosing
 $M=\max\left\{ \sum_{i=1}^4 \max_{x\in V} u_{i0}(x), \frac{\Lambda}{\min\left\{\mu_S, \mu_E, \mu_I, \mu_R\right\}}\right\}$
, Lemma 2.9 yields that
 $u\leq M$
on
 $V\times [0, T]$
. Thanks to the positivity of the solution, we immediately obtain (2.48).
Owing to the a priori estimate of Lemma 2.11, we give the following global existence theorem.
Theorem 2.12. If
 ${\mathcal R}_0\leq 1$
and
 $ \max_{x\in V} S_0(x)\leq \frac{\Lambda}{\mu_S}$
, or if
 $d_1=d_2=d_3=d_4$
, then system (1.3) possesses an unique solution for all
 $t\in [0, \infty)$
.
3 Global stability of the disease-free and endemic equilibria
The main purpose of this section is to show the global stability of the disease-free equilibrium and EE of system (1.3). To do so, we give the following lemma.
Lemma 3.1 (Green Formula). For any functions
 $u, v: V\rightarrow \mathbb{R}$
, we have
 \begin{eqnarray} 2\sum_{x\in V}v(x)\Delta_\omega u(x)=-\sum_{x, y\in V}(u(y)-u(x))(v(y)-v(x))\omega(x,y).\end{eqnarray}
In particular, in case of
 $u=v$
, we have
 \begin{eqnarray}2\sum_{x\in V}u(x)\Delta_\omega u(x)=-\sum_{x, y\in V}\!\left(u(y)-u(x)\right)^2\omega(x,y).\end{eqnarray}
Furthermore, in case of
 $v=1$
, we have
 $\sum_{x\in V}\Delta_\omega u(x)=0$
.
Proof Notice that
 \begin{align}\sum_{x\in V}v(x)\Delta_\omega u(x)=&\sum_{x\in V}v(x)\sum_{y\sim x} \!\left(u(y)-u(x)\right)\omega(x,y)\nonumber\\
=&\sum_{x\in V}\sum_{y\sim x} v(x)\!\left(u(y)-u(x)\right)\omega(x,y)\nonumber\\
=&\sum_{x, y\in V}\sum_{y\sim x} v(x)\!\left(u(y)-u(x)\right)\omega(x,y)
\end{align}
 \begin{align}
\qquad\qquad\qquad \ \ =\sum_{x, y\in V}\sum_{y\sim x} v(y)\left(u(x)-u(y)\right)\omega(x,y).\end{align}
Combining (3.3) and (3.4), we have
 \begin{eqnarray}2\sum_{x\in V}v(x)\Delta_\omega u(x)=-\sum_{x, y\in V}(u(y)-u(x))(v(y)-v(x))\omega(x,y).\end{eqnarray}
This completes the proof.
For the disease-free equilibrium (DFE)
 $(\frac{\Lambda}{\mu_S}, 0, 0, 0)$
, we have the following results.
Theorem 3.2. Suppose that
 $\mu_S\leq\min\{\mu_E, \mu_I\}$
,
 ${\mathcal R}_0<1$
, and the initial data of system (1.3) are all nonnegative and nontrivial. Then the following statements hold:
-
(i) If
$d_1=d_2=d_3=d_4\equiv d$
, then the DFE
$\left(\frac{\Lambda}{\mu_S}, 0, 0, 0\right)$
of system (1.3) is globally asymptotically stable; -
(ii) If
$ \max_{x\in V} S_0(x)\leq \frac{\Lambda}{\mu_S}$
, then the DFE
$\left(\frac{\Lambda}{\mu_S}, 0, 0, 0\right)$
of system (1.3) is asymptotically stable.


Proof (i) Noticing that the first three equations do not depend on the fourth equation, we first show the global stability of system (1.3) with the first three equations. By defining the set
 \begin{eqnarray}\Omega:= \left\{(S, E, I)\in \mathbb{R}^3_+| S+E+I\leq\frac{\Lambda}{\mu_s}\right\},\end{eqnarray}
we first show that
 $\Omega$
is a positively compact invariant absorbing set.
In view of Lemma 2.11 and Theorem 2.12, we can extend the priori estimate from
 $t\in (0, T]$
to
 $t\in (0, \infty)$
. Thus, Lemma 2.6 can also be extended from (0, T] to
 $(0, \infty)$
by the continuation theorem. Since the initial data of system (1.3) are all nontrivial, applying the strong maximum principle (Lemma 2.6) yields that S, E and I are all positive for
 $(x, t)\in V\times(0, \infty)$
. By setting
 $u=S+E+I$
, it follows from
 $\mu_S\leq\min\{\mu_E, \mu_I\}$
that, for
 $u(x, 0) \not\equiv 0,$
 \begin{align}&\frac{\partial u}{\partial t}- d\Delta_\omega u\leq \Lambda-\mu_S u, (x, t)\in V\times (0, \infty),\nonumber\\
&u(x, 0)\geq 0, x\in V.\end{align}
Using Lemma 2.9, we obtain
 $\limsup_{t\rightarrow +\infty} u(x, t)\leq \frac{\Lambda}{\mu_S}$
for
 $x\in V$
. Hence,
 $\Omega$
is a positively compact invariant absorbing set. Then we only need to analyse stability restricted on
 $\Omega$
.
In the following, we show the global stability by constructing Liapunov functions. Define a Liapunov function
 \begin{eqnarray}L(t)=\sum_{x\in V}\left((\mu_I+\gamma_I)E+\frac{\beta\Lambda}{\mu_S}I\right).\end{eqnarray}
Then
 $L(t)\geq 0$
for all
 $t\geq 0$
, and
 $L(t)=0$
if and only if
 $(E, I)=(0, 0)$
. We can compute that
 \begin{align}L^{\prime}(t)&=\sum_{x\in V}\left((\mu_I+\gamma_I)(\beta SI-\alpha_E E-\mu_E E)+d(\mu_I+\gamma_I)\Delta_\omega E\right)\nonumber\\
& \quad +\sum_{x\in V}\left(\frac{\beta\Lambda}{\mu_S}(\alpha_E E-\mu_I I-\gamma_I I)+\frac{\beta\Lambda}{\mu_S}d\Delta_\omega I\right). \end{align}
In view of Lemma 3.1, we have
 $\sum_{x\in V}\Delta_\omega E=\sum_{x\in V}\Delta_\omega I=0$
. Since
 $S\leq \frac{\Lambda}{\mu_S}$
on
 $\Omega$
and
 ${\mathcal R}_0<1$
, we find
 \begin{eqnarray}L^{\prime}(t)=\sum_{x\in V}(\mu_I+\gamma_I)(\alpha_E+\mu_E)({\mathcal R}_0-1)E+\sum_{x\in V}\beta(\mu_I+\gamma_I)\left(S-\frac{\Lambda}{\mu_S}\right)I\leq 0.\end{eqnarray}
By applying the Liapunov–LaSalle invariance principle (Hale [Reference Hale9]), we have
 $\lim_{t\rightarrow\infty}(S, E, I)=\left(\frac{\Lambda}{\mu_S}, 0, 0\right)$
confined on
 $\Omega$
.
It remains to show
 $\lim_{t\rightarrow\infty}R(x, t)=0$
. Since
 $\lim_{t\rightarrow\infty}I(x, t)=0$
, for any
 $\varepsilon>0$
there exists
 $t_1>0$
such that
 \begin{eqnarray}I(x, t)<\varepsilon \mbox{ for }t\geq t_1, x\in V.\end{eqnarray}
Plugging the above inequality into (1.3), we find that
 \begin{align}&\frac{\partial R}{\partial t}- d\Delta_\omega R\leq \gamma_I\varepsilon-\mu_R R, (x, t)\in V\times (t_1, \infty),\nonumber\\
&R(x, t)|_{t=t_1}=R(x, t_1)\geq 0, x\in V.\end{align}
Using Lemma 2.9, we obtain
 $\limsup_{t\rightarrow\infty}R(x, t)\leq \frac{ \gamma_I}{\mu_R}\varepsilon$
. Letting
 $\varepsilon\rightarrow 0$
, we immediately get
 $R(x, t)\rightarrow 0$
for
 $x\in V$
.
(ii) Since
 $\max_{x\in V} S_0(x)\leq \frac{\Lambda}{\mu_S}$
, using Lemma 2.9 to S(x, t) yields
 $\limsup_{t\rightarrow+\infty }S(x, t)\leq \frac{\Lambda}{\mu_S}$
. As argued in (i), we construct a Liapunov function as follows:
 \begin{eqnarray}L(t)=\sum_{x\in V}\left((\mu_I+\gamma_I)E+\frac{\beta\Lambda}{\mu_S}I\right).\end{eqnarray}
We also obtain that
 \begin{eqnarray}L^{\prime}(t)=\sum_{x\in V}(\mu_I+\gamma_I)(\alpha_E+\mu_E)({\mathcal R}_0-1)E+\sum_{x\in V}\beta(\mu_I+\gamma_I)\left(S-\frac{\Lambda}{\mu_S}\right)I\leq 0\end{eqnarray}
because
 $S\leq\frac{\Lambda}{\mu_S}$
as
 $t\rightarrow +\infty$
.
Remark 3.3. For an epidemic model, the assumption
 $\mu_S\leq\min\{\mu_E, \mu_I\}$
is natural because the mortality rate of susceptible individuals is always less than or equal to that of infected and exposed individuals.
For the global stability of the EE, we have the following results.
Theorem 3.4. Suppose that
 $\mu_S\leq\min\{\mu_E, \mu_I\}$
and the initial data of system (1.3) are all nonnegative and nontrivial. If
 ${\mathcal R}_0>1$
and
 $d_1=d_2=d_3=d_4\equiv d$
, then the EE
 $(S^*, E^*, I^*, R^*)$
of system (1.3) is globally asymptotically stable. Here
 $S^*=\frac{(\alpha_E+\mu_E)(\mu_I+\gamma_I)}{\beta\alpha_E}$
,
 $I^*=\frac{\Lambda-\mu_S S^*}{\beta S^*}$
,
 $E^*=\frac{\mu_I+\gamma_I}{\alpha_E}I^*$
and
 $R^*=\frac{\gamma_I}{\mu_R}I^*$
.
Proof Using a similar argument as in the above proof, we first consider the global stability of system (1.3) with the first three equations restricted on the positively compact invariant set
 $\Omega$
. Define a Liapunov function
 \begin{eqnarray}L(t)=&&\sum_{x\in V}\left(\left(S-S^*-S^* \ln \frac{S}{S^*}\right)+\left(E-E^*-E^* \ln \frac{E}{E^*}\right)+\frac{\alpha_E+\mu_E}{\alpha_E}\!\left(I-I^*-I^* \ln \frac{I}{I^*}\right)\right)\nonumber \\[3pt]
=&& L_1(t) + L_2 (t) + L_3(t),\end{eqnarray}
where
 \begin{eqnarray}&& L_1(t)=\sum_{x\in V}\left(S-S^*-S^* \ln \frac{S}{S^*} \right), \nonumber\\[3pt]
&& L_2(t)=\sum_{x\in V}\left(E-E^*-E^* \ln \frac{E}{E^*} \right), \nonumber\\[3pt]
&& L_3(t)=\frac{\alpha_E+\mu_E}{\alpha_E}\sum_{x\in V}\left(I-I^*-I^* \ln \frac{I}{I^*} \right).\end{eqnarray}
Then
 $L(t)\geq 0$
for all
 $t\geq 0$
, and
 $L(t)=0$
if and only if
 $(S, E, I)=(S^*, E^*, I^*)$
because it can be verified that the EE is the unique positive equilibrium of system (1.3) if
 ${\mathcal R}_0>1$
. We can compute that
 \begin{eqnarray}L^{\prime}_1 (t)=\sum_{x\in V}\left(1-\frac{S^*}{S}\right)\left(d\Delta_\omega S+(\Lambda-\mu_S S-\beta SI)\right).\end{eqnarray}
In view of Lemma 3.1, we have
 \begin{align}\sum_{x\in V}\left(1-\frac{S^*}{S}\right)\Delta_\omega S&=-\sum_{x\in V}\frac{S^*}{S}\Delta_\omega S \nonumber=\frac{S^*}{2}\sum_{x\in V}\left(\frac{1}{S(y)}-\frac{1}{S(x)}\right)(S(y)-S(x))\omega(x,y)\nonumber\\
&=-\frac{S^*}{2}\sum_{x\in V}\frac{(S(y)-S(x))^2}{S(x)S(y)}\omega(x,y)\leq 0. \end{align}
Plugging (3.18) into (3.17), we have
 \begin{eqnarray}L^{\prime}_1(t)\leq\sum_{x\in V}\left(\Lambda-\mu_S S-\beta SI-\Lambda\frac{S^*}{S}+\mu_S S^*+\beta S^*I\right).\end{eqnarray}
By carrying out similar computations as above, we also obtain that
 \begin{align}& L^{\prime}_2 (t) \leq \sum_{x\in V}\left(\beta SI-(\alpha_E+\mu_E)E-\beta SI\frac{E^*}{E}+(\alpha_E+\mu_E)E^*\right),\\& L^{\prime}_3 (t) \leq \sum_{x\in V}\left((\alpha_E+\mu_E)E-\frac{(\alpha_E+\mu_E)(\mu_I+\gamma_I)}{\alpha_E}I-(\alpha_E+\mu_E)\frac{I^*}{I}E+\frac{(\alpha_E+\mu_E)(\mu_I+\gamma_I)}{\alpha_E}I^*\right).\nonumber\end{align}
Combing (3.19) and (3.20), we find that
 \begin{align}L^{\prime}(t)&\leq \sum_{x\in V}\left(\Lambda-\mu_S S-\beta SI-\Lambda\frac{S^*}{S}+\mu_S S^*+\beta S^*I\right) \nonumber\\& + \sum_{x\in V}\left(\beta SI-(\alpha_E+\mu_E)E-\beta SI\frac{E^*}{E}+(\alpha_E+\mu_E)E^*\right) \nonumber\\& +\sum_{x\in V}\left((\alpha_E+\mu_E)E-\frac{(\alpha_E+\mu_E)(\mu_I+\gamma_I)}{\alpha_E}I-(\alpha_E+\mu_E)\frac{I^*}{I}E+\frac{(\alpha_E+\mu_E)(\mu_I+\gamma_I)}{\alpha_E}I^*\right) \nonumber\\&= \sum_{x\in V}\left(\Lambda-\mu_S S-\Lambda\frac{S^*}{S}+\mu_S S^*+\beta S^*I\right) \nonumber\\& + \sum_{x\in V}\left(-\beta SI\frac{E^*}{E}+(\alpha_E+\mu_E)E^*\right) \nonumber\\& +\sum_{x\in V}\left(-\frac{(\alpha_E+\mu_E)(\mu_I+\gamma_I)}{\alpha_E}I-(\alpha_E+\mu_E)\frac{I^*}{I}E+\frac{(\alpha_E+\mu_E)(\mu_I+\gamma_I)}{\alpha_E}I^*\right).\end{align}
By inserting
 $\beta S^*=\frac{(\alpha_E+\mu_E)(\mu_I+\gamma_I)}{\alpha_E}$
to the above inequality, we have
 \begin{align}L^{\prime}(t)&\leq \sum_{x\in V}\left(\Lambda-\mu_S S-\Lambda\frac{S^*}{S}+\mu_S S^*\right)+ \sum_{x\in V}\left(-\beta SI\frac{E^*}{E}+(\alpha_E+\mu_E)E^*\right) \nonumber\\&\quad +\sum_{x\in V}\left(-(\alpha_E+\mu_E)\frac{I^*}{I}E+\beta S^*I^*\right).\end{align}
Noticing that
 \begin{align}-\beta SI\frac{E^*}{E}&=-\beta S^* I^*\frac{E^*}{E}\frac{S}{S^*}\frac{I}{I^*},\nonumber\\(\alpha_E+\mu_E)E^*&=\beta S^* I^*,\nonumber\\-(\mu_E+\alpha_E)\frac{I^*}{I}E&=-\beta S^* I^*\frac{I^*}{I}\frac{E}{E^*},\end{align}
the above inequality becomes
 \begin{align}L^{\prime}(t)&\leq \sum_{x\in V}\left(\Lambda-\mu_S S-\Lambda\frac{S^*}{S}+\mu_S S^*\right) + \sum_{x\in V}\left(-\beta S^* I^*\frac{E^*}{E}\frac{S}{S^*}\frac{I}{I^*}+\beta S^* I^*\right) \nonumber\\&\quad +\sum_{x\in V}\left(-\beta S^* I^*\frac{I^*}{I}\frac{E}{E^*}+\beta S^*I^*\right).\end{align}
Moreover, since
 $\Lambda=\beta S^* I^*+\mu_S S^*$
, the first term on the right-hand side in (3.24) becomes
 \begin{align}\Lambda-\mu_S S-\Lambda\frac{S^*}{S}+\mu_S S^*&= \left(\beta S^* I^*+\mu_S S^*\right)\left(1-\frac{S^*}{S}\right) +\mu_S S^* \left(1-\frac{S}{S^*}\right)\nonumber\\
&=\beta S^*I^*+\mu_S S^*-\mu_SS^*\frac{S}{S^*}-\beta S^*I^*\frac{S^*}{S}-\mu_S S^*\frac{S^*}{S}+\mu_S S^*. \end{align}
Plugging (3.25) into (3.24), we obtain
 \begin{align}L^{\prime}(t)&\leq \sum_{x\in V}\left(\beta S^*I^*+\mu_S S^*-\mu_SS^*\frac{S}{S^*}-\beta S^*I^*\frac{S^*}{S}-\mu_S S^*\frac{S^*}{S}+\mu_S S^*\right) \nonumber\\&\quad + \sum_{x\in V}\left(-\beta S^* I^*\frac{E^*}{E}\frac{S}{S^*}\frac{I}{I^*}+\beta S^* I^*\right)+\sum_{x\in V}\left(-\beta S^* I^*\frac{I^*}{I}\frac{E}{E^*}+\beta S^*I^*\right)\nonumber\\&=\sum_{x\in V}\left( \mu_SS^*\left(2-\frac{S}{S^*}-\frac{S^*}{S}\right)+\beta S^*I^*\left(3-\frac{S^*}{S}-\frac{E^*}{E}\frac{S}{S^*}\frac{I}{I^*}-\frac{I^*}{I}\frac{E}{E^*}\right)\right)\leq 0,\end{align}
where the last inequality followed from the fact that S(x, t), E(x, t) and I(x, t) are all positive confined on the positively compact invariant set
 $\Omega$
, using the mean inequality yields
 $2-\frac{S}{S^*}-\frac{S^*}{S}\leq 0$
and
 $3-\frac{S^*}{S}-\frac{E^*}{E}\frac{S}{S^*}\frac{I}{I^*}-\frac{I^*}{I}\frac{E}{E^*}\leq0$
. In light of (3.26), by applying the Liapunov–LaSalle invariance principle, we have
 \begin{eqnarray}\lim_{t\rightarrow\infty}(S, E, I)=(S^*, E^*, I^*)\end{eqnarray}
confined on
 $\Omega$
.
It remains to show that
 $\lim_{t\rightarrow\infty}R(x, t)=R^*$
. Since
 $\lim_{t\rightarrow\infty}I(x, t)=I^*$
, for any
 $\varepsilon>0$
there exists
 $t_1>0$
such that
 \begin{eqnarray}I^*-\varepsilon<I(x, t)<I^*+\varepsilon \mbox{ for }t\geq t_1, x\in V.\end{eqnarray}
Plugging the above inequality into (1.3), we find
 \begin{align*}&\gamma_I(I^*-\varepsilon)-\mu_R R\leq\frac{\partial R}{\partial t}- d\Delta_\omega R\leq \gamma_I(I^*+\varepsilon)-\mu_R R, (x, t)\in V\times (t_1, \infty),\\&R(x, t)|_{t=t_1}=R(x, t_1)\geq 0, x\in V.\end{align*}
Using Lemma 2.9, we obtain that
 \[\frac{ \gamma_I}{\mu_R}(I^*-\varepsilon)\leq\liminf_{t\rightarrow\infty}R(x, t)\leq\limsup_{t\rightarrow\infty}R(x, t)\leq \frac{ \gamma_I}{\mu_R}(I^*+\varepsilon).\]
Letting
 $\varepsilon\rightarrow 0$
, we immediately have
 $R(x, t)\rightarrow R^*$
for
 $x\in V$
.
4 Numerical simulations
In this section, we perform some numerical solutions of system (1.3) to demonstrate that population mobility has an impact on both asymptotic (long-time) and transient (short-time) dynamics of infectious diseases on weighted networks. Let G and L, respectively, denote the adjacent matrix and Laplacian matrix of the graph
 $\mathcal{G}$
. Take the mean number of individuals per unit time moving from
 $x_i$
to
 $x_j$
as the weight matrix
 $\omega(i, j)$
. Here we assume that
 $\omega(i, j)$
is a symmetric matrix. Set
 \begin{eqnarray}S(x, t)=U_1(i, t), \; E(x, t)=U_2(i, t), \; I(x, t)=U_3(i, t), \; R(x, t)=U_4(i, t).\end{eqnarray}
Then system (1.3) can be rewritten as the following ordinary differential equations:
 \begin{eqnarray}\frac{d U_k(i ,t)}{dt} =f_k(U_1, U_2, U_3, U_4)(i ,t)+d_k\sum_{j=1}^n L_{ij}U_k(j ,t) &\mbox{ for } i=1,2\cdots,n,\end{eqnarray}
where
 $k=1, 2, 3, 4$
. In our numerical simulations, we assume the initial total population to be 1,000,000, which is apportioned equally to 100 nodes. The initial infectious population size is assumed to be
 $12.$
Theorem 3.2 indicates that in the case of
 ${\mathcal R}_0<1$
, solutions of system (1.3) will converge to the disease-free equilibrium at any arbitrary node. But besides the long-time behaviour, it is natural to examine the short-time behaviour for model (1.3) because the total infected population is a key character for controlling the epidemic. To do so, we take the following parameter values (time = [t] = one day):
 \begin{align}\Lambda=0.01, \beta=0.8, \mu_S=0.001, \mu_E=0.001, \alpha_E=0.25, \mu_I=0.009, \gamma_I=0.2, \mu_R=0.001.\end{align}
We assume that the graph
 $\mathcal{G}$
is a Watts–Strogatz network, where
 $n=100$
in the vertices. From a mathematical point of view, Watts–Strogatz network is an undirected graph where some of the connections between the nodes are determined while others are random. The edges E are connected with an average degree of 6 and the probability to rewire a link is
 $1/4.$
If the average degree is 6, each node is connected with 3 other nodes adjacent to both its left and right sides. If the probability to rewire a link is
 $1/4$
, the probability for each node to be connected to any other node in the graph is
 $1/4$
. The role of the rewired edge is to introduce some stochastic routine between two vertices in model (1.3) due to the fact that the individual population is sometimes unavoidably subject to a random walk.
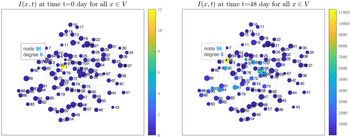
Solutions of I(x,t) at time instants t = 0 and 48 in the Watts–Strogatz network. The node size corresponds to the node degree. The node color bar represents the population.

The left figure presents solutions of the ODEs. The right figure is the Watts–Strogatz network simulation with the graph Laplacian operator, where every grid of the vertical coordinate represents a node.

In the left panel of Figure 1, we illustrate the initial infected population in the network, which is taken as 12 on one node and 0 for all others. Employing a Runge–Kutta 4 scheme for the time integration, we depict the number of the infected population on the network for time
 $t=48$
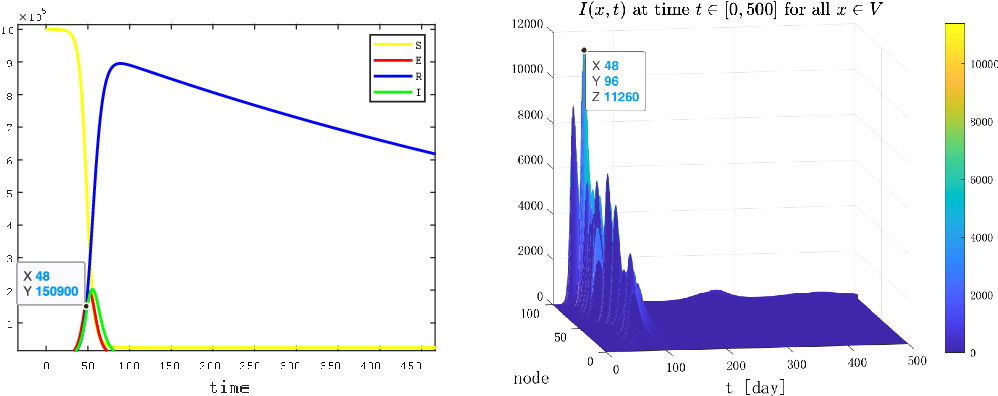
in the right panel of Figure 1. Here node 96 has the largest degree of 8 (the largest size) and the population number of 0. In the right panel, we find that node 96 has a population number of 11,260. Hence, we show that the network, for different nodes, exhibits spatially inhomogeneous behaviour. Since it does not show the effect of network on the infected population, we then depict the temporal solution of system (1.3), where we do not consider the network structure but just arrange the nodes in a vertical column. In the left panel of Figure 2, we simulate the dynamical behaviour of the well-mixed ordinary differential equations. The solution of the infected population first increases to a peak and then decreases towards 0. For comparison, we simulate the dynamical behaviour of system (1.3) where the spatial networked structure is subject to Watts–Strogatz small world network. We see from the right panel of Figure 2 that the solution of the infected population for each node exhibits an asymptotic dynamical behaviour similar to the solution of the ordinary differential system. However, at the same moment
 $t=48$
, we see that the solution of the ordinary differential equation is 150,900 which has not attained its peak, while node 96 has reached the highest peak 11,260 of the whole network. That is, although the parameter of system (1.3) for each node is the same, the peak for each node is different and the time to reach the peak is also different. Moreover, we can find the relation between the peak and the time to reach the peak; that is, the higher the node’s peak, the less time it takes to reach the peak. The underline reason is the fact that the node degrees determine the peaks; that is, the greater the degree becomes, the higher the peak reaches.
5 Discussions
Much of the current studies on epidemic transmission dynamics focus on the temporal development and control of infectious diseases using ordinary differential equations, thus uncertainty still exists concerning how population mobility affects epidemic outbreaks. To study the geographic spread of infectious diseases, the spatial factor should be considered in the modelling processes. Laplacian diffusion systems with spatially homogeneous parameters (Murray [Reference Murray16], Fitzgibbon and Langlais [Reference Fitzgibbon and Langlais6], Ruan [Reference Ruan19], Ruan and Wu [Reference Ruan and Wu20]) and spatially heterogeneous parameters (Allen et al. [Reference Allen, Bolker, Lou and Nevai1], Lei et al. [Reference Lei, Li and Liu10], Li et al. [Reference Li, Peng and Wang11], Song et al. [Reference Song, Lou and Xiao22]) have been proposed to study the spatio-temporal dynamics of epidemic models. In these studies, Laplacian operators have been employed to describe the population dispersal where every individual is assumed to obey the principle of Gaussian random walk; i.e., the probability of moving into any direction is equal. Our SEIR model in a weighted network is different since the movement of population in each vertex depends on the topological structure of the network. We studied the short-time and long-time dynamical behaviours of the SEIR epidemic model. To the best of our knowledge, there is no epidemic model in the literature in which the graph Laplacian diffusion is used to describe the spatio-temporal spread of infectious diseases
Our results indicate that population mobility has an impact on both asymptotic (long-time) and transient (short-time) dynamics of infectious diseases on weighted networks. When the basic reproduction number
 ${\mathcal R}_0<1$
, Theorem 3.2 indicates that system (1.3) admits a globally asymptotically stable disease-free equilibrium. When the basic reproduction number
 ${\mathcal R}_0>1$
, Theorem 3.4 indicates that system (1.3) admits a globally asymptotically stable EE. So we have generalised the threshold dynamics of the classical SEIR model to that on a weighted network. It seems that the graph Laplacian operator defined on weighed connected graph does not affect the long-time dynamics of the model. However, our numerical simulations in Figures 1 and 2 demonstrate that, when the graph Laplacian operator corresponding to the adjacent matrix is subject to Watts–Strogatz small world network, in the case of globally asymptotically stable disease-free equilibrium, the peak of the infected population admits a spatially inhomogeneous distribution. When there are more degrees of a node, the peak will be higher. Moreover, it takes less time to reach a higher peak. For example, London and New York City have more flight connections than other cities in UK and the US, respectively. During the pandemic of COVID-19, these two cities reported more cases than other cities and reached their peaks faster than other cities in the UK and US, respectively (WHO [25]).
Acknowledgements
We are very grateful to the two anonymous reviewers and the handling editor for their helpful comments and valuable suggestions.
Conflicts of interest
All the authors declare that there is no conflict of interest relating to work contained herein.
Matlab codes
The Matlab codes used for the numerical simulations in the paper can be accessed via https://zenodo.org/record/6354073#.Yi-GprgpDUo.
Appendix
Proof of Lemma 2.2. Let G be the the adjacent matrix of the graph
 $\mathcal{G}$
, L the Laplacian matrix. L is read as
 \begin{eqnarray}L_{ij}=\begin{cases}G_{ij}\omega(i,j), & j \neq i\\-\Sigma_{j=1}^n G_{ij}\omega(i,j), & j= i.\end{cases}\end{eqnarray}
Then, (2.9) is transformed into the following ordinary differential equations on discrete nodes:
 \begin{align}\frac{d u(i ,t)}{dt} =f(x)+d\sum_{j=1}^n L_{ij}u(j ,t)-K(x)u(i ,t) \mbox{ for } i=1,2\cdots,n,\end{align}
where u(i, t) is the value of u(x, t) on ith node. Let
 $U=(u(1,t),\cdots,u(n,t))^T$
be the vector of u(x, t) on the graph
 $\mathcal{G}$
, (A2) becomes
 \begin{align}\frac{d U}{dt} =f(x)+(dL-K(x)I)U,\end{align}
with the initial data
 $U_0=u_0(x)$
. Here I is the identity matrix. Then we obtain the solution of (A3) as
 \begin{align}U(t) =e^{(dL-k(x)I)t}\!\left(U_0+\int e^{-(dL-k(x)I)t}f(x)dt\right).\end{align}
Proof of Lemma 2.3. We prove the lemma by contradiction. Assume that
 $u(x, t)\geq 0$
on
 $V\times [0, T]$
is not true. Then, there exists a point
 $(x_0, t_0)\in V\times [0, T]$
such that
 $u(x_0, t_0)=\min_{V\times [0, T]} u(x,t)<0$
. Since
 $u(x_0, 0)\geq 0$
,
 $(x_0, t_0)$
must be on
 $V\times (0, T]$
. By (2.10), we have
 \begin{eqnarray}\left(\frac{\partial u}{\partial t}-d\Delta_\omega u+K u \right)|_{(x_0, t_0)}\geq 0.\end{eqnarray}
Since u is differentiable with respect to t on
 $V\times (0, T]$
,
 $\frac{\partial u}{\partial t}|_{(x_0, t_0)}\leq 0$
. By (1.2), we also have
 $\Delta_\omega u|_{(x_0, t_0)}\geq 0$
. We consider two cases.
-
(i)
$K(x_0, t_0)>0$
. Combining with
$Ku(x_0, t_0)<0$
, we obtain
(A6)which is a contradiction to (A5).
\begin{eqnarray}\left(\frac{\partial u}{\partial t}-d\Delta_\omega u+K u \right)|_{(x_0, t_0)}
< 0,\end{eqnarray}
-
(ii)
$K(x_0, t_0)\leq0$
. We perform a transformation
$w=e^{-\gamma t}u$
. It follows from (A5) that
(A7)By choosing
\begin{eqnarray}\left(\frac{\partial w}{\partial t}-d\Delta_\omega w+(K+\gamma) w \right)|_{(x_0, t_0)}\geq 0.\end{eqnarray}
$\gamma>-K(x_0, t_0)$
, we can employ the result of the case
$K(x_0, t_0)>0$
to obtain
$w(x, t)\geq 0$
on
$V\times [0, T]$
. Since
$u=e^{\gamma t} w$
,
$u(x, t)\geq 0$
on
$V\times [0, T]$
.


Proof of Lemma 2.4. Note that
 $u(x, t)\geq 0$
on
 $V\times [0, T]$
by the above maximum principle. By (2.10), for
 $t\in (0, T]$
we have
 \begin{eqnarray}\left(\frac{\partial u}{\partial t}-d\Delta_\omega u+K u \right)\bigg|_{(x^*, t)}\geq 0.\end{eqnarray}
Plugging (1.1) and (1.2) into the above inequality, we have
 \begin{align}\frac{\partial u(x^*, t)}{\partial t}&\geq \sum_{y\sim x^*,y\in V}d[u(y, t)-u(x^*, t)]\omega(x^*, y)-K u(x^*, t)\nonumber\\&\geq -\sum_{y\sim x^*,y\in V}d\omega(x^*, y)u(x^*, t)-K u(x^*, t)\nonumber\\&\geq -( d D_\omega(x^*)+K)u(x^*, t)\nonumber\\&\geq -( d D_\omega(x^*)-||K(x,t)||_{L^\infty(V\times[0,t])})u(x^*, t), \mbox{ for } t\in (0, T].\end{align}
Since
 $u(x^*, 0)>0$
, (A9) implies that
 \begin{eqnarray}u(x^*, t)\geq u(x^*, 0)e^{-( d D_\omega(x^*)-||K(x,t)||_{L^\infty(V\times[0,t])})t}>0 \mbox{ for } t\in (0, T].\end{eqnarray}
We prove the lemma by contradiction. First, consider the case where
 $K>0$
. If
 $u(x, t)>0$
on
 $V\times (0, T]$
is not true, there exists a point
 $(x_0, t_0)\in V\times (0, T]$
such that
 $u(x_0, t_0)=\min_{V\times (0, T]} u(x,t)=0$
. By (2.10), we have
 \begin{eqnarray}\left(\frac{\partial u}{\partial t}-d\Delta_\omega u+K u \right)\bigg|_{(x_0, t_0)}\geq 0.\end{eqnarray}
Since u is differentiable with respect to t on
 $V\times (0, T]$
, it follows that
 $\frac{\partial u}{\partial t}|_{(x_0, t_0)}\leq 0$
. Thus, (2.10) implies that
 \begin{eqnarray}\Delta_\omega u(x_0, t_0)\leq \frac{1}{d}\left(\frac{\partial u}{\partial t}\Big|_{(x_0, t_0)}+K u(x_0, t_0)\right)\leq 0.\end{eqnarray}
By (1.2), it follows that
 $\Delta_\omega u|_{(x_0, t_0)}\geq 0$
. Thus, we have
 \begin{eqnarray}\Delta_\omega u(x_0, t_0)=0, \mbox{ i.e. }\sum_{y\sim x,y\in V}\omega(x, y) u(y, t_0)=0.\end{eqnarray}
The above equation implies that
 \begin{eqnarray}u(y, t_0)=0 \mbox{ for all } y\in V\mbox{ and }y\sim x_0.\end{eqnarray}
On the other hand, since V is connected, for any
 $x\in V$
there exists a path
 \begin{eqnarray}x_0\sim x_1\sim \cdots \sim x_n\equiv x^*.\end{eqnarray}
By (A14), we obtain that
 $u(x_1, t_0)=0$
. Employing the above argument repeatedly, we shall induce
 $u(x_n, t_0)=0$
in order. Therefore, we obtain
 $u(x^*, t_0)=0$
, which contradicts (A10). In the case of
 $K(x, t)\leq 0$
, by performing a transformation
 $w=e^{-\gamma t}u$
, we also obtain a similar contradiction.
Proof of Lemma 2.5. We perform a transformation
 $w_i=e^{-\gamma t}u_i$
for
 $i=1, \cdots, m$
. It follows from (2.11) that
 \begin{align}&\frac{\partial w_i}{\partial t}-d_i\Delta_\omega w_i+\sum_{j=1}^m \overline K_{ij} w_j> 0 \mbox{ for }i=1, \cdots, m, (x, t)\in V\times (0, T], \nonumber\\
&w_i(x, 0)> 0 \mbox{ for }i=1, \cdots, m, x\in V,\end{align}
where
 \begin{align}&\overline K_{ii}=K_{ii}+\gamma>0, i=1, \cdots, m, \nonumber\\&\overline K_{ij}=K_{ij}\leq 0, i\neq j, i, j=1, \cdots, m,\end{align}
provided
 $\gamma> \max_{i=1, \cdots, m}\{||K_{ii}||_\infty$
}.
Since
 $w_i(x, 0)=u_i(x, 0)>0$
for
 $x\in V$
, by the continuity of
 $u_i$
and finite vertices of V, there exists
 $\delta>0$
such that for
 $(x, t)\in V\times [0, \delta]$
,
 $w_i(x, t)>0$
hold for all
 $i=1, \cdots, m$
. Define
 \begin{eqnarray}T^*:=\sup\{t: t\leq T, \mbox{ for all } i=1, \cdots, m, w_i(x, t)>0 \mbox{ hold for } (x, t)\in V\times [0, T]\},\end{eqnarray}
then
 $T^*$
is well defined and satisfies
 $0<T^*\leq T$
.
We prove the lemma by contradiction. Suppose not, there exists some
 $x_0\in V$
and
 $k\in\{1, \cdots, m\}$
such that some component
 $w_k$
satisfies
 $w_k(x_0, T^*)=0$
. By the definition of
 $T^*$
,
 $w_k$
attains its minimum value on
 $V\times [0, T^*]$
at the point
 $(x_0, T^*)$
. Since
 $w_k$
is differentiable with respect to t in
 $V\times (0, T^*]$
,
 $\frac{\partial w_k}{\partial t}|_{(x_0, T^*)}\leq 0$
. By (1.2), we also have
 $\Delta_\omega w_k|_{(x_0, T^*)}\geq 0$
. Hence, when
 $(x, t)=(x_0, T^*)$
, we have
 \begin{eqnarray}\frac{\partial w_k}{\partial t}-d_i\Delta_\omega w_k+\sum_{j=1}^n \overline K_{kj} w_j\leq 0,\end{eqnarray}
which is a contradiction to (A16).
Proof of Lemma 2.6. Since
 $K_{ij}(x, t)$
are bounded functions on
 $V\times [0, T]$
, there exists a constant
 $\gamma>0$
such that
 \begin{eqnarray}\gamma+\sum_{j=1}^m K_{ij}>0, (x, t)\in V\times (0, T], i=1, \cdots, m.\end{eqnarray}
We perform a transformation
 $w_i=u_i+\varepsilon e^{\gamma t}$
for
 $i=1, \cdots, m$
. It follows from (2.12) that for
 $i=1, \cdots, m$
and
 $(x, t)\in V\times (0, T]$
,
 \begin{eqnarray}\frac{\partial w_i}{\partial t}-d_i\Delta_\omega w_i+\sum_{j=1}^m K_{ij} w_j=\frac{\partial u_i}{\partial t}-d_i\Delta_\omega u_i+\sum_{j=1}^m K_{ij} u_j+\varepsilon e^{\gamma t}(\gamma+\sum_{j=1}^m K_{ij})>0.\end{eqnarray}
Moreover
 $w_i(x, 0)>0$
holds. By using Lemma 2.5, we have
 $w_i(x, t)>0$
for
 $(x, t)\in V\times (0, T]$
. Letting
 $\varepsilon\rightarrow 0$
, we immediately get
 $u_i(x, t)\geq0$
for
 $(x, t)\in V\times [0, T]$
.
In the case of
 $u_i(x, 0)\not\equiv0$
. In addition, since
 $u_j(x, t)\geq 0$
for
 $j=1, \cdots, m$
, we have
 \begin{eqnarray}\frac{\partial u_i}{\partial t}-d_i\Delta_\omega u_i+K_{ii} u_i\geq 0 \mbox{ for } (x, t)\in V.\end{eqnarray}
Directly applying strong maximum principle (Lemma 2.4), we obtain
 $u_i(x, t)> 0$
on
 $V\times [0, T]$
.