


I. INTRODUCTION
The interaction of hydrogen with metals is a longstanding problem of interest across several disciplines such as surface chemistry and catalysis, applied physics, metallurgy, and mechanical engineering. The deleterious effect of hydrogen on the mechanical properties of metals and alloys remains a vexing problem for structural applications and is still incompletely understood from a mechanistic standpoint due to the multiplicity of mechanisms by which hydrogen interacts with metals. Furthermore, it is now widely accepted that several of these phenomena are inherently coupledReference Hirth1, Reference Birnbaum and Sofronis2, Reference Katz, Tymiak and Gerberich3 and the search for a single dominant mechanism, which has fueled much research and (inevitably) opposing viewpoints, is futile.
Among several mechanisms proposed for hydrogen embrittlement (HE) of metals, hydrogen-enhanced decohesion (HEDE)Reference Troiano4, Reference Oriani and Josephic5, Reference Oriani6 and hydrogen-enhanced local plasticity (HELP)Reference Birnbaum and Sofronis2, Reference Beacham7, Reference Robertson8 have gained acceptance as the two most viable for stable phases. Material degradation via the formation of brittle hydride phases,Reference Westlake9 possibly stabilized by local stresses,Reference Gahr, Grossbeck and Birnbaum10 is also a viable mechanism but has not been found to be relevant for iron,Reference Hirth1 which is the material of interest in this work. The HEDE mechanism postulates embrittlement due to localized reduction in cohesive strength induced by the segregation of hydrogen to defects such as grain boundaries, microcracks, notches, and second phase particles, among others. In this case, embrittlement is directly attributable to a decrease in the strength of atomic bonding of the host metal in regions of hydrogen accumulation. The HELP mechanism is based on the observation that hydrogen, which tends to form a Cottrell atmosphereReference Cottrell and Bilby11 around dislocation cores, reduces barriers to dislocation motion and effectively unpins dislocations at lower stress levels. This leads to highly localized slip in the vicinity of crack surfaces and eventually to localized plastic failure. In this sense, HELP is more of a strength degradation mechanism rather than embrittlement, which is commonly perceived to be a toughness degradation mechanism.
In broad terms, HE models require a description of (i) hydrogen transport within metals, inevitably in the presence of microstructural imperfections, and (ii) the effect of hydrogen on the mechanical behavior of the host metal, again mediated by interactions with defects. These issues have been extensively discussed in compilations and reviewsReference Hirth1, 12, Reference Kirchheim13, Reference Myers, Baskes, Birnbaum, Corbett, DeLeo, Estreicher, Haller, Jena, Johnson, Kirchheim, Pearton and Stavola14, Reference Oriani15, 16, Reference Fukai17 and we only briefly outline the basic mechanisms with emphasis on α–iron [body-centered cubic (bcc)] where necessary. The introduction of hydrogen from the environment can occur by proton deposition at a free surface or by dissociative adsorption. An adsorbed hydrogen atom can be incorporated subsequently in a subsurface interstitial site and diffuse thereafter into the bulk. In the case of bcc Fe (110) and Fe (100) surfaces, density functional theory (DFT) calculationsReference Jiang and Carter18, Reference Jiang and Carter19 clearly indicate that the adsorption process is exothermic (i.e., it is energetically preferable for hydrogen to adsorb on the Fe surface than remain in a molecular state) while incorporation into subsurface sites is endothermic (i.e., hydrogen would rather remain on/segregate to a free surface than be in the bulk). Once incorporated in the bulk, hydrogen diffuses rapidly between tetrahedral sites of the bcc lattice, the diffusivity being on the order of 10−8 m2/s in a perfect lattice.Reference Jiang and Carter19, Reference Grabke and Riecke20 However, microstructural imperfections (vacancies, solute atoms, dislocations, grain boundaries, etc.) provide low energy trapping sites within the lattice and retard the overall diffusion.Reference Kirchheim13, Reference McNabb and Foster21, Reference Oriani22, Reference Kumnick and Johnson23, Reference Kirchheim24, Reference Wert and Frank25, Reference Krom and Bakker26 The existence of these traps plays an important role in the retention of hydrogen within the bulk, given the low solubility of hydrogen in iron.Reference Hirth1 Furthermore, when trapping occurs at interfaces such as matrix/second-phase particles, grain boundaries, microcracks, etc., the cohesive strength of these interfaces is compromised, thereby promoting decohesion and/or emission of dislocations. Last, but not least, in describing bulk diffusion of hydrogen we must account for its interaction with stress fields that arise from existing lattice defects or from external loads.Reference Cottrell and Bilby11, Reference Kirchheim27, Reference Sofronis and Birnbaum28 It is generally assumed that hydrogen segregates preferentially in dilatational strain fields:Reference Wert29 later in this article, we provide results from DFT calculations that clearly quantify this effect. The concentration gradient, which provides the driving force for diffusion, is sensitive to stress gradients. Thus, hydrogen in solution will be driven preferentially towards regions of dilatational strain (such as crack tips) thereby inducing hydrogen-enhanced decohesion or plasticity at these locations.
The effect of hydrogen on the mechanical properties of metals has been well documented in the reviews noted above; in particular, details relevant to iron and steel may be found in the review by Hirth.Reference Hirth1 We note a few salient features that seem most pertinent to HEDE and HELP mechanisms, with emphasis upon the microscopic processes involved. For HEDE, the relevant microscopic process is the reduction in cohesive strength of the material in regions of hydrogen accumulation. Recent first-principles calculations by van der Ven and CederReference van der Wen and Ceder30 for Al (111) surfaces and by Jiang and CarterReference Jiang and Carter31 for Al (111) and bcc Fe (110) surfaces clearly demonstrate a reduction both in surface energy as well as cohesive strength of these interfaces with increasing hydrogen coverage. This implies that segregation of hydrogen to crack tips (within the so-called “cohesive zone” region ahead of a crack), or to other internal interfaces within the material, will lead to cleavage along fracture planes or decohesion of interfaces at lower levels of load. Indeed, this model for reduced cohesive strength with increasing hydrogen coverage, with proper upscaling to continuum scales via renormalization,Reference Nguyen and Ortiz32, Reference Hayes, Ortiz and Carter33 was used in the work of Serebrinsky et al.Reference Serebrinsky, Carter and Ortiz34 and shown to produce plausible results for intermittent crack propagation in embrittled steels. Similar models, albeit with a phenomenological law for degradation of cohesive strength, have also been proposed.Reference Gerberich, Livne, Chen and Kaczorowski35, Reference Lee and Unger36 The interaction of hydrogen with defects in crystalline materials is reviewed at length in Ref. Reference Myers, Baskes, Birnbaum, Corbett, DeLeo, Estreicher, Haller, Jena, Johnson, Kirchheim, Pearton and Stavola14. With reference to the HELP mechanism, interaction of hydrogen with dislocations is of prime importance. Direct observations of enhanced dislocation mobility induced by hydrogen,Reference Robertson8 even under conditions of constant stress, suggest that hydrogen shields the elastic fields of dislocations and allows for extensive localization of slip, which is typically observed along fracture surfaces in hydrogen embrittled iron.Reference Birnbaum and Sofronis2 HELP has been modeled at a continuum level by prescribing a local flow stress that decreases with increasing hydrogen concentrationReference Liang, Sofronis and Aravas37; the constitutive law for softening is not obtained from the actual material response and is a phenomenological construct designed to reproduce macroscopic experimental observations. Molecular dynamics studies of the interaction of a single hydrogen atomReference Nedelcu and Kizler38 with an edge dislocation in bcc iron suggest that hydrogen dissolved in tetrahedral sites can reduce the Peierls stress for dislocation motion. Conversely, the same studies also suggest that dislocations can be pinned upon encountering hydrogen–vacancy complexes. Recent atomistic studiesReference Wen, Fukuyama and Yokogawa39 on the energetics of kink-pair nucleation at screw dislocations suggest that hydrogen can decrease the kink-pair formation energy upon jumping to the strong binding site at a dislocation core. Hydrogen that is already bound at a dislocation core can, however, impede the motion of existing kinks. At higher temperatures, hydrogen jumps more frequently to dislocation cores, inducing kink-pair nucleation, and also jumps away from dislocation cores frequently enough to not impede kink motion. These findings would appear to be consistent with experiments that report hydrogen-induced softening in high purity iron, believed to be mediated by screw dislocation motion, at temperatures higher than 200 K.Reference Kimura and Kimura40, Reference Kimura and Matsui41
From the above discussion, which is certainly a restricted view of embrittlement mechanisms, it is already evident that hydrogen–metal interactions are remarkably complex to model. There has been extensive research on modeling these interactions from quantum mechanical to continuum levels. Some of these studies have already been alluded to before and we note next a few more works that have sought to model the overall embrittlement process rather than individual mechanisms. At the continuum level, Sofronis and coworkersReference Liang, Sofronis and Aravas37, Reference Sofronis and McMeeking42, Reference Lufrano and Sofronis43, Reference Taha and Sofronis44 have used finite element studies extensively to model the interaction of hydrogen with cracks and notches. A brief survey with further references may be found in Ref. Reference Taha and Sofronis44. The primary features of these models are stress-assisted diffusion and an elasto-plastic constitutive law (J2 plasticity) for material response; additional constitutive assumptions need to be made to capture hydrogen-induced dilatation, trap generation with plastic strain, and changes in local elastic moduli with hydrogen concentration. The main outcomes of such studies are predictions related to initiation of fracture from or near notches, necking instabilities and shear localization, and macroscopic stress–strain behavior, among others. As with all continuum models, the validity of the constitutive assumptions can be established only to the extent that the observed behavior is not contrary to direct experimental evidence. Other models that have a more micromechanical basis have also been proposed to analyze the interaction of discrete dislocation pile-ups with cracks in the presence of hydrogen (e.g., Refs. Reference Katz, Tymiak and Gerberich3, Reference Delafosse and Magnin45, and references therein). Such models allow for a more direct description of embrittlement in the presence of crack tip plasticity and hydrogen. It should be noted that the discrete dislocation modeling is at the level of linear elasticity, which precludes a description of the dislocation core and possible interactions of consequence with hydrogen, and stress-assisted diffusion is still treated phenomenologically. More recently, there have been fully three-dimensional (3D) atomistic studiesReference Wen, Xu, Fukuyama and Yokogawa46 on crack propagation in hydrogen embrittled α-iron using molecular dynamics (MD) with embedded atom (EAM) potentials.Reference Daw and Baskes47, Reference Daw and Baskes48, Reference Daw, Foiles and Baskes49 Qualitatively, these studies predict blunting by dislocation emission of crack tips in the absence of hydrogen whereas hydrogen charged specimens show cleavage with some plasticity. The drawbacks with such MD calculations are the application of unphysically high strain rates (e.g., ∼1010/s in Ref. Reference Wen, Xu, Fukuyama and Yokogawa46), which entirely preclude experimental corroboration of predictions, as well as the lack of longrange diffusion of hydrogen in the bulk due to small simulation times (∼0.4 ns). Nevertheless the ability to model material response from an interatomic potential is still attractive from the perspective of eliminating phenomenological assumptions inherent in higher length scale models.
With the preceding remarks in mind, we outline the major goals of this work. It is fairly self-evident that hydrogen–metal interactions are complex and a comprehensive understanding of embrittlement will entail a more detailed reckoning than can be provided by phenomenology. Some progress can be made by incorporating information from more accurate calculations (quantum mechanical/atomistic) at smaller length scales in continuum models. As noted previously, recent work by Carter, Ortiz, and coworkersReference Jiang and Carter31, Reference Hayes, Ortiz and Carter33, Reference Serebrinsky, Carter and Ortiz34 along these lines has provided a basis for addressing crack propagation by hydrogen-enhanced decohesion. Although that work used a cohesive law from quantum mechanical calculations, crack tip plasticity and stress-assisted diffusion were still treated at a phenomenological level. It is not immediately obvious how this situation may be remedied within a continuum approach. On the other hand, a fully discrete approach, while computationally more expensive, provides an immediate avenue for progress. In this work, we focus on this particular issue of developing discrete approaches to model hydrogen–metal interactions in metals, α-iron being the candidate metal. The mechanics of hydrogen interaction with the host metal and microstructural defects, which are now fully atomistically resolved, is relatively easy to describe with an appropriate interatomic potential. We use an EAM potential for iron and hydrogen developed by Wen et al.Reference Wen, Xu, Fukuyama and Yokogawa46 in this work. The main difficulty lies in modeling the temporal aspect of the problem, since processes such as hydrogen absorption and bulk diffusion (with trapping) are thermally activated processes and, hence, are rare events that cannot be simulated over reasonable computational time scales with standard molecular dynamics. As an alternative, we present a kinetic Monte Carlo (KMC) approach, which can achieve extended time scales for long-range hydrogen diffusion. Since our interest is in describing both normal lattice diffusion as well as diffusion in strained and defective crystals, a lattice-based model will not suffice. We have developed an off-lattice model within which barriers to diffusion are ascertained on the fly with the sole knowledge of the local environment of the diffusing atom. Thus, unlike standard event-list-based KMC models, our model is applicable even when hitherto unforeseen configurations are encountered. Furthermore, diffusion barriers are now stress-dependent, since these are computed directly from the local atomic configuration. To speed up the on-the-fly calculations, which are all but unnecessary, except when local strains are large or the lattice defective, we carry out supplementary DFTReference Hohenberg and Kohn50, Reference Kohn and Sham51 calculations to precompute strain-dependent barriers for small to moderate lattice strains. These DFT calculations, which are of much higher accuracy and reliability than empirical potentials, are also used to verify the reliability of the EAM potential, which is fit only to bulk equilibrium properties.Reference Wen, Xu, Fukuyama and Yokogawa46 The organization of this article is as follows. Section II describes the numerical methods used. Section III provides results of DFT calculations and of KMC simulations of bulk diffusion in the presence of traps arising from microstructural defects (dislocations and vacancies). Section IV provides a summary with directions for future work.
II. MODELING APPROACH
A. DFT calculations
We perform spin-polarized DFT calculations, within the generalized gradient approximation (GGA) of the Perdew-Burke-Ernzerhof (PBE) formReference Perdew, Burke and Ernzerhof52 for electron exchange and correlation, using the Vienna Ab Initio Simulation Package (VASP).Reference Kresse and Hafner53, Reference Kresse and Furthmüller54, Reference Kresse and Furthmüller55 We use the Blöchl projector-augmented wave (PAW) method,Reference Blochl56 an all-electron frozen core DFT technique, as provided in VASP.Reference Kresse and Joubert57 The PAW potentials represent the nuclei plus core electrons up through the 3p shell. Detailed calibrations for Fe and H using PAW-DFT-GGA have been reported previously in Ref. Reference Jiang and Carter19. All our calculations are carried out using a supercell containing 54 Fe atoms and 1 H atom, denoted henceforth as Fe54H. This choice corresponds to a H concentration of 1.8 at.%. We determined from convergence studies a kinetic energy cutoff of 500 eV and a 6 × 6 × 6 k-point sampling for this supercell, which converges the total energy of the Fe54 cell to within 1 meV/atom. The dissolution energy of H in a tetrahedral site is converged to within 2 meV (without atomic relaxation). Brillouin zone integration is performed using the first-order Methfessel–Paxton method,Reference Methfessel and Paxton58 with a Fermi surface smearing of 0.1 eV. All structural relaxations are performed until forces on atoms are below 0.01 eV/ Å.
Although large supercells are preferable to minimize elastic interactions between interstitial H atoms in adjoining (periodic neighbor) cells, computational considerations impose a limit on practically feasible cell sizes. One way to circumvent this difficulty and still use small cell sizes is to fully relax both supercell vectors as well as ionic positions as was done by Jiang and Carter.Reference Jiang and Carter19 Since we wish to parameterize dissolution energies and diffusion barriers as function of lattice strain, the supercell must be held fixed at different levels of strain, which implies that the cell vectors can no longer be relaxed. If we choose our (unstrained) supercell such that relaxation of cell vectors and ionic positions produces well-converged H dissolution energies accompanied by a negligible change in the overall volume, we are assured that interactions between periodic images of H atoms are negligible even when the cell vectors are held fixed (since relaxation will not alter their lengths). It is also reasonable to expect then that the application of small strains to the cell vectors should not lead to significant interactions between periodic images of H atoms. For our Fe54H supercell, the relative change in cell volume is 0.73% and 0.72% when H is dissolved in the tetrahedral (T) and octahedral (O) sites respectively. Furthermore, when only ionic relaxation is allowed, the dissolution energy (referenced to the gaseous hydrogen molecule and pure bcc Fe), defined here as

is found to be 0.22 and 0.36 eV for dissolution in the T-sites and O-sites, respectively; Jiang and CarterReference Jiang and Carter19 report values of 0.19 eV (T-site) and 0.32 eV (O-site) when both ionic and cell-vector relaxation is allowed. Our present result for the dissolution energy of H in T-sites is thus 0.03 eV higher than Jiang and Carter’s result; numerical errors being ∼0.02 eV, we deem this to be an acceptable result. Within this level of expected error, our basic conclusion (discussed subsequently in Sec. III) remains unchanged, namely, the O-site is always higher in energy than the T-site. The O-site energies, therefore, do not play any further role in parameterizing our KMC calculations and, hence, the slight discrepancy in the predicted dissolution energies is inconsequential. Thus, the Fe54H supercell is adequately large to minimize interactions between periodic image H atoms and simultaneously produce well-converged dissolution energies.
To locate minimum energy pathways between T-sites, we use the climbing image nudged elastic band (CI-NEB)Reference Henkelman, Uberuaga and Jónsson59 method. In this scheme, which is a modification of the NEB method,Reference Jónsson, Mills and Jacobsen60 the highest-energy image climbs uphill to the saddle point. Hence, fewer images can be used in the elastic band without loss of resolution at the saddle point. For the CI-NEB calculations, we use a spring force-constant of 5 eV/Å2 between images and relax all ionic positions until forces on atoms are lesser than 0.01 eV/Å. The rank of the saddle point is determined by diagonalizing a Hessian matrix with displacements of 0.02 Å; only the H atom is allowed to move in the Hessian construction. The much more massive Fe atoms couple only weakly to the H atom and hence their contribution to the Hessian describing H atom motion can be safely neglected. Zero-point corrections to T-site and saddle point energies are computed by summing up the zero-point energies of the real-valued normal vibrational modes of the H atom as E ZPE = Σvihυi/2, υi being the real-valued frequency.
B. KMC model for diffusion
The case of a defect-free, but not necessarily strain-free, lattice serves as a good starting point to illustrate the details of the KMC model and is discussed first; the extension to defective lattices is outlined subsequently. The precise mechanism of H diffusion is complicated due to the fact that H is a sufficiently light impurity for quantum effects to be observable and yet heavy enough (as compared to electrons) to be localized in the metal lattice; Grabert and SchoberReference Grabert and Schober61 provide a theoretical review of these issues. At very low temperatures, coherent tunneling is expected to be the dominant mechanism, giving way to phonon-assisted tunneling as the temperature increases, and eventually to classical over-barrier jumps at still higher temperatures.Reference Fukai17 HirthReference Hirth1 suggests that at temperatures above 300 K diffusion could be described by small polaron theory,Reference Flynn and Stoneham62 whereas at temperatures above 800 K, H diffuses in a partly delocalized manner. In this work, which represents our first attempt at integrating diffusion kinetics with mechanics, we ignore these myriad complications and simply describe diffusion by over-barrier hops in the temperature range 300–600 K.
In α-iron, both indirect evidence from experiments,Reference Hirth1 as well as direct corroboration from DFT calculations,Reference Jiang and Carter19 favor dissolution of H in T-sites over O-sites. This result is valid even when the lattice is subjected to small to moderate strains (Sec. III). Thus, we need only consider hops between T-sites for bulk diffusion. To locate the T-sites, we first apply a Delaunay triangulation to the N-atom bcc lattice, which can generally be implemented as an O(N log N) algorithm.Reference Watson63 The Fe atoms are the nodes of the triangulated region, while the tetrahedra are the volume elements that contain the T-sites of interest. The exact position of the dissolved H-atom within the tetrahedron may be determined by relaxing the atoms and minimizing the energy of the system. From this T-site, the H-atom can execute a hop to one of four adjacent tetrahedra by passing through a common face. From symmetry arguments, or by a more careful NEB calculation,Reference Jiang and Carter19 it may be shown that the saddle point for a hop lies on the common face between adjoining tetrahedra. The location of the saddle point is determined by constraining the H-atom to this face (i.e., by placing the H-atom on the face and disallowing motion normal to the face during relaxation) and again carrying out an energy minimization. The barrier for the hop is then the energy difference between the saddle point and the initial minimum. Once the energy barrier E b is known, the jump rate J at temperature T may be evaluated as J = J 0 exp[E b/kT], k being Boltzmann’s constant. The jump frequency J 0 can be obtained within harmonic transition-state theoryReference Vineyard64 from the vibrational normal modes at the saddle point and T-site as
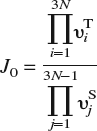
and is, to a very good approximation, independent of local strain as demonstrated in Sec. III. In the above expression, υTi are the 3N real-valued normal mode frequencies at the T-site and υSj are the 3N − 1 real-valued normal mode frequencies at the saddle point. It is worth noting that the energy barrier is sensitive to strains arising from other lattice defects or constraints (boundary conditions) and that this strain-sensitivity is implicitly accounted for in the energy minimization procedure. With all the events and rates at hand, we apply the n-fold way KMC algorithmReference Bulnes, Pereyra and Ricardo65 to simulate H-diffusion.
The extension of the above procedure to a defective lattice requires some care. In particular, unlike the case of a perfect lattice, there is no guarantee that there is actually an energy minimum in the interior of a tetrahedron within a defective region. In fact, using the H–Fe EAM potential,Reference Wen, Xu, Fukuyama and Yokogawa46 we have found instances of this problem even for a perfect lattice that is significantly distorted, although this could be an artifact of the potential itself. We illustrate the solution to such problems with a specific example. Consider an instance where the energy minimum lies (for whatever reason) not at a T-site but at an O-site, assuming for now that the lattice is otherwise perfect. The O-site is not in the interior of any tetrahedron; it lies instead on a common edge of four tetrahedra [Fig. 1(b)]. It is immediately apparent that proceeding naively as before to find minimum energy positions within the tetrahedral will lead to degeneracies (within numerical error), as inserting an H-atom in the interior of any of these tetrahedra and carrying out an ionic relaxation will lead to it migrating to the O-site. Moreover, relaxing the H-atom on faces containing the common edge will also lead to its migration to the same O-site; the barrier to hops (within numerical error) is then zero. Thus, in addition to misidentifying the relevant hops, the actual numerical procedure will be corrupted by rapid back and forth jumps of low activation energy. To avoid such problems in general, and also to correctly identify unexpected minimum energy sites when relevant (e.g., H bound to vacancies at displaced O-sitesReference Myers, Baskes, Birnbaum, Corbett, DeLeo, Estreicher, Haller, Jena, Johnson, Kirchheim, Pearton and Stavola14, Reference Fukai17, Reference Tateyama and Ohno66), a pair of connected T-sites with (near) zero energy barrier between them are assimilated into a single site. The two tetrahedra now form a single polyhedron with a single energy minimum in its interior, the saddle points being on the faces of this polyhedron. Multiple tetrahedra can be sequentially agglomerated in this manner. For the example of a low energy O-site, the four tetrahedra are combined into a single octahedron with a saddle point on each of its faces. Our KMC model can thus determine strain-dependent energy barriers for the diffusing species on-the-fly with the local environment of the species as the sole input.
In describing our KMC model thus far, we have presented the most general approach to computing energy barriers. To construct a computationally efficient model, though, it is useful to incorporate some a priori knowledge about the actual system and keep on-the-fly calculations to a minimum. First, it is reasonable to expect that the H-atom diffuses for the most part in a perfect but strained bcc lattice, except when it encounters defects. Therefore, a lot of computational effort can be saved if strain-dependent diffusion barriers can be precomputed and used in these defect-free regions. We demonstrate in Sec. III, using both DFT and EAM calculations, that simple parameterization of dissolution energies at T-sites and saddle points is indeed possible, at least for small to moderate strains. It is therefore possible to switch automatically from precomputed rates to on-the-fly calculations as the diffusing H-atom moves toward a defect, the transition being determined by a threshold that can be adjusted by numerical testing. As an example, a cutoff of 2% strain—more precisely, a cutoff of √ϵijϵij = 0.02—implies a switch from precomputed to on-the-fly rates at a distance of about 4 Burgers vectors from the core of a straight screw dislocation. This is adequate to determine barriers with greater precision near the core of the dislocation while reducing computational effort away from the core. Second, note that H is the smallest possible interstitial atom and that its interaction with Fe atoms is fairly localized. Specifically, our DFT calculations for the Fe54H supercell with H dissolved in a T-site indicate that the first coordination shell of four Fe atoms moves outward by 0.076 Å, while the second coordination shell moves outward by 0.012 Å. Therefore, it is only necessary to relax a ball of atoms around the H-atom, rather than the entire computational cell, to locate energy minima and compute dissolution energies. In our calculations, we use a ball of radius R MD + 2R C centered on the H-atom, atoms within R MD = 6.0 Å being free to relax while atoms in the outer shell, which is twice the cutoff radius R C = 3.5 Å of the EAM potential, being held fixed. This choice roughly corresponds to relaxing 84 atoms surrounded by 1000 fixed atoms, and we have ascertained that this produces the expected dissolution energies and diffusion barriers. Third, we note that to compute barriers it is necessary only to triangulate the domain locally around each H-atom. Hence, rather than triangulate the entire domain at the start, we apply an incremental Delaunay triangulation, which adds tetrahedra sequentially as the H-atom diffuses through the lattice. Of course, if the H-atoms move freely through the lattice, this eventually amounts to having to triangulate the entire domain. On the other hand, if diffusing atoms are strongly trapped in the vicinity of defects, this incremental approach can lead to further computational savings. Finally, for simplicity, the H–H interaction is taken into account only by site-blocking, i.e., disallowing two or more hydrogen atoms to occupy the same energy minimum. This approximation may be justified by noting that the interaction between interstitially dissolved H atoms is weakly repulsive, which precludes cluster formation. Moreover, we will not consider any situations, at present, where H2 gas formation may occur (e.g., at internal cracks or voids). Ignoring H–H interactions is not essential in any way and can be easily dispensed with for diffusion in the bulk; accounting for desorption and formation of H2 molecules would simply require the inclusion of additional events in the KMC list.
III. RESULTS AND DISCUSSION: PARAMETERIZATION OF ENERGY BARRIERS AND APPLICATIONS OF KMC TO BULK DIFFUSION
The parameterization of energy barriers as a function of the local strain using PAW–DFT–GGA is presented first and compared to results from the EAM. (To maintain consistency with DFT calculations, all EAM calculations reported in this section are also performed on a periodic Fe54H cell; the simulation package LAMMPSReference Plimpton67 is employed for this purpose.) Thereafter, the KMC model is applied to H diffusion in an α–Fe lattice containing vacancies, followed by another example of diffusion in the presence of a screw dislocation dipole. Effective diffusion coefficients as a function of temperature are extracted from the computations and validated using the standard theory of trapping at lattice defects.Reference Kirchheim13, Reference McNabb and Foster21, Reference Oriani22, Reference Krom and Bakker26
A. Diffusion barriers from DFT calculations
To compute diffusion barriers, we must first ascertain the minimum energy sites and possible pathways between them. The two candidate minima are the T1 site (see Fig. 1) and the O-site; we analyze their relative stability as a function of lattice strain. In particular, we analyze three distinct deformation modes: volumetric expansion (hydrostatic loading), uniaxial tension, and simple shear. With reference to the axes in Fig. 1, the applied deformation gradient for each of these cases may be expressed as Fh = (1 + ϵ)I, Fu = I + ϵe2 ⊗ e2, and Fs = I + γ e1 ⊗ e2, respectively, where I is the identity tensor of rank three, ϵ and γ are the applied stretch and shear, ei is the unit vector along Cartesian coordinate Xi, and ⊗ denotes the tensor product. Among the various possible choices of uniaxial and shear deformation, the two indicated here were chosen because these induce the most change in distance between the O-site and the nearest (axial) Fe atoms (see Fig. 1). Because H–Fe interactions in the bulk are repulsive, these deformations will have the greatest influence on the dissolution energy of H in the O-site. Table I displays the dissolution energy of H in T-sites and O-sites as a function of the three deformation modes. It is immediately apparent across the entire range of calculations that the O-site is 0.1–0.2 eV higher in energy than the T-site. Remarkably, the dissolution energy is unaffected by the application of shear strain, even up to 10%. For hydrostatic and uniaxial strains, the dissolution energy increases with compressive strains and decreases with tensile strains. Given that H–Fe interactions in the bulk are repulsive, this trend is entirely as anticipated. Tensile strains increase the distance between interstitial sites and the Fe atoms (or, alternatively, enlarge the “volume” of the interstitial site), thereby lowering the dissolution energy. Conversely, compressive strains lead to greater H–Fe repulsion, which raises the dissolution energy. We may therefore conclude from these results that the T-site is the energetically preferred dissolution site for hydrogen in a perfect α–Fe lattice over a small to moderate range of strains.
Dissolution energy E d = E(Fe54H) − E(Fe54) − E(H2)/2 (in eV) of hydrogen in the T-site and O-site as a function of lattice strain computed with PAW-DFT-GGA.

Schematic illustration of a bcc lattice (a) showing 4 T-sites and 1 O-site on the front face and (b) an exploded view of the tetrahedra that contain these 4 T-sites. The O-site does not belong to the interior of any tetrahedron and lies instead on the common edge between the 4 tetrahedra.

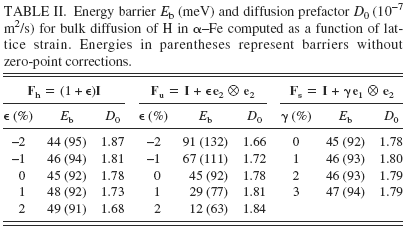
Having established site preference for H dissolution in Fe, we compute energy barriers E b and prefactors D 0 for bulk diffusion, which are displayed in Table II as a function of lattice strain. The diffusion constant at temperature T is given by the classical Arrhenius expression D = D 0 exp[E b/kT]. To compute the diffusion barrier for a hop between neighboring T-sites, three intermediate configurations between the initial (T1) and final (T2) state are created by linear interpolation of atomic positions. The supercells are then relaxed using the CI-NEB method, as noted in Sec. II. A, and the energy barrier computed as the difference in energy between the highest energy intermediate configuration and the initial configuration. Since H is a low mass atom, it is important to account for quantum corrections arising from zero point energy in these calculations of energy barriers; Fe, being much heavier than H, is held fixed in this calculation (infinite mass assumption). As seen from Table II, although the overall energy barriers are small, as expected for a small atom like H, inclusion of zero-point corrections leads to a significant decrease in barriers. The prefactor D 0, computed using harmonic transition state theoryReference Vineyard64 and a random walk model for interstitial diffusion in a BCC lattice,Reference Porter and Easterling68 is given by the expression
Energy barrier E b (meV) and diffusion prefactor D 0 (10−7 m2/s) for bulk diffusion of H in α–Fe computed as a function of lattice strain. Energies in parentheses represent barriers without zero-point corrections.
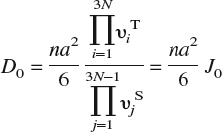
In this expression, n is the number of equivalent jumps (four for hops between T-sites in a bcc lattice); a = a 0/8 the jump distance, a 0 being the lattice constant of α–Fe; υiT the 3N real-valued normal mode frequencies at the T-site; and υjS the 3N − 1 real-valued normal mode frequencies at the saddle point. (In principle, D 0 should also contain a vibrational entropy contribution exp[S vib/k]. We find from our DFT calculations that exp[S vib/k] ≈ 1 and hence omit this term.)
We observe in Table II that the prefactors are relatively insensitive to strain and all of these lead to jump frequencies on the order of 1013/s. In contrast, the strain dependence of the energy barriers is clearly discernible and is of greater importance due to the exponential dependence of the diffusion constant on the barrier. Just as the strain dependence of the dissolution energy in the T-site was explained previously in terms of the change in volume of the T-site and the accompanying effect on H–Fe interactions, the strain dependence of energy barriers can be understood by considering both the change in volume of the T-site and the change in area of the face containing the saddle point (referred to henceforth as the “saddle face”). First, note that the application of shear has no effect on the energy barrier; in essence, shearing the cell does not significantly alter either the volume of the T-site or the area of the saddle face. The dissolution energy of H in these sites is therefore unaffected, and hence the barrier remains unaltered. Second, in case of hydrostatic loading, both the area of the saddle face and the volume of the T-site are equally altered. Volumetric expansion lowers the dissolution energy both at the T-site and saddle point while compression increases both these dissolution energies. The synchronous change in dissolution energies is such that the net barrier remains the same. Finally, in case of uniaxial loading, the change in area of the saddle face is more pronounced than the change in T-site volume. This translates into a stronger effect on saddle point energy than on T-site energy. The barrier then shows a clear dependence on the applied strain.
The qualitative interpretation of strain dependence of energy barriers given above can be made more precise by measuring the actual changes in saddle face area and T-site volume as functions of applied strain and relating these to the dissolution energy at the saddle point and T-site, respectively. Table III displays results from these calculations; note that we report the relative change in circumradius of the saddle face/tetrahedron, which is a direct measure of distortion, as a function of applied strain. To compute the relative change in circumradius, note that the position vector x of an atom in the deformed configuration is expressed in terms of the deformation gradient F and the position vector X in the undeformed configuration as x =FX. Applying the relevant deformation gradient Fh, Fu, or Fs to the position vectors of the vertices of a tetrahedron/face, the circumradius in the deformed configuration, and hence the relative change with respect to the circumradius in the undeformed configuration, are easily computed.
Dissolution energy of H in Fe at the T-site (E d) and the saddle point (E S) and the energy barrier (E b) as a function of lattice strain. The relative change in circumradius of the tetrahedron (Δr T) and the saddle face (Δr S), which is a measure of the change in volume of the T-site and area of saddle point with applied strain, respectively, is also tabulated. For purposes of comparison, the corresponding values from the EAM potential are listed in parentheses. All DFT energies have been corrected for zero-point vibrations.

As seen from the values in Table III, the relative change in saddle face area as compared to tetrahedron volume is most pronounced for uniaxial strains, which explains the stronger strain dependence of the energy barrier. The lack of shear strain dependence (up to 10%) of the energy barrier is also easy to understand now, given the negligible change in saddle face area and T-site volume during shear. For comparison, we also include in Table III energies computed using the Fe–H EAM potential for a periodic Fe54H cell. Since the empirical EAM potential that we use for all on-the-fly KMC calculations is fit only to bulk properties, a comparison with DFT calculations over a range of strains, albeit for defect-free lattices, gives us some estimate of the reliability, or lack thereof, of the empirical potential.
The DFT and EAM dissolution data from Table III are displayed in Fig. 2, as a function of relative change in circumradius. On the whole, it is clear from the data that the EAM dissolution energies show lesser strain-sensitivity than their DFT counterparts. Looking more closely at the data, we also note that the EAM energy barriers are typically within 10–20 meV of the DFT barriers (although the case of −2% hydrostatic strain presents an inexplicably large deviation). Given that (i) DFT energy differences themselves are no more accurate than ±20 meV and (ii) an error of ±20 meV causes jump rates to differ by a factor of 1.5–2 over a range of 300–600 K, we conclude that the EAM description will likely suffice for bulk diffusion calculations. Of course, there is no a priori guarantee that the potential is reliable at defects; careful case-by-case studies of H-defect energetics are needed for this purpose and should be compared against more accurate methods (such as DFT). We consider a subset of such H–defect interactions further below.
Dissolution energy of H in Fe at the T-site (E d) and the saddle point (E S) as a function of the relative change in circumradius of the tetrahedron (Δr T) and the saddle face (Δr S), respectively. The linear fits, which serve as a guide to the eye, indicate that dissolution energies computed from EAM are less sensitive to strain than those from DFT calculations.

As noted previously, parameterizing the energy barrier (or equivalently the dissolution energies) as a function of strain can lead to significant computational savings. From the above results, it is clear that the dissolution energy, at least for small strains, is only a function of the diagonal components of the strain tensor. Note that the tetragonal symmetry of the T-site implies that there are two distinct responses for the diagonal components. For example, for the T1 site (see Fig. 3) the x 2 and x 3 directions are equivalent, whereas the x 1 direction is distinct. Hence, the dissolution energy has the same functional dependence on ϵ22 and ϵ33, and is different from that for ϵ11. We have the choice of using dissolution energies from either DFT or EAM in the fitting procedure. However, since the on-the-fly calculations rely on the EAM potential for energy minimization, there will be a discontinuity when the transition is made from precomputed energy barriers to on-the-fly barriers if the former are obtained from DFT. Again, referring to Table III and the discussion in the preceding paragraph, this is not expected to result in egregious errors. Nevertheless, for the sake of consistency, we use EAM data to carry out the parameterization of dissolution energies, thereby minimizing the possibility of discontinuities when making the transition from precomputed to on-the-y barriers. When fitting the dissolution energy to the diagonal strain components, we have found that a linear fit is too simplistic, and we need to retain at least second-order terms to obtain energies within 20 meV. For dissolution in the T1 site, the dissolution energy is approximated by E d = 0.3116 − 2.088ϵ11 − 4.340(ϵ22 + ϵ33) − 60.0(ϵ222 + ϵ332), with the strain components referring to the axes indicated in Fig. 3; dissolution energies in the other T-sites follow from symmetry. Similarly, the saddle point energy on the triangular face V1V2V3 shown in Fig. 3 is approximated by E S = 0.3486 − 5.937ϵ22 − 2.562 ϵAA, where ϵAA is a tensile strain along the symmetry axis A of the face; the other saddle point energies follow from symmetry. These approximations are used when √ϵijϵij ⩽ 0.02, in which case errors engendered are within 20 meV. For √ϵijϵij > 0.02, we switch to on-the-fly calculations with the EAM potential.
Schematic illustration of tetrahedral site (T1). The vertices, in terms of the lattice constant a 0, are V1 = a 0 (½, −½, ½), V2 = a 0 (½, ½, ½), V3 = a 0 (0, 0, 1), and V4 = (0, 0, 0). Due to tetragonal symmetry, the dependence of the T-site dissolution energy on strain components ϵ22 and ϵ33 is identical and different from that for ϵ11. The symmetry axis of the face V1V2V3 is denoted by A. The dissolution energy at the saddle point on face V1V2V3 is parameterized as a function of ϵ22 and the strain ϵAA along axis A (see text).

B. Bulk diffusion of H with traps
Having discussed the details of the computational procedure and ascertained the quality of the EAM potential for modeling bulk diffusion, we now present applications of our model to diffusion in defective lattices. Specifically, we first consider diffusion of hydrogen in a lattice with a screw dislocation dipole followed by diffusion in a lattice with vacancies. These defects function as trapping sites for hydrogen, and there exists a well-established analytical frameworkReference McNabb and Foster21, Reference Oriani22 to model the effect of traps on bulk diffusion. Prior computational studies by Kirchheim,Reference Kirchheim13, Reference Kirchheim24 who used Monte Carlo simulations to study interstitial diffusion and trapping in lattices, have already established the validity of these analytical models in regimes of low trap occupancy and low H concentration. It is not our purpose here to critically analyze these trapping models, but merely to establish that our KMC procedure faithfully reproduces the expected behavior within regimes of applicability of these analytical models. Our KMC model is of much wider applicability and does not require assumptions such as low trap occupancy and low H concentration, among others. Additionally, the model automatically accounts for correlations, induced by the elastic fields of defects, between saddle point and T-site energies.Reference Kirchheim13, Reference Kirchheim24
In the presence of saturable traps, under conditions of low hydrogen concentration, low trap occupancy, constant trap density and temperature, and constant saddle point energy, the effective diffusivity of hydrogen may be estimated asReference Oriani22
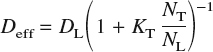
where D L = D 0 exp[−E b/kT] is the usual bulk diffusivity in a perfect lattice, N T is the number of traps per unit volume, N L is the number of interstitial sites per unit volume, and K T = exp[−ΔE/kT] is the equilibrium constant for the reversible reaction [H]T-site ⇆ [H]trap. The quantity ΔE is the trap binding energy, which is defined as the difference between the dissolution energy at the trap site and that at a bulk interstitial site. In a bcc lattice, there are six T-sites per atom: thus, for α–Fe, which has a lattice constant at room temperature of 2.8665 Å,Reference Johnson and Oh69N L = 0.85 mol/cm3.
The diffusion constant D can be measured from a KMC calculation by employing the Einstein expression

where r is the position vector without wrap-aroundReference Rapaport70 of a diffusing particle and 〈⋅〉 denotes the average over all particles. Note that the diffusion constant as defined here is the tracer diffusion constant, but in the dilute limit, it also may be identified with the chemical (Fick’s law) diffusion constant.Reference Fukai17, Reference Faux and Ross71 Following Kirchheim,Reference Kirchheim13, Reference Kirchheim24 we measure the diffusion constant Di = 〈[r(ti)–r(0)]2〉/(6ti) over successive short intervals (or KMC steps) of time ti and average this over the entire simulation of duration t = ti to obtain the diffusion constant D = Diti/t. Also, the initial positions r(0) for trajectory i + 1 are set to the final positions r(ti) from trajectory i, which effectively allows for sampling over different initial conditions.
1. Trapping by dislocations
The first example we consider is trapping of diffusing H atoms by screw dislocations. We choose to study screw dislocations since their dominant strain fields are antiplane shear. From the discussion in Sec. III. A, it is clear that such fields will have little or no influence on diffusion barriers, except possibly in the immediate vicinity of the dislocation core where deformations are large. Thus the dislocation core itself is the main source of trapping and not its associated elastic fields.
Our simulation cell consists of 106 Fe atoms. The cell vectors are along the [¯111], [1¯11], and [11¯1], directions, the cell being 100 Burgers vectors in length along each of these directions. Periodic boundary conditions are imposed along the cell vectors; this eliminates the possibility of segregation of hydrogen to free surfaces and allows us to focus on bulk diffusion in the presence of traps. To maintain periodic boundary conditions, we cannot introduce a single screw dislocation in the cell and must, at minimum, introduce a dipole. An infinitely long screw dislocation dipole with Burgers vector ½[¯111] is introduced on a (110) slip plane by displacing the atoms according to the linear elastic solution.Reference Hirth and Lothe72 Using the EAM potential, the simulation cell is then relaxed in LAMMPSReference Plimpton67 via the conjugate gradient method until the relative change in cell energy is less than 10−4. In its fully relaxed state, the screw dislocation core becomes non-planar and develops threefold symmetry about the [¯111] direction as shown in Fig. 4.
(a) Differential displacement map of a [¯111]/(110) screw dislocation core. The dotted lines are a guide to viewing the threefold symmetry. The solid squares indicate, schematically, the three deepest traps with binding energy of −0.45 eV (after 39). (b) Effective diffusion constant as a function of temperature in the presence of a screw dipole. The squares represent the measured values from KMC simulations. The solid line represents the calculated values from trapping theory with ΔE = −0.45 eV and 3 trapping sites per Burgers vector. The triangles represent the values obtained from a naïve calculation using strain-parameterized diffusion barriers throughout the cell. Clearly, the latter approach produces grossly incorrect diffusion constants thereby illustrating the need for on-the-fly calculations at defects.

Recent DFT calculationsReference Frederiksen and Jacobsen73, Reference Domain and Monnet74 indicate that the screw dislocation core in bcc Fe is sixfold, compact, and non-degenerate in contrast with the threefold, dissociated, and degenerate structure obtained with the EAM potential used in this work. While the distribution of binding sites and binding energies at the core is intimately connected to the core structure, and thereby the interatomic potential, the on-the-fly method developed here is only concerned with locating these binding sites and accurately capturing the binding/unbinding of H atoms. Hence, the discrepancy between the EAM and DFT core structures bears no particular significance in this work.
Wen et al.Reference Wen, Fukuyama and Yokogawa39 have extensively investigated the location and energies of traps around the threefold, dissociated dislocation core; the deepest traps of binding energy 0.45 eV are indicated schematically in Fig. 4. We find these sites to be the main sources of trapping in our KMC simulation, with other traps being of less significance. Hence, there are three traps per length of dislocation line and N T = 8.5 × 10⁻⁵ mol/cm3 ≈ 1025/m3. Kumnick and JohnsonReference Kumnick and Johnson23 estimate trap densities in iron to range between 1021/m3 (annealed) to 1023/m3 (60% cold work); OrianiReference Oriani22 estimates trap densities in steel to be of the order of 1025/m3, although it has been suggestedReference Krom and Bakker26 that this includes the effect of voids induced by hydrogen damage.
We introduce 50 H atoms (N H = 50) randomly in T-sites into the simulation cell, which corresponds to a concentration of 7.1 × 10⁻⁶ mol/cm3. The maximum possible fractional occupancies of normal interstitial sites and trapping sites is N H/(N L − N T) ≈ N H/N L = 8.3 × 10⁻⁶ and N H/N T = 8.3 × 10⁻², respectively. Thus, the concentrations and occupancies are dilute enough to use trapping theory to compute effective diffusivities analytically. Deviations from trapping theory, if any, must then be attributable to the existence of multiple traps of differing energies and possible correlations with saddle point energies. The diffusion prefactor D 0, or equivalently the jump rate J 0, is relatively insensitive to strain, as demonstrated in Sec. III. A. From the data in Table II, we may therefore infer an average jump rate J 0 = 2.6 × 10¹³/s. An experimental measurement of D 0 = 5.12 × 10⁻⁸ m2/s for H diffusion in very pure Fe in the temperature range 283–348 K,Reference Grabke and Riecke20 yields a jump rate J 0 = 7.6 × 10¹²/s. Hence, in this and all subsequent KMC simulations, we set the jump rate to be 1013/s.
Figure 4 displays effective diffusion constants as a function of temperature both as obtained analytically from trapping theory [using ΔE = −0.45 eV and N T = 8.5 × 10⁻⁵ mol/cm3 in Eq. (4)] and from KMC simulations. It is immediately apparent that the analytical and simulated results are in excellent agreement, and this provides a first validation of the KMC model. The agreement also suggests that in this instance, the weaker traps are of less importance, alluded to in the preceding paragraph, as are correlations between saddle point and interstitial site energies. The simulations were typically run for 108–109 KMC steps, which correspond to times of 5 × 10⁻⁴ to 2 × 10⁻⁶ s for temperatures ranging from 300 to 600 K. The diffusivities are usually converged at a tenth of these times. It is worth noting that such time scales are well beyond the reach of conventional molecular dynamics. Figure 4 also displays the results of a naïve simulation, which eliminates on-the-fly calculations altogether and uses strain-parameterized diffusion barriers throughout the lattice. As seen, this approach severely underestimates the diffusion constants (indicating excessively strong binding to the dislocation cores), thereby underscoring the utility of the on-the-fly method for accurate calculations of energy barriers at defects.
2. Trapping by vacancies
The next example we consider is of trapping of H atoms by vacancies. A vacancy in α–Fe is associated with six binding sites located along 〈100〉 directions between the O-site and the vacancy. Previous experimental and theoretical (effective medium theory) studies have shown that the binding site is displaced by 0.4 Å from the O-site toward the vacancy, with an H-binding energy, relative to a bulk T-site, of 0.63 eV.Reference Besenbacher, Myers, Nordlander and Nørskov75, Reference Nordlander, Nørskov, Besenbacher and Myers76 These studies also indicate that the binding energy is maximum when a single H atom is trapped at a vacancy and decreases with trapping of additional H atoms. The trapping process remains exothermic, though, which suggests that up to VH6 (six H atoms bound to the vacancy) should be energetically preferable. However, recent DFT-GGA calculations of Tateyama and OhnoReference Tateyama and Ohno66 indicate that trapping is endothermic for VHn complexes when n ⩾ 4 and only weakly exothermic for n = 3. Therefore, VH2 should be the preferred complex at low hydrogen partial pressures. Tateyama and Ohno found that the H atoms trapped at the vacancy saturate Fe broken bonds through the formation of Fe 3d–H 1s bonds. The formation of these states leads to charge transfer from Fe to H, which then leads to Coulomb repulsion between the negatively charged H atoms. Thus the optimal H–vacancy complex is determined by a competition between metal–H bonding and Coulomb repulsion. Such electronic interactions cannot be captured by the EAM potential used in this work; in fact, the H–H two-body interaction term leads to weak attraction between H atoms trapped at the same vacancy. Therefore, to simulate this situation in our KMC calculations, we artificially restrict the maximum number of H atoms that can be trapped at a vacancy by blocking adjacent trapping sites once an H atom is bound to the vacancy. This ensures that only VH and dumbbell-shaped VH2 clusters are possible. Of course, removing this restriction trivially allows for complexes up to VH6.
As before, we start with a simulation cell of 106 Fe atoms into which 100 vacancies are randomly introduced. The cell is relaxed in LAMMPS, and thereafter 50 H atoms are randomly introduced in normal T-sites. Two situations for trapping are considered. In the first scenario, we do not restrict the number of H atoms that can be bound by a vacancy; this leads to 600 trap sites with the same trap density N T = 8.5 × 10⁻⁵ mol/cm as the screw dipole case. In the second scenario, we block trap sites adjacent to a trapped H atom; the total number of traps is therefore no longer fixed and varies between 600 (no trapped H) and 350 (all VH complexes). The assumption of constant trap density that is inherent in the analytical derivation of effective diffusivities is therefore violated. Figure 5(a) displays the results for the effective diffusion constant as a function of temperature for the two trapping situations along with the result from trapping theory, which is expected, at the least, to agree with the first scenario (no trap blocking). It is immediately apparent that there is a marked discrepancy between the analytical and numerical results when energy barriers are computed on the fly. The discrepancy exists for both trap-blocking and non-trap-blocking cases, thereby indicating that this is not a consequence of variations in trap density over the course of the simulation. Furthermore, the assumptions of low hydrogen concentration, low trap occupancy, and constant temperature that are made when analytically deriving effective diffusivities are all met in these simulations; the only remaining assumption in the trapping theory model that needs to be verified is that of constant saddle point energies. The simplest way to check if variations in saddle point energies are responsible for the observed discrepancies is to artificially restrict the saddle point energy to remain at the (unstrained) bulk value of 0.34 eV. It is immediately apparent [Fig. 5(a)], that this procedure produces better agreement between analytical and numerical results. Next, to check whether the saddle point (and T-site) energies are correlated with the stress fields of the vacancies, we also carried out simulations with unrelaxed cells [Fig. 5(b)], in which case the vacancies merely function as traps without elastic fields. As evident from Fig. 5, the results for the relaxed and unrelaxed cells, both with on-the-fly as well as fixed saddle point energies, are essentially indistinguishable. The logical conclusion, therefore, is that the source of the discrepancy is related to energy barriers in the immediate vicinity of the vacancy. This is examined in more detail next.
Effective diffusion constant as a function of temperature in the presence of vacancy traps (a) for an initially relaxed cell and (b) for an initially unrelaxed cell, in which case there are no stress fields associated with the vacancies. The solid line represents the calculated values from trapping theory with ΔE = −0.59 eVReference Wen, Xu, Fukuyama and Yokogawa46 and 6 traps per vacancy. The label “otf” refers to the situation where the saddle point energy is computed on the fly. The label “bv” refers to the situation where the saddle point energy is artificially constrained everywhere to the bulk value, in which case the analytical results from trapping theory are expected to hold. Results are displayed for “otf” and “bv” cases with and without blocking of adjacent vacancy trap sites by bound H atoms.

We examined the energetics and kinetics of H-trapping at a vacancy using both DFT and EAM approaches. In these calculations, we used Fe53 and Fe53H supercells (i.e., our previous Fe54 and Fe54H supercells with a vacancy) and relaxed only ionic positions, keeping cell vectors fixed. While the defect density is undoubtedly high, Tateyama and OhnoReference Tateyama and Ohno66 find that the difference in vacancy formation energy is less than 0.1 eV when the cell size is increased from 54 to 128 atoms. At any rate, since we use the same supercell for both DFT and EAM calculations, effects related to cell-size and high defect densities are expected to be identical. As shown in Fig. 6, there are four T-sites from which an H-atom can hop to a vacancy binding site. The dissolution energy at these T-sites, defined as

is found to be 0.29 eV with EAM and 0.21 eV from DFT. (From this point on, all DFT results include zero-point corrections unless explicitly stated otherwise.) Recall that the dissolution energies in bulk sites are 0.31 eV with EAM and 0.33 eV from DFT. The dissolution energy near the vacancy decreases, as expected, since the vacancy acts as a source of negative pressure, which then leads to larger T-site volumes in its vicinity. The DFT result is also seen to be much more sensitive to the vacancy than that from EAM. The H–vacancy binding energy, referenced to a bulk T-site, is 0.58 eV with EAM and 0.71 eV from DFT. The dissolution energy, as defined above, at the binding site is therefore −0.27 eV from EAM and −0.38 eV from DFT (both exothermic).
(a) Schematic illustration of 4 neighboring bulk T-sites from which hops to a vacancy binding site can occur. The binding site is displaced by δ = 0.4 Å from the O-site toward the vacancy.Reference Myers, Baskes, Birnbaum, Corbett, DeLeo, Estreicher, Haller, Jena, Johnson, Kirchheim, Pearton and Stavola14 (b) The saddle point for the hop from a neighboring T-site to the binding site is located on the (shaded) common face between the tetrahedron containing the T-site of interest and the octahedron that contains the binding site.

Finally, we examined the transition state for the hop between the vacancy binding site and its adjacent T-site. A CI-NEB calculation was performed in VASP, as before, to locate the saddle point. The energy barrier for the hop from the T-site to the binding site was found to be 33 meV, whereas the energy barrier for the reverse hop was found to be 0.65 eV. To determine the saddle point energy with EAM, we constrained the H atom to the common face between the tetrahedron containing the T-site and the octahedron containing the vacancy binding site (Fig. 6). The energy barriers were found to be 0.11 eV for the hop from the T-site to the binding site and 0.69 eV for the reverse hop. Clearly, the EAM and DFT results for the hop to the trap differ by more than a factor of three, whereas the reverse hops are nearly equivalent in energy. Therefore, within the KMC simulation, which employs the EAM potential to compute barriers in the vicinity of the vacancy, a diffusing H atom sees a much higher barrier as it approaches the trap and is reflected with a high probability. In contrast, the DFT result suggests that the hop to the trap, which requires 33 meV, is slightly lower in energy than hops in the bulk, which require 45 meV. Hence, we believe that it is this spurious energy landscape produced by EAM near the vacancy that causes effective diffusivities to differ significantly from analytical results at low temperatures. At higher temperatures (⩾500 K), there is sufficient thermal energy available to the diffusing H atoms to overcome the high barriers, which leads to better agreement, as seen from Fig. 5.
It should be noted that the EAM saddle point configuration was not produced using a transition state search (such as NEB/CI-NEB); this might lead to the conclusion that the saddle point was perhaps wrongly identified to begin with. In the case of hops between bulk T-sites, symmetry arguments can be readily invoked to conclude that the saddle point must lie on the common face of the two tetrahedra. In the present instance where the hop is between a T-site and a (displaced) O-site, it may be argued that the saddle point should still lie on the common face, as the dissolution energy of H should be maximum when the distance to the nearest neighbor shell of Fe atoms is minimum, given that the H–Fe interaction in the bulk is repulsive. To bolster this intuitive argument, we have carefully examined the transition state from VASP CI-NEB calculations and ascertained that the H atom is indeed coplanar (within numerical error) with the three nearest-neighbor Fe atoms. Therefore, we believe that the high EAM barrier for the hop from the T-site to the vacancy binding site is not the result of an error in identifying the saddle point, but an artifact of the potential itself.
3. Trapping by vacancies: EAM-based on-the-fly KMC with DFT barriers at vacancies
To resolve the discrepancy between the simulated and analytical results for diffusion in the presence of vacancies, we must, at the least, eliminate the spurious EAM energy barriers at the vacancy. As a first attempt at addressing this issue, we correct for only a few simple mechanisms: (i) hops to and from a vacancy, (ii) hops to and from VH complexes with adjacent binding site occupancy disallowed (site blocking), and (iii) hops between vacancy binding sites. The energy barriers for these mechanisms,Reference Ramasubramaniam and Carter77 computed using CI-NEB in VASP, are displayed in Table IV. These DFT barriers are now incorporated via a rate table within the KMC model for hops to, from, and between vacancy binding sites, and the on-the-fly EAM approach is used elsewhere. The trap binding energy ΔE = −0.69 eV is now the DFT dissolution energy at the vacancy binding site (−0.38 eV) referenced to the EAM bulk dissolution energy (0.31 eV).
Energy barriers from DFT (EAM values in parentheses) for H binding to and unbinding from a vacancy and VH complex, and for H hopping between adjacent vacancy binding sites. For the VH → VH2 case, the second H atom is assumed to hop to the binding site directly opposite the site occupied by the first H atom, i.e., occupancy of adjacent vacancy binding sites is disallowed.

Figure 7 displays the results for the effective diffusion constant as a function of temperature as obtained from the DFT-corrected KMC simulations along with the results from trapping theory. Note that trapping theory, in its simplest form, is strictly inadmissible since site blocking causes the number of traps to vary as a function of trapped H atoms. However, a naive estimate using 600 and 350 traps, which are the maximum (no trapped H) and minimum (all VH complexes) number of available traps, respectively, indicates (Fig. 7) that the difference is too insignificant to merit a more detailed theoretical analysis here. It is immediately apparent that the DFT corrections at the vacancy significantly resolve the previous discrepancy between the analytical and numerical results for effective diffusivities, the agreement from 400–600 K being excellent. At lower temperatures, there is a discrepancy by a factor of 10–100, which is still a significant improvement over previous discrepancies (factors of 103–104). Since we have yet to map out the energy landscape in more detail beyond the first neighbor shell of T-sites around the vacancy, we are not in a position to speculate whether this residual discrepancy has a sound physical basis or is just another artifact of the EAM potential. At any rate, this example demonstrates that incorporating a small set of accurate data at defects, where empirical potentials can be expected to be less reliable, can go a long way in improving the accuracy of empirical potential based on-the-fly KMC methods.
Effective diffusion constant as a function of temperature in the presence of vacancy traps. The simulation cell is fully relaxed prior to the KMC calculation. The simulation uses DFT-based energy barriers for hops to and from vacancies and VH complexes and between vacancy binding sites; EAM is used elsewhere. The trap binding energy is ΔE = −0.69 eV. The solid and dashed lines indicate the analytical results from trapping theory for 600 sites and 350 sites, which are the maximum and minimum number of available traps, respectively (see text). Numerical results are shown for two initial conditions: (1) a random distribution of H atoms (squares) and (2) all VH or VH2 complexes (triangles).

IV. CONCLUDING REMARKS
In summary, we have developed an off-lattice, on-the-fly KMC model for simulating stress assisted diffusion and trapping of hydrogen in bcc iron. Given an interatomic potential, barriers to diffusion are computed by performing local energy minimization calculations on a ball of atoms surrounding the diffusing H atom. This minimization procedure is computationally inexpensive, due to the small number of degrees of freedom, and yet is accurate since H–Fe interactions are fairly localized in nature. Because the actual atomic configuration is used to compute energy barriers, these barriers are automatically sensitive to stress-gradients arising from lattice defects and boundary conditions. The other advantage of directly using atomic configurations within an off-lattice approach is the ability to handle trapping of H at lattice defects at no extra cost. To speed up the KMC calculations, on-the-fly calculations are supplemented with precomputed strain-dependent energy barriers, which are used in defect-free parts of the crystal at small strains. These precomputed barriers are obtained with high-accuracy DFT and EAM calculations, the latter being in reasonable agreement with the former. The DFT calculations thus serve as a check on the EAM potential, which is fit only to bulk equilibrium properties. As a demonstration of the KMC model, we have presented examples of bulk diffusion of H in an α–Fe lattice containing a screw dipole and vacancies, both of which have well-known trapping energies. The results from KMC simulations and theory are found to be in good agreement for trapping at screw dipoles. For the case of trapping at vacancies, the results from purely EAM-based calculations show a marked disagreement with theory for the most part. The cause of this disagreement is attributed to spurious energy barriers from the EAM potential at vacancies. DFT calculations are invaluable in ascertaining the cause of this discrepancy and subsequently for replacing these erroneous values with correct energy barriers. The resulting KMC calculations with DFT-based corrections at vacancies are in much better accord with theory.
The focus of this article has been on outlining the development of the on-the-fly KMC model and demonstrating its efficacy for simulating diffusion over long time scales. In subsequent work, we will extend our model to simulate quasistatic crack propagation in α–Fe single crystals. The adsorption of H at crack flanks, its absorption in the bulk, and its trapping by stress-fields/defects near the crack tip can all be handled by the approach developed here. The key issue, in our estimation, will be the accuracy of the H–Fe interatomic potential, as is always the case for any empirical potential based atomistic simulation. As seen in this work, even though the H–Fe potential was fit to reproduce the measured vacancy binding energy, the barrier for hopping to the vacancy binding site is grossly incorrect. Therefore, some caution will have to be exercised when ascertaining barriers for absorption into the bulk, and vice versa, at free surfacesReference Jiang and Carter19 (e.g., crack flanks). Similarly, it is not clear whether the potential will accurately describe pipe-diffusion along dislocation cores or diffusion along grain boundaries. It should be emphasized that this is not a shortcoming of the KMC model per se, which can readily incorporate a better interatomic potential should one become available. One noteworthy shortcoming of the KMC model is that true dynamics is not accounted for in any way. This is probably a reasonable approximation when simulating quasistatic processes, given that H has a very high diffusivity in Fe, and may be partially alleviated by a staggered KMC and lattice relaxation procedure. Using such methods in the future, we hope to address the issue of HEDE and HELP in α–Fe crystals and contribute to a better understanding of the microscopic mechanisms that govern these phenomena.
ACKNOWLEDGMENTS
We thank Prof. Weinan E for useful discussions. Computational resources were provided by the Arctic Region Supercomputing Center and the Maui High Performance Computing center. This work was supported by a grant from the Office of Naval Research (awarded to E.A.C.).



