1. Introduction
Landform evolution in tectonically active areas results from complex interactions between deformation and surface processes; as a result, specific geomorphological, structural and sedimentary features are developed (Graveleau et al. Reference Graveleau, Strak, Dominguez, Malavieille, Manighetti and Petit2015). The landforms developed in compressional and extensional regimes are uplifted or folded terraces, fault scarps, wind gaps, triangular facets and wine-glass valleys (Cotton, Reference Cotton1950; Avouac et al. Reference Avouac, Tapponier, Bai, You and Wang1993; Keller et al. Reference Keller, Zepeda, Rockwell, Ku and Dinklage1998; Gawthorpe & Leeder, Reference Gawthorpe and Leeder2000; Chen et al. Reference Chen, Lai, Lee, Suppe, Chen, Lin, Wang, Hung and Kuo2007). However, the landforms in strike-slip regimes are offset terraces and channels, beheaded streams, shutter ridges and sag ponds (Wesson et al. Reference Wesson, Helley, Lajoie, Wentworth and Borchardt1975). These depositional or erosional landform features are useful geomorphic markers that provide information of recent surface deformation mechanisms and kinematics (Burbank & Anderson, Reference Burbank and Anderson2001; Keller & Pinter, Reference Keller and Pinter2001). Previous studies show that active deformation in both the endogenic (crustal deformation) and the exogenic (surface processes) have been closely combined to address the natural mechanisms of topographic growth in compressional, extensional and strike-slip settings (F. Graveleau, unpub. Ph.D. thesis, Université Montpellier II, 2008; Graveleau & Dominguez, Reference Graveleau and Dominguez2008; Strak et al. Reference Strak, Dominguez, Petit, Meyer and Loget2011; Chatton et al. Reference Chatton, Malavieille, Dominguez, Manighetti, Romano, Beauprêtre, Garembois and Larroque2012; V. Strak, unpub. Ph.D. thesis, Université Pierre et Marie Curie, 2012; Graveleau et al. Reference Graveleau, Strak, Dominguez, Malavieille, Manighetti and Petit2015). In this paper, we present the morphological evolution of the tectonically active South Wagad Fault (SWF) zone. It is believed that the SWF is a northwards sidestepping contractional bend of the Kachchh Mainland Fault (KMF) (Biswas, Reference Biswas2005), forming a complex anastomosing deformation zone.
The SWF zone consists of two semi-concentric marginal faults which are bounded by the Adhoi and Khanpar faults in the south and by the Kanthkot and Chitrod faults in the north. Several folds of varying dimensions are associated with restraining bends. Such a complex deformation zone with converging and diverging (against the Principal Deformation Zone or PDZ) curved fault traces and folds in restraining bends suggests transpressional strike-slip movement (cf. Wilcox, Harding & Seely,Reference Wilcox, Harding and Seely1973). The aim of the present study is to build a kinematic model for a Riedel-fault pattern (Riedel, Reference Riedel1929) and its correlation with progressive deformation and seismicity within the SWF zone. The basic geometry of the Riedel structure consists of conjugate shear bands arranged in en échelon arrays, denoted R and R'. The R Riedel shears are generally the first subsidiary fractures to build the most prominent set. They develop at an acute angle, typically 10–20° with respect to the PDZ, clockwise to a dextral main fault and anticlockwise to a sinistral fault (Fig. 1). Their acute angle with the main fault indicates the direction of relative movement on the main fault. The R' shears are antithetic faults with a sense of displacement opposite to the bulk movement, oriented at a high angle (c. 75°), clockwise to a dextral and anticlockwise to a sinistral main fault, and conjugate with the R shears (Riedel, Reference Riedel1929; Tchalenko, Reference Tchalenko1968). The R' shears preferentially occur in the overlap zone between two parallel R shears and often connect these two R shears (Figs 1, 2a). They may develop with or after R shears (Cloos, Reference Cloos1930).
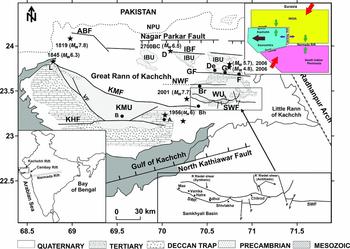
Location and geological map of Kachchh (modified after Biswas, Reference Biswas2005). A – Anjar; B – Bhuj; Bh – Bhachau; Br – Bharudia; D; Dholavira; De – Desaplar; F – Fatehgadh; G – Gedi; L – Lakhpat; KHF – Katrol Hill Fault; KMF – Kachchh Mainland Fault; SWF – South Wagad Fault; IBF – Island Belt Fault; GF – Gedi Fault; ABF – Allahbund Fault; VF – Vigodi Fault. Inset is the SWF zone. Uplifts: NPU – Nagar Parkar Uplift; IBU – Island Belt Uplift; WU – Wagad Uplift; KMU – Kachchh Mainland Uplift. Inset: right top corner showing slip mechanism of the Kachchh–Saurashtra block in response to the N–S compression due to the India–Eurasia plate motion (red arrows), the compressive forces along Kachchh and Narmada rift basins (green arrows) and the E–W divergence across the Cambay rift basin (violet arrows). The strike-slip motion of Kachchh and Saurashtra blocks is highlighted by single-head black arrows (modified after Rao, Rao & Rastogi, Reference Rao, Rao and Rastogi2013).

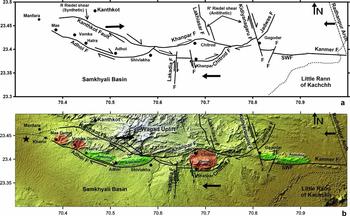
(a) Surface rupture pattern of South Wagad Fault (SWF) shows development of R and R' Reidel shear pattern. (b) Fault pattern of SWF superimposed on digital elevation model (DEM) of the zone. Solid thick arrows indicate slip direction of Principal Deformation Zone (PDZ). Dotted lines show possible westwards extension of the SWF. Anticlines and domes are represented by yellow and light red, respectively. Black star shows location of 2001 Bhuj main shock (M w 7.7).

The Riedel shear structure, first reported by Cloos (Reference Cloos1930) and Riedel (Reference Riedel1929) in clay-cake experiments, was considered to be a fundamental structure within shear zones. Such macro-scale fault systems associated with these R and R' shear structures generate earthquakes with strike-slip movement (Tchalenko, Reference Tchalenko1970; Moore, Reference Moore1979; Cunningham, Reference Cunningham1993).
The present study is focused on geometric characterization of the Riedel shear structure within the SWF zone in the Mesozoic formations. The cataclastic shear bands forming Riedel structures in sandstone are commonly termed deformation bands (Katz, Weinberger & Aydin, Reference Katz, Weinberger and Aydin2004). It is believed that the Riedel structure has a systematic correlation between the geometry, the distribution and the relative age (Katz, Weinberger & Aydin, Reference Katz, Weinberger and Aydin2004). This correlation may have significant implications to the shear zone architecture during accumulation of strain (Katz, Weinberger & Aydin, Reference Katz, Weinberger and Aydin2004).
2. Generalized tectonic setting and geological framework
The Kachchh rift was evolved within the middle Proterozoic Aravalli–Delhi fold belt by reactivation of pre-existing faults along the NE–SW trend of the Delhi fold belt that swings to E–W in the Kachchh region (Biswas, Reference Biswas2005). The Kachchh rift basin in the western pericratonic region of India evolved during early stages of the break-up of eastern Gondwanaland as the Indian and African plates rifted and drifted apart (Biswas, Reference Biswas, Sahni and Loyal1999). The western pericratonic region of India is highly fractured where three intersecting rift systems developed. The rift system consists of two sub-parallel E–W rifts, the Kachchh rift on the north and Narmada rift on the south, intersected by the NNW–SSE-trending Cambay rift on the east (Fig. 1). These rifts surround the central cratonic block of Saurashtra at the trailing edge of the Indian continental plate (Biswas, Reference Biswas1982, Reference Biswas, Sahni and Loyal1999). These rifts were opened sequentially from north to south (Biswas, Reference Biswas1982). The oldest Kachchh rift opened during Early Jurassic time in response to pre-break-up crustal distension in the initial stages of intercontinental rifting (Biswas, Reference Biswas1982). The rifting continued until Early Cretaceous time, when the Kachchh rift was aborted. The rifting of the Cambay Basin was then initiated, followed by Narmada rifting during Late Cretaceous time (Biswas, Reference Biswas1982, Reference Biswas1987). The Cambay and Narmada rifts are conjugate, related to mantle arching and the rise of the mantle plume at the Réunion hotspot during Late Cretaceous time. Kachchh rifting is an independent older event related to pre-break-up crustal distension (Ziegler, Reference Ziegler1992). The rift is bounded by the Nagar Parkar Fault (NKF) to the north and the North Kathiawar Fault (NKF) to the south. The rift shoulders are demarcated by uplifted Precambrian basement blocks (Biswas, Reference Biswas2005). The morphology of the rift is controlled by several intra-basinal sub-parallel strike-slip faults. Structurally, the basin contains footwall uplifts and half-grabens along intra-basinal strike faults (Biswas & Khattri, Reference Biswas and Khattri2002; Biswas, Reference Biswas2005). The uplifts are areas cropping out, and the grabens form extensive plains covered by Quaternary sediments. The uplifts are bounded by five parallel E–W-striking faults (Biswas, Reference Biswas1980). From north to south, these are: Nagar Parkar Fault (NPF); Island Belt Fault (IBF); South Wagad Fault (SWF); Kachchh Mainland Fault (KMF); and North Kathiawar Fault (NKF) (Biswas, Reference Biswas2005) (Fig. 1). Block tilting along these faults during rift phase extension gave rise to four sub-parallel linear ridges: Nagar Parkar Uplift (NPU); Island Belt Uplift (IBU); Wagad Uplift (WU); and Kachchh Mainland Uplift (KMU) (Fig. 1). These uplifts are extensively affected by several secondary faults of different generations. These faults appear to be cogenetic with the E–W faults. The E–W-striking master faults controlled the structural evolutions of Kachchh. The surface geometry of these faults shows a complex dextral strike-slip fault pattern.
Different generations of faults developed during episodic movement along the PDZ. This primary fault is dislocated by N–S-, NNW–SSW- and NE–SW-striking faults, mainly extensive wrench faults (Fig. 2a, b). The KMU is side-stepped to the north as WU along an E–W-striking KMF. The southern part of WU is tilted up along the complicated fault pattern (SWF) associated with folds (Fig. 2a, b). SWF is a fault zone consisting of two curved, semi-concentric marginal faults (Adhoi and Kanthkot faults) (Fig. 2a, b), bounding folds of varying dimension along restraining bends. Such a complex deformation zone with converging/diverging curved fault traces and folds in restraining bends suggests convergent wrench movement (Wilcox, Harding & Seely, Reference Wilcox, Harding and Seely1973; Goyal, Thakkar & Bhandari, Reference Goyal, Thakkar and Bhandari2015). The overlapping tips of both KMF and SWF dip steeply (80–85°) towards each other, forming a convergent transfer zone (Morley et al. Reference Morley, Nelson, Pattoon and Munn1990). Within the overlapping zone, the KMF fades out and propagates as a SWF towards the east.
The SWF zone is made up of Cretaceous shale, sandstone and glauconitic and micaceous sandstone on the upthrown block, and shale interbedded with marl and miliolitic limestone of Cenozoic–Tertiary age on the footwall side of the fault zone (Kothyari et al. Reference Kothyari, Rastogi, Morthekai, Dumka and Kandergula2016). The central and southern part of the study area is composed of Quaternary sediments in the Samkhiyali Basin (Fig. 2b) and also along the coastal region and little Rann of Kachchh.
3. The South Wagad Fault system
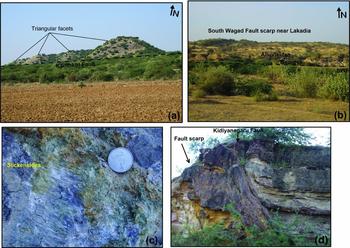
The Wagad region of eastern Kachchh is commonly known as the Wagad Uplift (WU). It covers an area of c. 2430 km2 and is drained by numerous ephemeral streams. The Wagad area comprises three major geomorphic units: (a) Wagad Uplift to the north; (b) Samakhyali Basin to the south; and (c) Little Rann of Kachchh to the SE (Fig. 1). The southern part of the WU is much faulted and appears to have been shattered and broken into several wedge blocks bounded by converging and diverging faults. These faults are collectively called the South Wagad Fault (SWF) system. The southern edge of the WU is tilted up along this system of faults. The fault system consists of Adhoi, Kanthkot, Chitrod, Khanpur, Lakadiya, Lakhiasar, Kidiyanagaru and Kanmer faults (Biswas, Reference Biswas1993) (Fig. 2b). Lakadiya, Lakhiasar, Kidiyanagaru and Jadwas faults are the oblique normal faults. The tectonic movement along these faults has resulted in displacement of the SWF at several places (Fig. 2b). The Kanthkot Fault is a NW–SE-trending normal fault, having a surface trace of about 25 km. Well-developed triangular fault facets are observed in the fault zone (Fig. 3a). The Lakadia Fault is a N–S-trending oblique normal fault having a surface trace of about 11 km. The fault plane dips moderately (52°) towards the east. The SWF has been right-laterally displaced along this fault (Fig. 3b). At a location north of Lakadia a truncated alluvial fan deposit has been observed along the SWF with vertical separation of c. 11 m. These alluvial fan deposits were resting over the Tertiary bedrock (Fig. 3b). Lakhiasar Fault is a NW–SE-trending strike slip fault with a surface trace of c. 10 km long. The fault zone is c. 2 km wide. Along the fault a 10–14 m high NW–SW-oriented fault scarp is developed. The Presence of slickensides parallel to the strike direction confirms its strike-slip nature (Fig. 3c). Kidiyanagaru Fault is a NNW–SSE-trending normal fault having a surface trace of c. 15 km long forming a 10 m high fault scarp. The fault plane dips moderately SW (65°; Fig. 3d). Further east of the N–S-trending Kidiyanagaru Fault, the SWF zone is represented by the NE–SW-striking Jadwas and E–W-trending Kanmer faults (Kothyari et al. Reference Kothyari, Rastogi, Morthekai, Dumka and Kandergula2016).
(a) Field photograph of Kanthkot Fault shows development of triangular facets along the fault. (b) An E–W active fault scarp north of Lakadia area showing truncation of alluvial fan. (c) Development of strike-parallel slickensides along Lakhiasar fault. (d) Field photograph of Kidiyanagaru fault.

Although many faults are described by local names, the Adhoi fault is the principal E–W-trending fault which passes between Mae, Adhoi and Khanpar. The Kanthkot, Khanpur, Lakadiya, Lakhiasar, Kidiyanagaru and Jadwas faults are synthetic and antithetic faults developed along with the main fault (Kothyari et al. Reference Kothyari, Rastogi, Morthekai, Dumka and Kandergula2016). These faults together define the SWF zone. These faults generated extensional and contractional wedges. The extensional wedge is located between the Mae–Vamka domes and Halrae–Adhoi anticline, and the contractional wedge is located between the Shivlakha anticline and Chitrod dome (Fig. 2b). To the east of the N–S-trending Kidiyanagaru transfer fault, the SWF zone is represented by the NE–SW-striking Jadwas fault and the E–W-striking marginal Kanmer Fault with normal separation, and associated with a chain of folding on the upthrown side (Biswas & Khattri, Reference Biswas and Khattri2002). Both faults fade out eastwards at the Radhanpur arch. The eastwards continuation of SWF beyond Kidiyanagaru Fault is the Kanmer Fault with normal separation between Wagad and Little Rann (on the downthrown block side). The SWF ends against the Kidiyanagaru transfer fault, and the Wagad block is uplifted due to resistance from the Radhanpur arch. Wagad uplift represents the eastern limit of the Banni half-graben, pushed up against the Radhanpur arch by strike-slip faulting.
Lithologically, the SWF zone consists of Cretaceous shale, sandstone, glauconitic and micaceous sandstone on the upthrown block, and shale interbedded with marl and miliolite limestone of Cenozoic–Tertiary age on the footwall side of the fault zone (Kothyari et al. Reference Kothyari, Rastogi, Morthekai, Dumka and Kandergula2016). The miliolite rocks are more terrigenous and are represented mostly by calcareous sandstones with varying proportions of detrital carbonate and foraminifera (Biswas, Reference Biswas1971; Fedden, Reference Fedden1984). The central and southern parts of the study area are composed of Quaternary sediments in the Samkhiyali Basin, along the coastal region and at Little Rann of Kachchh.
4. Genesis of South Wagad Fault system
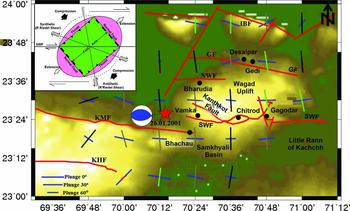
The SWF zone shows a complex morphology of anastomosing faults and several subsidiary shear fault segments (Fig. 2a, b). Within this zone, several R and R′ antithetic faults propagate a short distance and generate significant fault slip partitioning (e.g. Graveleau et al. Reference Graveleau, Strak, Dominguez, Malavieille, Manighetti and Petit2015). In such a complex zone, the principal fault remains active after the other faults develop. The synchronous movements on all faults accommodate higher strain in the fault zone (Fig. 2a, b). The Kanthkot Fault is the first subsidiary fault which is developed synthetic to the SWF, showing a sequence of linked displacement surfaces. However, the Lakadia, Lakhiasar and Kidiyanagaru faults were developed as secondary antithetic faults oriented at a high angle (Fig. 2a). The geometrical complexity of the SWF zone reflects a bulk strain that combines pure shear and simple shear parallel to the main fault. The pure shear component arises from the compressional or extensional component across the zone, and the simple shear component from the main fault (Woodcock & Fischer, Reference Woodcock and Fischer1986). Our results are well corroborated with the earlier published P and T axis of the fault plane solutions in the study region (Rao, Rao & Rastogi, Reference Rastogi, Mandal, Biswas and Talwani2014; Singh et al. Reference Singh, Zhao, Kumar and Mishra2016). The focal mechanisms in the KRB, mostly strike-slip, could be due to E–W-aligned shearing forces along the PDZ. The compressional and extensional component in the Wagad region could be due to maximum compression (P axis) aligned N–S and minimum compression (T axis) along the trend of the SWF. Nevertheless, the variation in the P and T axes in the vicinity of the 2001 Bhuj source zones reveals complexity in the fault zones. On the other hand, Singh et al. (Reference Singh, Zhao, Kumar and Mishra2016) argued, using 47 earthquake focal mechanisms in the KRB, that the spatial stress field inversion shows N–S orientation of the principal stress axis, consistent with the ambient tectonic stress field, due to the northwards movement of the Indian Plate with respect to the Eurasia Plate (Figs 1, 4).
Two-dimensional stress field inversion using focal mechanism solution. Principal stress axis sigma-1 (maximum compression) sigma-3 (minimum compression). Blue lines segments are for sigma-3; green, black and grey lines are for sigma-1 indicating strike-slip, thrust, normal and mixed faulting environment, respectively (modified after Singh et al. Reference Singh, Zhao, Kumar and Mishra2016). The 2001 Bhuj main shock is shown by a red star with fault plane solution. Thick red lines are major known faults. Inset: strain ellipse shows development of synthetic R shear and antithetic R' shear along the master E–W-aligned fault and their association with compression and extensional tectonics.

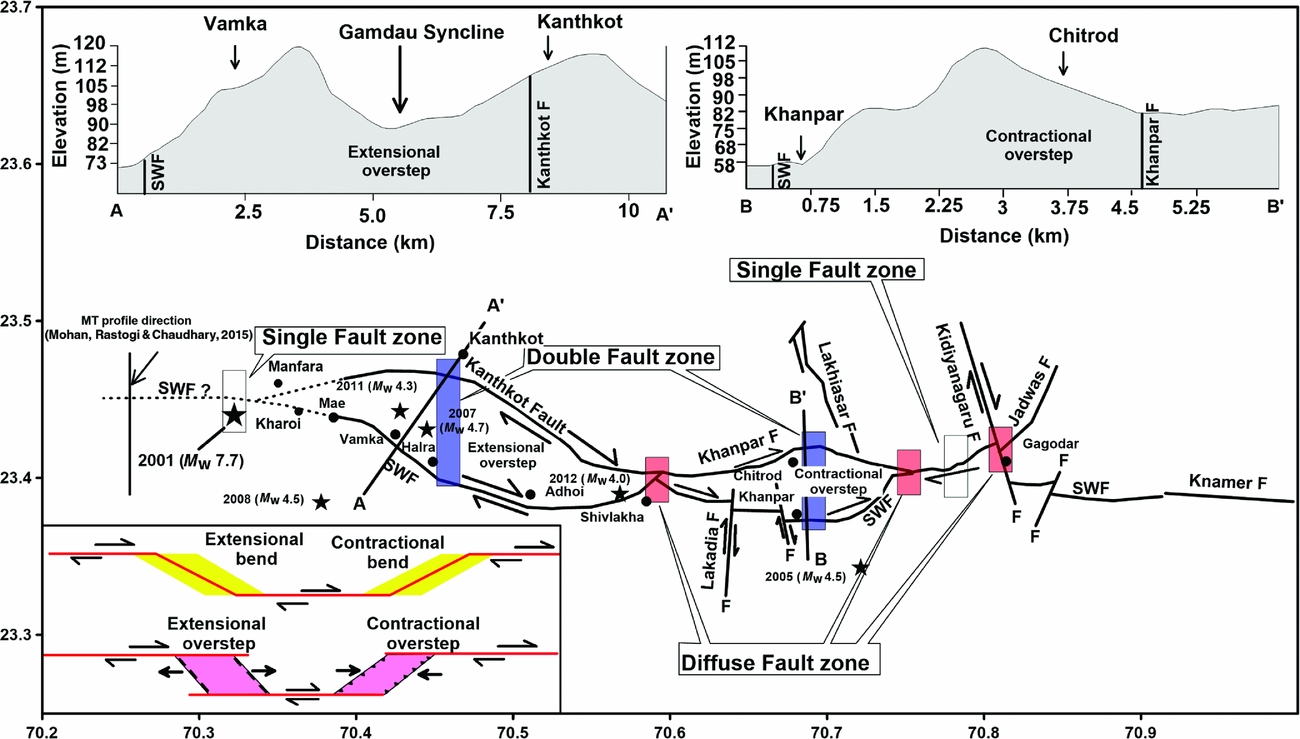
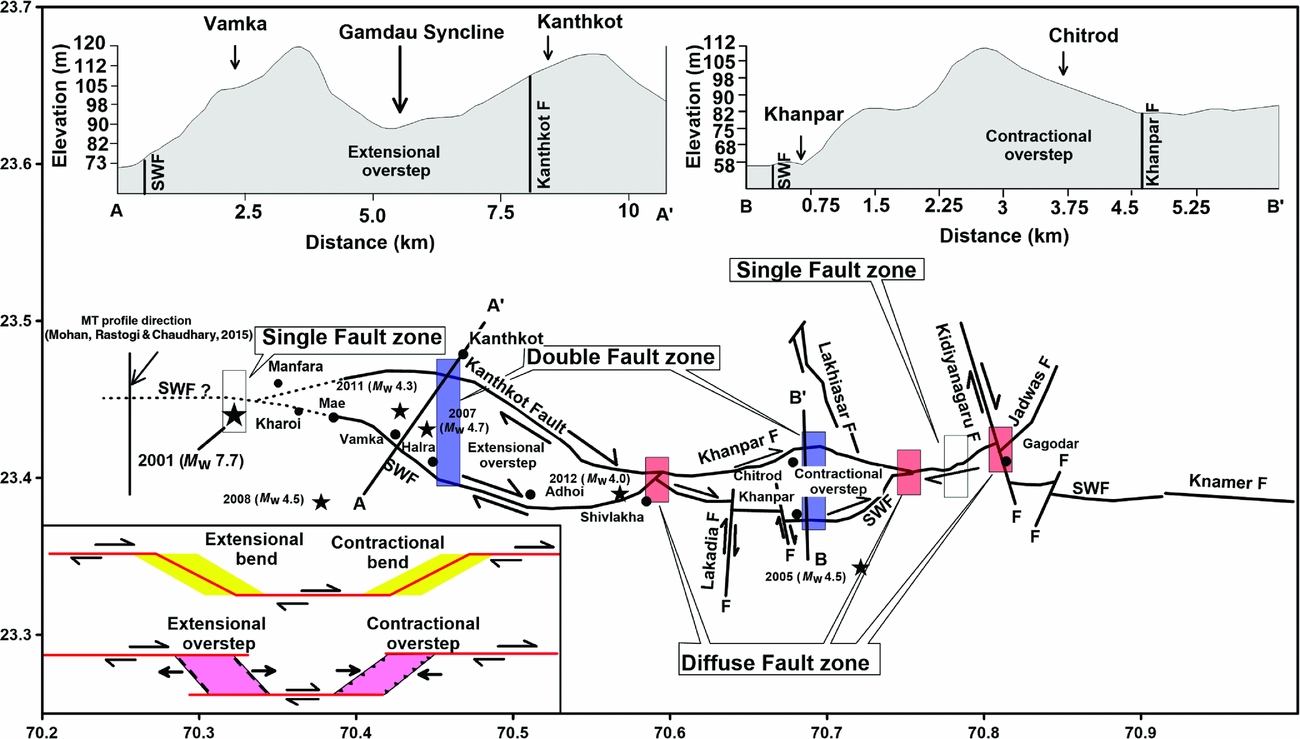
The surface fault geometry and morphology within the SWF zone appears more complex because of a broader deformation zone on both parts of the main fault. Several fault branches propagating at short distances from the main fault generate significant fault slip partitioning, as illustrated in Figure 5. Three categories of deformation have been observed along the SWF zone: (1) a single fault zone (500 m to 1 km wide) of higher strain; (2) a double fault zone (5–7 km wide) of intermediate strain; and (3) a diffuse fault zone (c. 500 m wide) of lower strain. The single fault zone is located west of the 2001 Bhuj earthquake (M w 7.7) epicentre as illustrated by dotted line in Figure 5. A magnetotelluric (MT) investigation west of the 2001 Bhuj epicentre suggests that the SWF is likely to extend west of the present trace of the SWF (Mohan et al. Reference Mohan, Rastogi and Chaudhary2015). The eastern part of the single fault zone is located to the east of Kidiyanagaru transfer fault (Fig. 5), named the Kanmer Fault. The double fault zone represents a zone of releasing bends of intermediate fault offset bounded by two fault branches, namely the Adhoi and Kanthkot faults in the western part and Chitrod and Khanpar faults in the central part (Fig. 5). In the western part, the first shear passes through Mae, Vamka and Adhoi areas and the second to its north passes through the Kanthkot escarpment (Fig. 5). This segment of the SWF is represented by an extensional overstep zone; the Gamdau syncline is located in the central part of the overstep zone (Fig. 5). In the contractional overstep, the first shear of the restraining bend of the central part of the SWF zone passes through the Lakadia and Khanpar areas, and the second shear to its north passes through the area north of Chitrod (Fig. 5). The Chitrod anticline is located within the contractional overstep zone. On the other hand, the diffuse fault zones where several fault branches join at Shivlakha, Mewasa and Gagodar areas (Fig. 5) represent deformations of relatively lower stress (Fig. 5). However, towards the eastern side the strike-slip movement of the SWF is terminated against the Kidiyanagaru Fault near Gagodar. Furthermore, to the east of the Kidiyanagaru Fault, the SWF resolves into a normal fault and continues further eastwards as the Kanmer Fault. The Kanmer or the SWF system to the east ends at the Radhanpur arch (Fig. 5).
Anastomosing surface rupture pattern of South Wagad Fault (SWF) zone. Contractional and extensional oversteps were developed within the fault interactions. Inset: possible slip mechanism along the fault zone. Solid black lines A–A' and B–B' represent direction of cross-section. The single fault zone is indicated by a blank box, the double fault zone by a blue (foreground opacity 47%) box and diffuse fault zone by red (foreground opacity 47%) box. Black stars indicate locations of earthquake magnitude >4 and major localities are indicated by black filled circles. The westwards extension of SWF is indicated by a dashed line based on MT investigation (Mohan, Rastogi & Chaudhary, Reference Mohan, Rastogi and Chaudhary2015).
5. Stress zones and seismicity pattern
The KRB has experienced several moderate to large intraplate earthquakes such as: the 2700 BC Dholavira earthquake (M w 6.5); the 1668 AD (Bisht, 2011) Indus Delta earthquake (Intensity X); the 1819 Allah Bund earthquake (M w 7.8); the 1956 Anjar earthquake (M w 6.0); and the 2001 Bhuj earthquake (M w 7.7) (e.g. Oldham, Reference Oldham1926; Chung & Gao, Reference Chung and Gao1995; Johnston, Reference Johnston1996; Bilham, Reference Bilham, Stewart and Vita-Finzi1999; Rajendran & Rajendran, Reference Rajendran and Rajendran2001; Rajendran et al. Reference Rajendran, Rajendran, Thakkar and Tuttle2001, Reference Rajendran, Rajendran, Thakkar and Bhanu2008) (Fig. 1). Among the recent events, the 1956 event originated at a shallow depth of c. 10 km and the 2001 Bhuj event occurred at a deeper depth (25 km) (Rastogi, Mandal & Biswas, Reference Rastogi, Mandal, Biswas and Talwani2014). Over a timespan of 194 years there were two major earthquakes – the 1819 Allahbund earthquake (M w 7.9) and 2001 Bhuj earthquake (M w 7.7) – which resulted in the greatest loss of life of all historical Indian earthquakes (Bilham Reference Bilham, Stewart and Vita-Finzi1999). The 1819 Allah Bund earthquake occurred on the northern boundary of the KRB, about 140 km NW of the epicentre of the 2001 Bhuj earthquake. The rupture zone and aftershocks during 2001 were confined to a c. 50 km × 30 km area north of KMF and west of SWF. These two major earthquakes were generated along the known active geological faults such as Allahbund Fault (ABF) and South Wagad Fault (SWF). In addition to these well-reported historical earthquakes in the KRB, several damaging and non-damaging earthquakes were also reported. The chronological records suggest that an earthquake with a magnitude comparable to the 1819 event may have occurred 800–1000 years ago (Rajendran & Rajendran, Reference Rajendran and Rajendran2001). Biswas & Khattri (Reference Biswas and Khattri2002) observed that during the last few decades earthquake epicentres have shifted to the eastern part of the KRB, between SWF and NWF, suggesting that this part is a highly strained zone with the potential of a large earthquake (Mandal et al. Reference Mandal, Rastogi, Satyanarayana, Kousalya, Vijayraghavan, Satyamurty, Raju, Sarma and Kumar2004). In view of this, an attempt has been made to understand the tectonic evolution and stress pattern along the SWF in the Kachchh rift basin. The present study was focused along the SWF due to its tectonic complexity (Fig. 2). The complex nature of the SWF may lead to continuous seismicity in the region, even more than 14 years after the 2001 Bhuj earthquake.
The geometry of the SWF is very complex due to crustal shearing on both sides of the main fault, the single and double fault zones (Fig. 5). Biswas (Reference Biswas2005) argued that the S-dipping SWF, which is geologically well-mapped as a step-over fault of the KMF in the east, was the source of the 2001 Bhuj earthquake. In a global study, Talwani & Gangopadhya (Reference Talwani and Gangopadhyay2003) reported that the intersecting fault zones in the Stable Continental Region (SCR) are the zones of stress accumulation for strong earthquakes. Several fault branches, namely Kanthkot, Lakadiya, Khanpar and Kidiyanagaru faults, developed due to reactivation of SWF, and are both synthetic and antithetic to the SWF. It is also observed that most of these younger faults were activated after the 2001 main shock. In the western side of the step-over zone, dextral motions are observed due to extensional stress within the double fault zone. To the east however, a compressional stress zone has developed due to a back-thrust generated from the Radhanpur stress barrier (Fig. 1). The interactions between single and double fault zones have caused deformation at the surface of the study region. The single fault zone may have generated high stress accumulation, and intermediate stress developed within the double fault zone. Several domes (e.g. Mae, Vamka, Halra and Chitrod) and anticlinal structures (e.g. Adhoi and Shivlakha) have developed within the double fault zone.
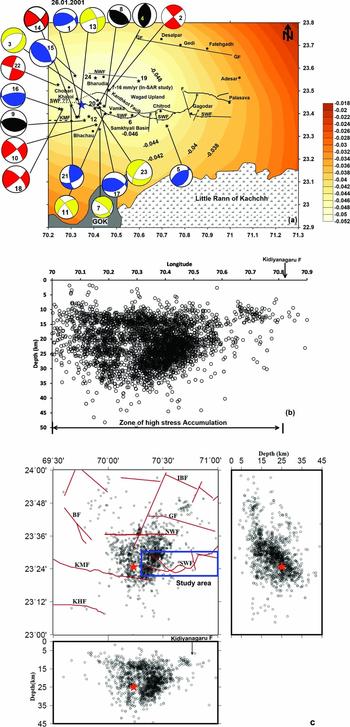
The strain field along the SWF zone was computed using the Global Positioning System (GPS) data recorded at the GPS network of the Institute of Seismological Research (ISR), Gandhinagar. We followed methods developed by Pesci, Giordano & Teza (Reference Pesci, Giordano and Teza2009) to compute major and minor strain axes in the grid nodes of 5×5 km2 (Dumka & Rastogi, Reference Dumka and Rastogi2013; Kothyari et al. Reference Kothyari, Rastogi, Morthekai, Dumka and Kandergula2016; Fig. 6a). The estimated strain in the area indicates a gradual increase of compressional strain west of the Kidiyanagaru transfer fault (Fig. 6a), whereas the area east of the Kidiyanagaru transfer fault shows decreasing compressional strain. The western zone shows a maximum 0.052 micro-strain (µ-strain) per year and the eastern zone –0.04 to –0.02 µ-strain/year (Fig. 6a). These significant variations in strain patterns in the single and double fault zones from west to east lead to micro to moderate earthquakes in the Kachchh Rift Basin (Fig. 6a).
(a) Map shows distribution of strain rate in the Wagad area of Kachchh, derived from the GPS network of the Institute of Seismological Research. Maximum compressional strain (0.052 µ strain/year) strain is observed between SWF and NWF zone. Note that the negative sign of contours indicates an increasing trend in compressional strain (modified after Kothyari et al. Reference Kothyari, Rastogi, Morthekai, Dumka and Kandergula2016). Earthquake epicentres with M w>4 that occurred during 2001–2013 are indicated by black stars. The focal mechanisms plotted in the figure are after Mandal, Satymurty & Raju (Reference Mandal, Satymurty and Raju2009), Rao, Rao & Rastogi (Reference Rao, Rao and Rastogi2013), Rastogi, Mandal & Biswas (Reference Rastogi, Mandal, Biswas and Talwani2014) and Singh et al. (Reference Singh, Rao, Kumar and Kayal2015). (b) E–W cross-section of relocated hypocentres of aftershocks which occurred between 2006 and 2014. (c) Seismicity (M w>2.5) distribution in the study area indicated by open circles. Right: cross-sectional view with depth distribution events along the latitude. Lower: distribution along longitude with depth. Star shows the location of 2001 main shock. The identified faults are also shown.

The strong heterogeneities along the western and central part of the SWF are responsible for the accumulation of the large crustal strain that results in high seismic activity in the KRB (Fig. 6b, c). It is believed that the variation in strain values in the KRB region indicates that the Bhuj earthquake epicentral region consists of a highly fractured rock mass of varying structural heterogeneities, even more than 13 years since the main shock (Singh et al. Reference Singh, Rao, Kumar and Kayal2015). The earthquake catalogue registered at the Seismic Network of Gujarat for the period 2006–2013 shows that mostly earthquakes of magnitude M w>2.7 at depths ranging over 10–30 km occurred in the step-over zone (Rastogi, Mandal & Biswas, Reference Rastogi, Mandal, Biswas and Talwani2014). From Figures 4 and 5 it is clear that the 2001 Bhuj M w 7.7 earthquake was located on the single fault zone, where high stress has accumulated (Fig. 6a).
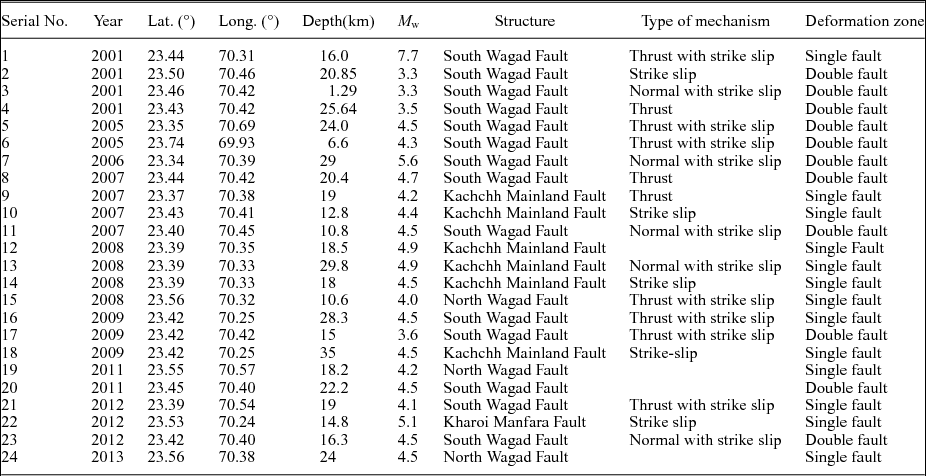
The fault plane solutions of 24 earthquakes (M w 3.0–5.6) are consistent with the single and double fault zones of the SWF (Fig. 6a). The details of these events are given in Table 1. These fault plane solutions are taken from earlier published data (Mandal et al. Reference Mandal, Rastogi, Satyanarayana, Kousalya, Vijayraghavan, Satyamurty, Raju, Sarma and Kumar2004; Mandal, Satymurty & Raju, Reference Mandal, Satymurty and Raju2009; Rao, Rao & Rastogi, Reference Rao, Rao and Rastogi2013). The fault plane solutions of the event (#3, #11 and #23) show predominantly normal faulting with a strike-slip component; while #2 shows pure strike-slip faulting in the extensional stress regime of the double fault zone. The thrust fault solutions of events # 4, #8 and #17 show thrust faulting with a strike-slip component in the double fault zones, which may be caused by the dome structure within the study zone with a localized compression. Events # 1, #16 and #21 show thrust faulting with a strike-slip component in the compressional segment of the single fault zone (Fig. 6a). Note that event #1 was the 2001 Bhuj main shock that occurred on the single fault zone of the SWF system, and it shows dominant thrusting with a small strike-slip component. We also have one dominant thrust faulting solution of event #5 that occurred in the contractional overstep zone of the SWF (Figs 5, 6a). Events #10, #13, #14 and #18 show dominant strike-slip faulting in a single fault plane of KMF, and the solution of event #9 shows dominant thrust motion with a small strike-slip component (Fig. 6a). Solution #7 east of Bhachau (23°17′35.81″N–70°20′21.05″E) shows that normal faulting with strike-slip motion may be associated with the Bhachau Fault. Solution #22 west of Chobari (23°32′2.10″N–70°19′27.11″E) shows prominent strike-slip motion associated with the Kharoi–Manfara Fault. The solution of event #15 shows dominant thrusting with strike-slip motion west of Bharudia, associated with the North Wagad Fault (NWF) (Fig. 6a). The published and available fault plane solutions in the KRB region are well corroborated with the strain pattern and geological model. The Kidiyanagaru Fault is also compatible with seismicity in the Wagad region (Singh et al. Reference Singh, Rao, Kumar and Kayal2015) (Fig. 6b). In this study, the precisely relocated events are confined between SWF and NWF (Fig. 6c). Interestingly, very few events towards the eastern side of the study region could be due to the termination of the strike-slip nature of the SWF against the Kidiyanagaru Fault. Most of the events occurred at 10–35 km depth; few events were at depths of <10 km (Fig. 6c).
Earthquake parameters used in this study (from Mandal et al. Reference Mandal, Rastogi, Satyanarayana, Kousalya, Vijayraghavan, Satyamurty, Raju, Sarma and Kumar2004; Mandal, Satymurty & Raju, Reference Mandal, Satymurty and Raju2009; Rao, Rao & Rastogi, Reference Rao, Rao and Rastogi2013; Rastogi, Mandal & Biswas, Reference Rastogi, Mandal, Biswas and Talwani2014)

6. Discussion
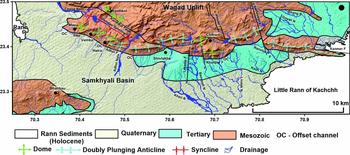
The different faults have different surface dynamics and orientations, and their contributions to landscape development are in response to tectonic forces (Strak et al. Reference Strak, Dominguez, Petit, Meyer and Loget2011; Graveleau et al. Reference Graveleau, Strak, Dominguez, Malavieille, Manighetti and Petit2015). In the case of a strike-slip faulting regime, a long time is needed to build active morphological features such as active scarps, progressive offset of drainages crossing the fault and beheaded streams (Fig. 7; Sieh & Jahns, Reference Sieh and Jahns1984; Grapes & Wellman, Reference Grapes and Wellman1988). Further, Graveleau et al. (Reference Graveleau, Strak, Dominguez, Malavieille, Manighetti and Petit2015) suggest that the river flowing across the normal fault developed a concave-upwards topography, and the substantial erosion within the footwall developed triangular facets (Petit et al. Reference Petit, Gunnell, Gonga-Saholiariliva, Meyer and Séguinot2009; V. Strak, unpub. Ph.D. thesis, Université Pierre et Marie Curie, 2012). The drainage network in such a zone is controlled by headwards erosion due to progressive tectonic uplift (Kennan, Lamb & Hoke, Reference Kennan, Lamb, Hoke and Widdowson1997; Coltorti & Ollier, Reference Coltorti, Ollier, Smith, Whalley and Warke1999; Vassallo et al. Reference Vassallo, Ritz, Braucher, Jolivet, Carretier, Larroque, Chauvet, Sue, Todbileg, Bourles, Arzahnikova and Arzahnikov2007). Further, it is believed that in the compressional and extensional setting, the fault trace is generally unique and continuous because the fault plane remains relatively localized when it reaches the surface (Graveleau et al. Reference Graveleau, Strak, Dominguez, Malavieille, Manighetti and Petit2015).
Geomorphic map of South Wagad Fault zone, depicting the development of active landforms.

The fault geometry and morphology in strike-slip settings appear more complex because crustal shearing generates a broader deformation zone on both parts of the main fault plane (Graveleau et al. Reference Graveleau, Strak, Dominguez, Malavieille, Manighetti and Petit2015). Several fault branches that are R synthetic, R' antithetic and P shears propagate from the main faults and generate significant fault-slip partitioning (Cunningham & Mann, Reference Cunningham, Mann, Cunningham and Mann2007; Fossen, Reference Fossen2010). Moreover, recent studies suggest a possible correlation between the structural maturity of the fault and the amount of deep slip measurable at the surface (Dolan & Haravitch, Reference Dolan and Haravitch2014; Graveleau et al. Reference Graveleau, Strak, Dominguez, Malavieille, Manighetti and Petit2015).
The present study is focused on the kinematics of surface deformation zones along several fault branches of the SWF system (Fig. 6a). These deformation zones are referred to as: (1) a single fault zone; (2) a double fault zone bounded by releasing bend of two fault branches; and (3) a diffuse fault zone, where several fault branches join together (Fig. 6a). In the single fault zone, the surface rupture is localized along a single fault line and shows true offset. Here the earthquakes on the single fault, solutions #1, #16 and #21, show prominent thrust mechanism with a small strike-slip component. In a double fault, the surface rupture is accommodated by double faults that cause slip partitioning in double faults due to contractional as well as extensional overstep slip (Graveleau et al. Reference Graveleau, Strak, Dominguez, Malavieille, Manighetti and Petit2015). In our study, we also observe complex solutions of earthquakes in the double fault. Solution #2 shows pure strike-slip motion; solutions #3, #11 and #23 show normal faulting with a strike-slip component; solutions #4 and #8 show pure thrust faulting; and solution #5 shows thrust faulting with strike-slip motion. In the diffuse fault zone, surface deformation is accommodated by several branches of the faults on both sides of the zone, remaining itself aseismic (Fig. 6a).
Accumulation of higher and intermediate stress in the single and double fault zones is validated by frequent occurrence of micro to moderate earthquakes (M w 3.3–5.6) in the SWF system. The fault plane solutions revealed different stress orientations for different earthquakes in the single as well as in the double fault zones. The presence of extensional as well as contractional bends within the SWF system is observed. The GPS-derived strain distribution pattern of the SWF system indicates a gradual increase of compressional strain from east to west, that is, from the double fault zone to the single fault zone in the mainshock epicentre area (Fig. 5).
7. Conclusions
The following inferences have been drawn from this study.
-
1. The SWF system in the eastern Kachchh Rift Basin developed a typical anastomosing surface rupture pattern, reflecting subsurface wrench faulting.
-
2. The NW–SE Kanthkot and NE–SW Khanpar faults were developed synthetic to the main fault. The Lakadiya, Lakhiasar and Kidiyanagaru faults developed as antithetic faults in relation to the principal fault.
-
3. Three stress accumulation zones (single fault zone with higher strain, double fault zone with intermediate strain and the diffused fault zone with minimum strain) have been identified in the SWF system.
-
4. Easternmost dispersion of the fault zone is the effect of dextral motion which is countered by the backthrust from the Radhanpur arch. Beyond the Kidiyanagaru transfer fault, the wrench fault system resolves as normal faults.
-
5. The wrench fault geometry suggests that the SWF is a typical strike-slip fault where structures are associated with contractional and extensional bends, that is, restraining and releasing bends.
-
6. The presence of the Gamdau syncline in the west and Chitrod dome in the east of the fault zone confirms extensional and contractional bends within the double fault zone.
-
7. The occurrence of micro to moderate earthquakes of M w 3.3–5.6 in the single and double fault zones confirms higher stress accumulation.
-
8. The frequent occurrence of moderate earthquakes and the fault deformation pattern reveal that the single fault zone of the SWF has more potential for generating future large earthquakes in eastern Kachchh.
Acknowledgements
The authors are grateful to Dr J. R. Kayal for a critical review of the manuscript. This work is partially supported by Ministry of Earth Science, Government of India (MoES/PO(Seismo)/1(270)/AFM/2015) under the active fault mapping program. We also thank Professor Robert S. Yeats, Associate Editor and Reviewer, Geological Magazine for his constructive comments which improved the manuscript.