





Introduction
Organic dyes, originating from various industries such as pharmaceuticals, textiles, printing, paper, cosmetics, and leather, pose a serious threat to both aquatic life and human health (Hadjltaief et al., Reference Hadjltaief, Bairq, Shi and Benzina2021). The extensive use of dyes in the dyeing industry has led to the discharge of untreated dye-containing wastewater, resulting in severe water pollution and the death of aquatic plants and animals (Huang et al., Reference Huang, Yang, Zeng and Zhou2023). Treating dye wastewater is challenging because of its complex organic composition, intense color, toxicity, and resistance to biodegradation (Huang et al., Reference Huang, Qi, Gao, Zhang and Zhao2020).
Malachite green (M-GR) is a synthetic dye used widely in dyeing cotton, silk, paper, and leather, as well as in producing paints and printing inks. However, M-GR is highly soluble in water and alcohol, allowing it to spread easily in the environment. Studies have shown that it is carcinogenic, mutagenic, and persistent, posing serious risks to aquatic ecosystems by affecting organisms such as fish, algae, and bacteria. Once ingested, M-GR can disrupt the reproductive and immune systems of both aquatic organisms and humans. Therefore, its effective removal from industrial wastewater is crucial to protect environmental and public health (Findik, Reference Findik2025a; Mahmud et al., Reference Mahmud, Benamor, Nasser, Ba-Abbad, El-Naas and Mohammad2021).
Traditional dye wastewater-treatment methods include physical adsorption, biological decomposition, chemical oxidation, and coagulation, each with specific advantages and limitations. Physical adsorption and coagulation can remove contaminants but do not alter their chemical structure, leaving pollution unresolved. Biological treatment is ineffective for unconventional organic pollutants due to restrictions on microbial growth and metabolism (Huang et al., Reference Huang, Qi, Gao, Zhang and Zhao2020).
Recently, advanced oxidation processes (AOPs) have emerged as effective chemical treatment methods based on the generation of highly reactive hydroxyl radicals (•OH), which can rapidly and non-selectively degrade a wide range of organic pollutants. Operating under near-ambient conditions, AOPs produce strong oxidants that break down organic contaminants in wastewater, ultimately mineralizing dye pollutants into harmless low-molecular-weight products, CO2 and H2O (Dong et al., Reference Dong, Lin, Ren, Ma and Zhao2021; Findik, Reference Findik2025a).
The Fenton process, a classic representative of AOPs, decomposes organic pollutants through the reaction between ferrous ions (Fe2+) and hydrogen peroxide (H2O2), producing highly reactive •OH radicals (Hong et al., Reference Hong, Li, He, Saeed, Zhang, Wang, Kong and Liu2020). Despite its advantages such as rapid reaction rate, simple operation, and low cost, the homogeneous Fenton process suffers from several drawbacks, including excessive iron sludge generation, catalyst loss, high H2O2 consumption, and a narrow pH range, which restrict its practical applications (Hong et al., Reference Hong, Li, He, Saeed, Zhang, Wang, Kong and Liu2020; Xia et al., Reference Xia, Shen, Zhang, Hu, Mian and Zhang2022; Huang et al., Reference Huang, Yang, Zeng and Zhou2023). To overcome these limitations, heterogeneous Fenton-like systems have attracted considerable attention. These systems utilize solid-phase iron-based catalysts to activate H2O2 under milder conditions, offering benefits such as reduced sludge formation, catalyst reusability, and efficient degradation performance over a broader pH range, making them more environmentally friendly and sustainable (Zhou et al., Reference Zhou, Xu, Zhang, Zhang and Tang2020; Xia et al., Reference Xia, Shen, Zhang, Hu, Mian and Zhang2022).
Metallic spinel ferrites (MFe2O4, M = Fe2+, Zn2+, Mn2+, Cu2+ or Co2+) are widely studied for their stability and easy magnetic recovery. Among them, cobalt ferrite (CoFe2O4) stands out for environmental remediation due to its high catalytic activity, stable spinel structure, low metal leaching, strong magnetization, large specific surface area, and easy magnetic seperation (Cechinel et al., Reference Cechinel, Nicolini, Tápia, Miranda, Eller, de Oliveira, Raupp-Pereira, Montedo, Wermuth and Arcaro2023). However, pure CoFe2O4 nanoparticles are highly magnetic and tend to agglomerate during pollutant degradation, resulting in limited adsorption capacity and fewer active sites, which significantly reduces their catalytic efficiency (Li et al., Reference Li, Li, Cao, Zhao, Wang and Cheng2023a). To overcome these limitations, the incorporation of cost-effective and environmentally friendly support materials such as biopolymers and natural minerals has gained considerable attention.
Kaolin, a low-cost natural clay, has a 1:1 aluminosilicate structure composed of silica and alumina layers. It is used widely in the ceramics, paper, plastics, rubber, adhesive, and paint industries, as well as in water-treatment applications (Prasad et al., Reference Prasad, Reid and Murray1991; Nandi et al., Reference Nandi, Goswami and Purkait2009). Its surface properties provide active sites for adsorption, making it an effective material for the removal of dye from aqueous solutions. In addition, kaolin can act as a suitable support for the dispersion of active components, enhancing its applicability in catalytic processes.
Xanthan gum (XG) is an anionic, high-molecular-weight biopolymer produced through the aerobic fermentation of simple sugars by the gram-negative bacterium Xanthomonas campestris, with a molecular weight typically ranging from 2×10⁶ to 2×10⁷ Da (Kaur et al., Reference Kaur, Singh and Sud2020; Ahmadian et al., Reference Ahmadian, Derakhshankhah and Jaymand2023). XG exhibits high viscosity at low shear rates, remarkable stability across wide temperature and pH ranges, and non-Newtonian behavior, along with biodegradability, biocompatibility, and non-toxicity, making it attractive for various industrial and biomedical applications. However, its excessive hydrophilicity and water solubility can limit its practical use, necessitating chemical or physical modifications to improve its physicochemical performance (Ahmadian et al., Reference Ahmadian, Derakhshankhah and Jaymand2023).
In the literature, various studies have reported the treatment of pollutant-containing wastewaters using materials incorporating XG, CoFe2O4, kaolin, or their combinations through different remediation methods. For instance, Fenton-like degradation of various dyes has been investigated using different catalyst system such as CoFe2O4-supported cellulose aero gel beads (El Allaoui et al., Reference El Allaoui, Benzeid, Zari, Qaiss and Bouhfid2024) and pristine CoFe2O4 for Rhodamine B degradation (Liu et al., Reference Liu, Chen, Hao, Tang, Jiang, Li, Tian, Yan, Luo and Jia2022), a magnetic XG-zeolite composite (m-XG-Zeo) for the decolorization of methyl violet 2B and M-GR (Findik, Reference Findik2025a), and metallic nickel nanoparticles supported on polyaniline nanotubes for brilliant green degradation (Bhaumik et al., Reference Bhaumik, Maity and Brink2022). Additionally, magnetic ZnO-Fe3O4-supported Tunisian kaolinite clay was investigated for sono-assisted solar/Fenton degradation of indigo carmine (Hadjltaief et al., Reference Hadjltaief, Bairq, Shi and Benzina2021), and CoFe2O4/kaolinite was utilized for the photo-Fenton degradation of tetracycline hydrochloride (Li et al., Reference Li, Li, Cao, Zhao, Wang and Cheng2023a). CoFe2O4@Methylcelloluse was reported as an efficient sonocatalyst for the degradation of reactive blue 19 (Nasiri et al., Reference Nasiri, Malakootian, Heidari and Asadzadeh2021). Kaolinite supported CoFe2O4 and CoFe2O4/Graphene oxide/kaolinite have also been tested for adsorption of Congo red and lead, respectively (Olusegun and Mohallem, Reference Olusegun and Mohallem2020; Reta and Desissa, Reference Reta and Desissa2023). Moreover, CoFe2O4/SiO2/Cu-MOF demonstrated superior catalytic performance in sono-Fenton-like degradation of methylene blue (Saemian et al., Reference Saemian, Sadr, Yaraki, Gharagozlou and Soltani2022), and kaolin/CoFe2O4 powders were evaluated for lead adsorption (Ziedan et al., Reference Ziedan, Hussain and Ismail2024).
These findings highlight the promising potential of XG, kaolin, and CoFe2O4-based materials for pollutant treatment; however, to the best of our knowledge, no study has reported the use of a composite combining XG, CoFe2O4, and kaolin for the heterogeneous Fenton-like decolorization of cationic dyes. This gap emphasizes the need for development of new multi-functional materials for advanced oxidation processes.
In the present study, the problem addressed is the lack of an efficient, stable, and reusable heterogeneous Fenton-like catalyst for the effective decolorization of cationic dyes such as M-GR under environmentally relevant conditions. It is hypothesized that integrating XG, CoFe2O4, and kaolin into a single composite structure can enhance catalytic performance by combining the adsorption capacity of kaolin, the structural and functional properties of XG, and the magnetic and catalytic activity of CoFe2O4, thereby overcoming the limitations of individual components. The objectives of the present study were to: (1) synthesize a novel XG–CoFe2O4–kaolin composite, (2) evaluate its catalytic efficiency in the heterogeneous Fenton-like decolorization of M-GR, and (3) investigate the effects of key operational parameters, as well as the stability, reusability, and reaction kinetics of the developed system.
Materials and methods
Materials
In this study, kaolin (obtained from a mining company operating in the Sındırgı region, Balıkesir, Türkiye), FeSO47H2O (Merck), FeCl36H2O (Sigma Aldrich), CoCl26H2O (CDH), ethyl alcohol (EtOH) (96% v/v, Merck), and XG (New Seed Chemicals) were used for the preparation of the composite. H2O2 (30% w/w, Carlo Erba) was employed as the oxidant in the Fenton-like oxidation experiments. The dye M-GR (Isolab) was selected as model pollutant.
Preparation of xanthan gum-modified magnetic kaolin and its characterization
The composite used in this study was synthesized via a chemical co-precipitation method, following procedures reported in the literature (Elsayed et al., Reference Elsayed, El-Sayed and Tony2022; Findik, Reference Findik2025a). First, 1 g of XG was dissolved in 50 mL of EtOH and stirred at 400 rpm for 20 min at 20°C. Simultaneously, FeSO47H2O, FeCl36H2O, and CoCl26H2O in a weight ratio of 0.65:1:0.25 were dissolved in 100 mL of EtOH and stirred at 400 rpm for 15 min. The XG solution was then added to the iron-cobalt solution, and stirred for 15 min. Subsequently, kaolin was added to the mixture and stirred at 50°C for 30 min. The weight ratio of XG/Fe/Co/Kaolin was maintained at 1:7.8:1.4:10. The pH of the mixture was adjusted to 12 using a 3 M NaOH solution, and followed by continuous stirring for an additional hour at 55–60°C. The resulting suspension was allowed to settle for two nights, and then filtered through Whatmann No. 3 filter paper. The final product was dried at 90°C for 48 h and designated as XG-CF-K. In addition, three control composites were synthesized following the same procedure: one without XG (designated as CF-K), one without kaolin (designated XG-CF), and one without both XG and kaolin (designated as CF).
The characterization of the XG-CF-K composite was carried out using several complementary techniques. The BET (Brunauer-Emmett-Teller) method was applied with a Quantachrome Nova Touch LX4 analyzer to determine the specific surface area and pore-size distribution. The crystalline structure was investigated by X-ray diffraction (XRD; Bruker D8 Advance) in the 3–90° range, using CuKα radiation (λ = 0.15406 nm, 40 kV, 40 mA) with a step size of 0.05°. Functional groups were identified through Fourier-transform infrared spectroscopy (FTIR; Bruker Alpha) within the spectral range of 400–4000 cm-1. Magnetic behavior was evaluated using a vibrating sample magnetometer (VSM; Lake Shore 7407). Thermal stability was assessed by thermogravimetric analysis (TGA; Hitachi STA 7300), while the surface charge was determined via zeta potential measurements (Malvern ZetaSizer Nano ZSP). Morphological features and elemental composition were analyzed by scanning electron microscopy equipped with energy-dispersive X-ray spectroscopy (SEM-EDS; FEI Quanta FEG250). Furthermore, the extent of iron leaching was quantified using inductively coupled plasma optical emission spectroscopy (ICP-OES; Thermo Scientific ICAP 6500).
Experiments
The decolorization of M-GR was investigated under a range of operational parameters, including reaction time (0–45 min), solution pH (3.5–10), initial dye concentration (10–50 mg L–1), salt (NaCl and Na2SO4) concentration (0–5 g L–1), XG-CF-K amount (0–1.2 g L–1), H2O2 concentration (0–0.196 M), and reaction temperature (25–45°C). In each experiment, 100 mL of dye solution of a specified concentration was mixed with pre-determined amounts of XG-CF-K and H2O2. The mixture was stirred at 400 rpm, and aliquots withdrawn at fixed time intervals were centrifuged at 3500 rpm for 10 min.
The residual dye concentration was determined spectrophotometrically. The absorbance of the samples was recorded at 618 nm using a Hach DR-2400 spectrophotometer. The decolorization efficiency was then calculated using Eqn (1):

where C 0 and Ct correspond to the dye concentrations (mg L–1) at the start of the reaction and at time t, respectively.
Additionally, the chemical oxygen demand (COD) of the treated samples was measured using a COD reactor (Hach DRB-200) coupled with a UV-Vis spectrophotometer (Hach DR-2400)
Results and Discussion
XG-CF-K characterization
The crystal structures of XG-CF-K, kaolin, and XG were investigated by XRD analysis (Fig. 1a). In the XG-CF-K pattern, the diffraction peaks at 12.35, 20.95, 26.75, and 30.35°2θ correspond to the characteristic reflections of kaolin (Findik, Reference Findik2023b; Findik, Reference Findik2024; Findik, Reference Findik2025b). In addition, the peaks observed at 35.7, 43.1, 45.5, 57, and 62.8°2θ can be attributed to CoFe2O4 based on literature reports (Bagherzadeh et al., Reference Bagherzadeh, Kazemeini and Mahmoodi2021; Deng et al., Reference Deng, Zhao, Luo, Wang and Tang2020; Palanivel et al., Reference Palanivel, Lallimathi, Arjunkumar, Shkir, Alshahrani, Al-Namshah, Hamdy, Shanavas, Venkatachalam and Ramalingam2021). XG exhibits a broad diffraction halo centered around 19.5°2θ, confirming its predominantly amorphous nature. In the XG-CF-K composite, the characteristic diffraction peaks of kaolin and CoFe2O4 are clearly observed, indicating that its crystalline structures of these phases are preserved after composite formation. Overall, the amorphous structure of XG does not dominate the composite pattern but contributes to a slight reduction in peak intensity and minor broadening, suggesting that the crystalline phases are dispersed within the amorphous matrix.
(a) XRD spectra and (b) FTIR spectra of XG-CF-K, kaolin, and XG.

Figure 1. Long description
Panel a is an X R D plot with Intensity in arbitrary units on the y-axis and 2 theta from 0 to 90 on the x-axis. The bottom black curve for X G shows a broad amorphous hump between 15 and 30 degrees. The middle red curve for Kaolin shows sharp crystalline peaks, notably at 12 and 25 degrees. The top blue curve for X G-C F-K combines features of both, with specific peaks labeled K for Kaolin and asterisks for C o F e sub 2 O sub 4. Panel b is an F T I R plot with Transmittance percentage on the y-axis and Wavenumber in inverse centimeters from 400 to 4000 on the x-axis. The bottom black curve for X G shows broad bands around 1000 and 3400. The middle red curve for Kaolin shows sharp, deep troughs between 400 and 1200 and a distinct doublet near 3600. The top blue curve for X G-C F-K shows a composite profile of the underlying materials.
In the XG-CF-K FTIR spectrum (Fig. 1b), the peaks at 3688 cm–1 and 3620 cm–1 correspond to the –OH stretching vibrations (Reta and Desissa, Reference Reta and Desissa2023). The peak at 3435 cm–1 is attributed to –OH vibrations (Bagherzadeh et al., Reference Bagherzadeh, Kazemeini and Mahmoodi2021; Tan et al., Reference Tan, Zhang, Zu, Zhang, Zheng and Chen2023), while the band at 3412 cm–1 is assigned to the strectching vibration of –OH groups in XG (Alwared et al., Reference Alwared, Mohammed, Al-Musawi and Mohammed2023). The peak at 1629 cm–1 is related to H–O–H bending of interlayer water (Alqassem et al., Reference Alqassem, Othman, Abu Haija and Banat2021; Moyo et al., Reference Moyo, Chakachaka, Fito, Gorimbo, Muleja and Nkambule2024; Reta and Desissa, Reference Reta and Desissa2023; Simonescu et al., Reference Simonescu, Tatarus, Culita, Stanica, Ionescu, Butoi and Banici2021). The bands at 1114, 1031 and 1006 cm–1 correspond to Si–O–Si stretching vibrations (Findik, Reference Findik2025b), and the peak at 911 cm–1 is assigned to Al–OH stretching (Findik, Reference Findik2023b; Moyo et al., Reference Moyo, Chakachaka, Fito, Gorimbo, Muleja and Nkambule2024). The peaks at 794 cm–1 and 750 cm–1 are attributed to Si–O–Al stretching vibrations (Findik, Reference Findik2023b). The band at 466 cm–1 and 428 cm–1 represents the Si–O stretching (Findik, Reference Findik2025b). Finally, the peak at 412 cm–1 is associated with the bending vibration of M–O bonds in the tetrahedral and octohedral sites of spinel ferrites (Alqassem et al., Reference Alqassem, Othman, Abu Haija and Banat2021; Simonescu et al., Reference Simonescu, Tatarus, Culita, Stanica, Ionescu, Butoi and Banici2021). Overall, the co-existence of characteristic bands of kaolin, XG, and CoFe2O4, together with slight shifts and changes in band intensities, indicates that the composite is not formed by simple physical mixing but rather constitutes an integrated hybrid structure formed through interactions between its components.
The SEM images of XG-CF-K and raw kaolin (Fig. 2a,b) reveal a distinct morphological transformation after modification. Raw kaolin exhibits a typical layered and plate-like structure, characteristic of its aluminosilicate nature. In contrast, the XG-CF-K composite shows an irregular and aggregated particulate morphology, where the original layers are partially covered and obscured. This change indicates that CoFe2O4 particles and XG are deposited successfully onto the kaolin surface. The EDS spectra of XG-CF-K and raw kaolin (Fig. 2c,d) provide information on the elemental composition of the analyzed surface regions. The surface elemental composition of XG-CF-K was estimated as 10.23% C, 31.90% O, 3.24% Na, 2.42% Al, 3.40% Si, 0.93% chlorine, 41.75% iron, and 6.11% cobalt. In comparison, raw kaolin contained 19.66% C, 44.01% O, 16.27% Al, and 20.05% Si. The EDS results confirmed qualitatively the presence of Fe and Co elements in the surface regions analyzed. Together with the XRD results, these findings provide supporting evidence for the successful incorporation of CoFe2O4 into the XG-CF-K composite. However, it should be noted that EDS is a semi-quantitative surface characterization technique and does not provide a rigorous determination of the bulk composition. Therefore, the reported elemental percentages should be regarded as indicative of the surface composition of the regions analyzed rather than precise compositional values.
SEM images of (a) XG-CF-K, and (b) kaolin; EDS analysis of (c) XG-CF-K, and (d) kaolin.

Figure 2. Long description
Four panels labeled a through d.
Panel a: S E M micrograph of X G-C F-K at 50,000 times magnification. It shows a dense, irregular, and porous surface texture with small globular clusters. A 3 micrometer scale bar is at the bottom right.
Panel b: S E M micrograph of kaolin at 40,000 times magnification. It displays a distinct platy morphology with overlapping, flat, angular flakes. A 3 micrometer scale bar is at the bottom right.
Panel c: E D S spectrum for X G-C F-K. The x-axis is Energy in k e V from 0.00 to 10.00. The y-axis is Counts in arbitrary units from 0.00 K to 1.30 K. Major peaks are labeled from left to right: C, O (highest peak at 1.17 K), Fe, Co, Na, Al, Si, Cl, Fe (secondary peak at 6.4 k e V), Co, and Fe.
Panel d: E D S spectrum for kaolin. The x-axis is Energy in k e V from 0.00 to 10.00. The y-axis is Counts in arbitrary units from 0.00 K to 1.98 K. Major peaks from left to right: Si (minor), C, O (highest peak at 1.98 K), Al, and Si (secondary high peak). The peaks for Al and Si are significantly taller and sharper than those in panel c.
The TGA curve of XG-CF-K (Fig. 3a) indicated a total weight loss of 12.8% over the temperature range of 25–800°C. The thermal decomposition occurred in three distinct stages. The first stage (25–100°C) exhibited a weight loss of 2.41%, corresponding to the evaporation of physically adsorbed water molecules (Ahmad and Mirza, Reference Ahmad and Mirza2017; Chen et al., Reference Chen, Li, Zeng, Kang, Wang, Xie, Liu and Zhang2020; Reta and Desissa, Reference Reta and Desissa2023). The second stage (100–450°C) resulted in a 4.24% mass loss and is attributed to the release of volatile components from the composite (Ahmad and Mirza, Reference Ahmad and Mirza2017), the removal of adsorbed water from kaolinite surfaces (Cheng et al., Reference Cheng, Liu, Yang, Ma and Frost2012), and the dehydration of coordinated water molecules (dehydroxylation) (Reta and Desissa, Reference Reta and Desissa2023). This stage may also involve the thermal degradation of XG, including dehydration and depolymerization reactions that generate water, carbon dioxide and methane along with the cleavage of the biopolymer matrix and crosslinked structures (Ahmad and Mirza, Reference Ahmad and Mirza2017). In the fourth stage (450–800°C), a weight loss of 6.15% was observed, which may be associated with the decomposition of carbonaceous residues on CoFe2O4 particles (Reta and Desissa, Reference Reta and Desissa2023) and the formation of metakaolinite due to dehydroxylation at elevated temperatures (Cheng et al., Reference Cheng, Liu, Yang, Ma and Frost2012; Findik, Reference Findik2023a). The differential thermogravimetric (DTG) curve exhibits four peaks at 44.2°C, 268.5°C, 378.7°C, and 551.4°C, corresponding to the decomposition stages identified in the TGA analysis.
(a) TGA, (b) BET, and (c) VSM analysis of XG-CF-K.

Figure 3. Long description
Panel a is a thermal analysis plot with Temperature in degrees Celsius on the x axis from 0 to 800. It contains three y axes. T G percent on the right shows a steady decline from 100 to 88 percent. D T A in micro volts on the left shows a fluctuating downward trend with a peak near 700 degrees. D T G in percent per minute on the far left shows four distinct peaks labeled 44.2, 268.5, 378.8, and 551.4 degrees Celsius.
Panel b is a B E T adsorption isotherm. The x axis is Relative pressure P over P sub 0 from 0 to 1.0. The y axis is Volume at S T P in cubic centimeters per gram from 0 to 160. Two curves, Ads with circles and Des with squares, overlap until a relative pressure of 0.8, where they form a narrow hysteresis loop before rising sharply to 150 cubic centimeters per gram.
Panel c is a V S M magnetic hysteresis loop. The x axis is magnetic field H in O e from minus 20000 to 20000. The y axis is Magnetization M in e m u per gram from minus 30 to 30. The curve forms a narrow S-shaped loop passing through the origin, reaching saturation at approximately 28 e m u per gram.
The N2 adsorption-desorption isotherms of XG-CF-K (Fig. 3b) exhibited a type IV adsorption–desorption behavior (Deng et al., Reference Deng, Zhao, Luo, Wang and Tang2020). According to BET analysis, the surface area, pore volume, and pore radius of XG-CF-K are 58.55 m2 g–1, 0.012 cm3 g–1, and 1.35 nm, respectively. In comparison, kaolin has a surface area of 1.53 m2 g–1, a pore volume of 0.033 cm3 g–1, and a pore radius of 1.88 nm. These results demonstrate a significant increase in the surface area after composite formation. This enhancement can be attributed to the incorporation of CoFe2O4 nanoparticles, which introduce additional active surfaces, and the presence of XG, which probably improves the dispersion of these particles within the composite matrix. In the literature, the surface area of ZnO-Fe3O4-supported natural Tunisian kaolinite clay was reported as 35.6 m2 g–1 (Hadjltaief et al., Reference Hadjltaief, Bairq, Shi and Benzina2021). In another study, the surface area of CoFe2O4/kaolinite containing 40 wt.% kaolinite (CFO/K-40%) was 15.47 m2 g–1 (Li et al., Reference Li, Li, Cao, Zhao, Wang and Cheng2023a). These findings suggest that XG-CF-K possesses a larger surface area than similar composites reported in the literature.
The VSM analysis of XG-CF-K (Fig. 3c) showed that the saturation magnetization (Ms) was 27.2 emu g–1. The magnetic properties of spinel nanoparticles are strongly affected by the distribution of cations between tetrahedral (A sites) and octahedral (B sites). While the A–B super-exchange interactions occur between Fe3+ ions at A sites and Fe3+ ions at B sites via a non-magnetic oxygen anion, the A–A and B–B exchange interactions are dominant. Consequently, the arrangement of cations plays a crucial role in defining the magnetic behavior of such materials. Moreover, the broad characteristic hysteresis loops observed for CoFe2O4 confirm its hard magnetic nature (Cechinel et al., Reference Cechinel, Nicolini, Tápia, Miranda, Eller, de Oliveira, Raupp-Pereira, Montedo, Wermuth and Arcaro2023; Qin et al., Reference Qin, Zhang, Wang, Zhao, Ma, Wang and Xu2022; Ziedan et al., Reference Ziedan, Hussain and Ismail2024). In the literature, the Ms value of CoFe2O4 has been reported as 65.7 emu g–1 (Cechinel et al., Reference Cechinel, Nicolini, Tápia, Miranda, Eller, de Oliveira, Raupp-Pereira, Montedo, Wermuth and Arcaro2023) and 70.04 emu g–1 (Liu et al., Reference Liu, Chen, Hao, Tang, Jiang, Li, Tian, Yan, Luo and Jia2022). The Ms value of XG-CF-K is lower than these values. This decrease in Ms may be attributed to the presence of non-magnetic components such as kaolin and XG used in the composite preparation, which dilute the magnetic phase. In our previous studies, the Ms value of composite materials containing carboxymethylcellulose, kaolin and Fe3O4 (m-CMC-K) and XG, zeolite, Fe3O4 (m-XG-Zeo) were 20.87 emu g–1 and 11 emu g–1, respectively (Fındık, 2005a; Fındık, 2025b). Although the Ms value of XG-CF-K is lower than that of pure CoFe2O4, it is greater than those of our previously reported composites.
Effect of operational parameters
To determine the optimum conditions for the Fenton-like decolorization of M-GR, the effects of parameters such as H2O2 concentration, XG-CF-K dosage, initial dye concentration, presence of salt, pH, and temperature were investigated.
The effect of H2O2 concentration was examined in the range of 0–0.196 M at an XG-CF-K amount of 1 g L–1, pH 6, 25°C, and 20 min reaction time (Fig. 4a). In the absence of H2O2, the decolorization efficiency of M-GR was 25.5%, which was attributed to only adsorption, with no oxidation occurring. As the H2O2 concentration increased from 0.049 M to 0.147 M, the decolorization efficiency improved from 90.4% to 95.9%. However, a further increase to 0.196 M resulted in a decrease to 93.4%. A similar trend of increasing efficiency up to optimum H2O2 concentration followed by decline has also been reported in the literature (Singh et al., Reference Singh, Singh and Srivastava2018; Huang et al., Reference Huang, Qi, Gao, Zhang and Zhao2020).
Effect of: (a) H2O2 concentration, (b) XG-CF-K amount, and (c) pH (C M-GR: 20 mg L–1, XG-CF-K amount: 1 g L–1 (for a,c), CH2O2: 0.147 M (for b, c), pH: 6 (for a, b), T: 25°C, t: 20 min), (d) zeta potential of XG-CF-K.

Figure 4. Long description
The figure consists of four panels labeled a through d.
Panel a is a bar chart. The y-axis is Decolorization of M-G R percentage from 0 to 100. The x-axis is H sub 2 O sub 2 concentration in M. At 0 M, decolorization is approximately 25 percent. It jumps to 90 percent at 0.049 M and reaches a plateau near 95 percent for concentrations 0.098, 0.147, and 0.196 M.
Panel b is a bar chart. The y-axis is Decolorization of M-G R percentage. The x-axis is X G-C F-K amount in g forward slash L. At 0 g forward slash L, decolorization is near 7 percent. It increases sharply to 85 percent at 0.6 g forward slash L and peaks at approximately 96 percent at 1.0 g forward slash L before slightly decreasing at 1.2 g forward slash L.
Panel c is a bar chart. The y-axis is Decolorization of M-G R percentage. The x-axis is p H. At p H 3.5, decolorization is approximately 68 percent. At p H 6, 8, and 10, the decolorization remains stable and high at approximately 96 percent.
Panel d is a line graph. The y-axis is Zeta potential in m V ranging from minus 55 to minus 25. The x-axis is p H ranging from 2 to 10. The curve starts at p H 3 with a zeta potential of minus 29 m V, drops to minus 44 m V at p H 5, reaches a minimum of minus 50 m V at p H 7.5, and rises to minus 46 m V at p H 9.
The increase in H2O2 concentration up to the optimum level enhanced the generation of sufficient •OH radicals through the Fenton reaction (Huang et al., Reference Huang, Yang, Zeng and Zhou2023). Beyond this concentration, excessive H2O2 may react with •OH radicals to produce hydroperoxyl radicals (•O2H) which have a much lower oxidation potential than •OH. This reaction leads to the consumption and scavenging of •OH radicals (Eqns (2) and (3)) (Singh et al., Reference Singh, Singh and Srivastava2018; Huang et al., Reference Huang, Qi, Gao, Zhang and Zhao2020):


The effect of XG-CF-K dosage was investigated in the range 0–1.2 g L–1 at an M-GR concentration of 20 mg L–1, an H2O2 concentration of 0.147 M, 25°C, and reaction time of 20 min (Fig. 4b). In the absence of XG-CF-K (using only H2O2), the decolorization efficiency was 7.5%. As the XG-CF-K dosage increased from 0.6 to 1 g L–1, the decolorization efficiency improved from 85.3 to 95.9%. However, a further increase to 1.2 g L–1 resulted in a slight decrease to 94.5%. A similar observation has also been reported in literature (Findik, Reference Findik2025a; Findik, Reference Findik2025b). The low decolorization efficiency observed with H2O2 alone was attributed to its weak oxidation ability (Liu et al., Reference Liu, Du, Sun, Chang and Peng2019). In contrast, significantly higher efficiency was achieved in the presence of both XG-CF-K and H2O2. This enhancement was due to •OH radicals generated from the reaction of H2O2 with iron on the catalyst surface. The synergistic effect between the adsorbed peroxide and the XG-CF-K composite further improved the degradation of the organic compounds (Ayadi et al., Reference Ayadi, Khaled, Halladja, Boudraa, Rehimi and Chehimi2022). Moreover, increasing the XG-CF-K dosage provided a larger surface area and more abundant active sites on the catalyst surface, thereby facilitating oxidant activation and the production of additional reactive oxygen species (Guo et al., Reference Guo, Zhang, Chen, Ahmad, Fida and Zhang2022).
To investigate the effect of pH on Fenton-like decolorization, experiments were performed at different initial pH values of the M-GR solution ranging from 3.5 to 10 (Fig. 4c). The pH was adjusted only at the beginning of each experiment, and no further control was applied during the reaction. At pH 3.5, the decolorization efficiency of M-GR was 68%. As the initial pH increased to 6, the efficiency rose to 95.9%. At pH 8 and pH 10, similar efficiencies of ~96.7% were obtained, indicating no significant improvement beyond pH 6. Previous studies have also reported low decolorization of M-GR under acidic conditions, such as pH 4 (Findik, Reference Findik2025b). The reduced performance at pH 3.5 can be attributed to the formation of oxonium ions (H3O2+) through proton solvating of H2O2. This species stabilizes H2O2 by making it more electrophilic, thereby reducing its reactivity with iron ions (Huang et al., Reference Huang, Qi, Gao, Zhang and Zhao2020). The zeta potential of XG-CF-K was measured at different pH values (Fig. 4d), indicating that XG-CF-K exhibits a negatively charged surface across the investigated pH range. A negative zeta potential indicates a low degree of coagulation (Hassan et al., Reference Hassan, Al-Kindi and Ghanim2020). As M-GR is a cationic dye, electrostatic attraction occurs between M-GR molecules and the negatively charged XG-CF-K surface, facilitating adsorption and subsequent degradation.
It should be noted that pH 6 corresponds to the natural pH of the M-GR solution, without adjustment. Although the highest decolorization efficiency was obtained at pH 8, subsequent experiments were conducted at pH 6, as it represents the unmodified solution condition.
The effect of temperature was investigated in the range of 25–45°C at M-GR concentrations between 10 and 50 mg L–1, an XG-CF-K dosage of 1 g L–1, an H2O2 concentration of 0.147 M, pH 6, and reaction time of 20 min (Fig. 5a). The decolorization efficiency increased with rising temperature. At elevated temperatures, the oxidation reaction between XG-CF-K and H2O2 is accelerated, leading to increased production of •OH radicals. Moreover, higher temperatures enhance the mobility of dye molecules and provide them with sufficient energy to overcome the activation energy barrier, thereby facilitating their transport to active sites and promoting the generation of reactive species for the oxidative degradation of M-GR molecules (Yao et al., Reference Yao, Chen, Lian, Wei, Zhang, Wu, Chen and Wang2016; Hassan et al., Reference Hassan, Al-Kindi and Ghanim2020; Bhaumik et al., Reference Bhaumik, Maity and Brink2022). Similar observations have been reported in previous studies (Findik, Reference Findik2025a; Findik, Reference Findik2025c).
Effect of (a) temperature and (b) salt (C M-GR: 20 mg L–1 (for b), amount of XG-CF-K: 1 g L–1, C H2O2: 0.147 M, pH: 6, T: 25°C (for b), t: 20 min) on the decolorization of M-GR.

Figure 5. Long description
The image consists of two side-by-side grouped bar charts labeled a and b.
Panel a: The y-axis is Decolorization of M G R (%) ranging from 0 to 100. The x-axis is Initial M G R concentration (m g / L) with values 10, 20, 30, 40, and 50. Each concentration has three bars representing temperatures: 25 degrees Celsius (blue), 35 degrees Celsius (orange), and 45 degrees Celsius (grey). At 10 m g / L, all temperatures show nearly 100% decolorization. As the concentration increases to 50 m g / L, the 25 degrees Celsius bar shows a significant decrease to approximately 80%, while the 45 degrees Celsius bar maintains the highest efficiency at nearly 95%.
Panel b: The y-axis is Decolorization of M G R (%) ranging from 70 to 100. The x-axis shows two salt types: N a C l and N a sub 2 S O sub 4. Each salt type has four bars representing concentrations: 0 (blue), 1 g / L (orange), 3 g / L (grey), and 5 g / L (yellow). For both salts, the decolorization percentage slightly decreases as salt concentration increases. The 0 concentration bar is the highest at approximately 96%, while the 5 g / L concentration bars for both salts drop to approximately 93%. Error bars are present on all data points in both panels.
In textile manufacturing, various chemicals, including metals and salts, are added to fibers during the dyeing process (Yaseen and Scholz, Reference Yaseen and Scholz2019). The presence of salts in wastewater can inhibit the generation of reactive free radicals in the Fenton process by scavenging or reacting with them (Ikhlaq et al., Reference Ikhlaq, Kazmi, Tufail, Fatima and Joya2018; Guo et al., Reference Guo, Zhang, Chen, Ahmad, Fida and Zhang2022), thereby reducing decolorization efficiency. In the present study, NaCl and Na2SO4 were used to evaluate the effect of salts (Fig. 5b). The decolorization efficiency decreased with addition of salt. While 95.9% decolorization of M-GR was achieved in the absence of salt, the efficiency dropped to 93.0% and 93.2% with the addition of 5 g L–1 NaCl and Na2SO4, respectively. This decrease can be explained by the fact that chloride ions act as •OH radical scavengers, reacting with •OH (Ikhlaq et al., Reference Ikhlaq, Kazmi, Tufail, Fatima and Joya2018; Li et al., Reference Li, Li, Cao, Zhao, Wang and Cheng2023a). Moreover, SO4– may also react with •OH to generate •SO4– (Li et al., Reference Li, Li, Cao, Zhao, Wang and Cheng2023a).
The effect of the initial M-GR concentration and reaction time on Fenton-like decolorization was investigated in the range of 10–50 mg L–1 M-GR and 5–45 min, using an XG-CF-K dosage of 1 g L–1, and H2O2 concentration of 0.147 M, at pH 6 and 25°C (Fig. 6a). The ionic strength was not kept constant in these experiments; however, its effect was investigated independently (Fig. 5b). After 45 min of reaction, the decolorization efficiency of M-GR decreased from 98% to 96%, 95.1%, 94.7% and 93.2% as the initial M-GR concentration increased from 10 mg L–1 to 20, 30, 40 and 50 mg L–1, respectively. The decrease in efficiency with greater initial concentrations can be attributed to the occupation of active sites on the XG-CF-K surface by a greater number of dye molecules and intermediates, while decolorization reaction occurs by the same amount of •OH radicals (Ghasemi et al., Reference Ghasemi, Mozaffari, Mousavi, Aghabarari and Abu-Zahra2021; Hadjltaief et al., Reference Hadjltaief, Bairq, Shi and Benzina2021). The decolorization rate of M-GR was very fast, with a steeper slope observed during the first 5 min of the reaction. After this period, the rate of decolorization declined gradually. This behavior can be explained by the fact that both M-GR and H2O2 concentrations were greatest at the beginning of the reaction. As the reaction progressed, the decreasing concentrations of M-GR and H2O2 led to a reduction in the decolorization rate (Huang et al., Reference Huang, Qi, Gao, Zhang and Zhao2020).
(a) Effect of the initial M-GR concentration on decolorization; (b) effect of the initial M-GR concentration on the initial degradation rate (XG-CF-K amount: 1 g L–1, C
H2O2: 0.147 M, pH: 6, T: 25°C, t: 5 min (for b)); (c) plot of
$ \frac{1}{r_0} $
 versus
$ \frac{1}{C_0} $
 .

Figure 6. Long description
Panel a: A line graph of Decolorization of M-G R percentage on the y-axis from 0 to 100 versus Reaction time in minutes on the x-axis from 0 to 50. Five curves represent initial concentrations from 10 to 50 m g per L. The 10 m g per L curve reaches nearly 100 percent decolorization within 5 minutes, while higher concentrations show slower asymptotic increases, with 50 m g per L reaching approximately 90 percent after 45 minutes.
Panel b: A line graph of r sub 0 in m g per L-min on the y-axis from 0 to 10 versus C sub 0 in m g per L on the x-axis from 0 to 60. Three curves represent temperatures of 25, 35, and 45 degrees Celsius. All curves show a non-linear increase in degradation rate as concentration increases, with the 45 degree Celsius curve showing the highest rate, reaching over 8 m g per L-min at a concentration of 50 m g per L.
Panel c: A linear plot of 1 all over r sub 0 on the y-axis from 0 to 0.6 versus 1 all over C sub 0 on the x-axis from 0 to 0.12. Three sets of data points for 25, 35, and 45 degrees Celsius are fitted with dashed linear regression lines. All three lines show a strong positive linear correlation, with the 25 degree Celsius line having the highest y-intercept and slope.
Kinetics of Fenton-like decolorization of M-GR
The initial concentration of M-GR significantly influences the initial decolorization rate (Fig. 6b). As the initial dye concentration increases, the decolorization rate also increases. The decolorization of M-GR using XG-CF-K can be described by an apparent pseudo-first order kinetic model, which can be attributed to the relatively low concentration of M-GR compared with that of H2O2.
Among various kinetic models, the Langmuir–Hinshelwood (L–H) model is used widely to describe heterogeneous catalytic reactions, as it relates the reaction rate to the concentration of the pollutant. This model is particularly suitable for processes occurring at the solid–liquid interface and involves two main steps: (1) adsorption of the organic substrate onto the catalyst surface; and (2) the surface reaction responsible for pollutant degradation (Samoila et al., Reference Samoila, Cojocaru, Sacarescu, Dorneanu, Domocos and Rotaru2017).
According to the pseudo-first order L–H kinetic model, the initial degradation rate can be expressed as given in Eqn (4) (Bizani et al., Reference Bizani, Fytianos, Poulios and Tsiridis2006; Dönmez et al., Reference Dönmez, Dükkanci and Gündüz2020; Riaz et al., Reference Riaz, Hassan, Siddique, Mahmood, Farooq, Sarwar and Khan2020):

where r 0 is the initial decolorization rate of M-GR (mg L–1 min–1), C 0 is the initial dye concentration (mg L–1), kapp is the apparent rate constant (min−1), k c is the rate constant (mg L–1 min–1), and K is adsorption coefficient (L mg–1).
The linearized form of Eqn (4) is expressed in Eqn (5):

The plot of
$ \frac{1}{r_0} $
 versus
$ \frac{1}{C_0} $
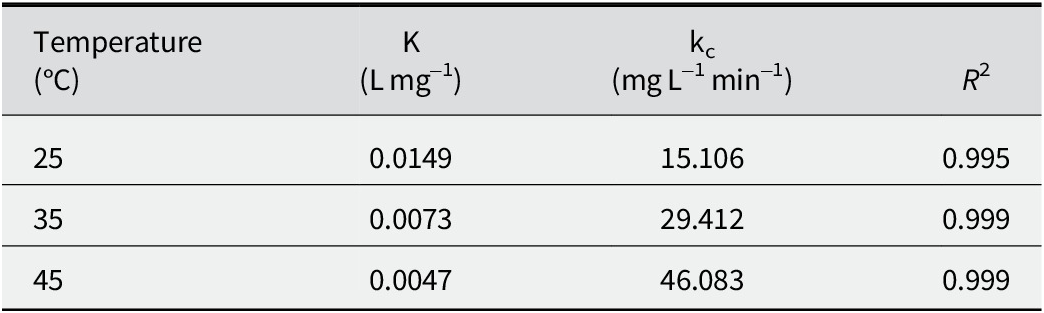
 yields a straight line (Fig. 6c). The constants K and kc obtained from the L–H model show high correlation coefficients (Table 1), indicating a good agreement between the experimental data and the model. These results demonstrate that the heterogeneous Fenton-like decolorization of M-GR can be described well by the L–H kinetic model. Furthermore, the results indicate that the decolorization process is governed predominantly by surface chemical reactions, while adsorption plays a secondary role (Samoila et al., Reference Samoila, Cojocaru, Sacarescu, Dorneanu, Domocos and Rotaru2017).
Kinetic constants for L-H kinetic model

Table 1. Long description
The table consists of four columns and four rows including the header.
Column headers from left to right are:
1. Temperature in degrees Celsius.
2. K in Liters per milligram.
3. k sub c in milligrams per Liter per minute.
4. R super 2.
Data rows are as follows:
* At 25 degrees Celsius: K is 0.0149, k sub c is 15.106, and R super 2 is 0.995.
* At 35 degrees Celsius: K is 0.0073, k sub c is 29.412, and R super 2 is 0.999.
* At 45 degrees Celsius: K is 0.0047, k sub c is 46.083, and R super 2 is 0.999.
Reusability and stability of XG-CF-K
The reusability and stability of XG-CF-K are critical parameters for potential industrial applications. After each experiment, XG-CF-K was collected, washed with distilled water, and dried at room temperature. The catalyst was reused for three consecutive cycles in the decolorization of M-GR under optimum conditions. The decolorization efficiency decreased slightly from 95.9% in the first cycle to 93.4% after the third cycle, indicating good reusability of XG-CF-K (Fig. 7a). The minor reduction in efficiency could be attributed to small molecules generated during dye decomposition that were adsorbed onto the composite surface, thereby occupying catalytic active sites (Deng et al., Reference Deng, Zhao, Luo, Wang and Tang2020).
(a) Reusability of XG-CF-K for M-GR decolorization (C M-GR: 20 mg L–1, amount of XG-CF-K : 1 g L–1, C H2O2: 0.147 M, pH: 6, T: 25°C, t: 20 min); (b) FTIR spectra of fresh and reused XG-CF-K; (c) XRD patterns of XG-CF-K before use and after the third use (R-XG-CF-K).

Figure 7. Long description
Panel a is a bar chart titled Decolorization of M G R percentage on the y axis from 0 to 100, and Number of cycle on the x axis with values 1, 2, and 3. Three green bars show high performance above 90 percent across all cycles.
Panel b is an F T I R spectrum with Transmittance percentage on the y axis from 40 to 100 and Wavenumber in inverse centimeters on the x axis from 400 to 4000. Two overlapping lines, black for X G C F K and red for R X G C F K, show major downward peaks at approximately 500, 1000, and 3400. The curves are nearly identical, indicating structural stability.
Panel c is an X R D pattern with Intensity in arbitrary units on the y axis and degrees 2 theta on the x axis from 0 to 90. The black line for fresh X G C F K shows sharp vertical peaks at 26, 32, 35, and 63 degrees. The red line for reused R X G C F K follows the same pattern but with significantly lower peak intensities, particularly at the 35 degree mark.
The stability of the catalyst was further assessed by FTIR and XRD analyses of fresh and third-cycle samples (Fig. 7b,c). The same characteristic peaks of XG-CF-K were observed after the third use, although their intensities were slightly reduced. In the XG-CF-K/H2O2 system, cobalt and iron leaching were measured by ICP-OES. For the first, second, and third cycles, cobalt leaching values were 0.72 mg L–1, 0.57 mg L–1, and 0.55 mg L–1, respectively, while iron leaching values were 0.47 mg L–1, 0.36 mg L–1, and 0.29 mg L–1, respectively. Cobalt leaching remained below the permissible limit for livestock watering (1 mg L–1) (Guo et al., Reference Guo, Zhang, Chen, Ahmad, Fida and Zhang2022) and iron leaching was less than the 2 mg L–1 limit set by the environmental standard imposed by the European Union (Lu et al., Reference Lu, Cao, Wei, Huo, Wang and Li2021).
Comparison of different processes
In the present study, the decolorization of M-GR was evaluated under various processes (Fig. 8). The performance of XG-CF-K, CF-K (without XG), XG-CF (without kaolin), CF (without both XG and kaolin), and kaolin (K) was examined under optimized conditions. In addition, the effects of H2O2 alone and its combination with XG-CF-K, XG-CF, CF-K, and CF were investigated.
Comparison of different treatment processes (C M-GR: 20 mg L–1, composite amount: 1 g L–1, C H2O2: 0.147 M, pH: 6, T: 25°C, t: 20 min).

Figure 8. Long description
A bar chart with a vertical y-axis labeled Decolorization of M dash G R in percent, ranging from 0 to 100 in increments of 20. The horizontal x-axis lists ten treatment conditions. From left to right, the green bars show the following approximate values.
* K: 13 percent.
* C F: 18 percent.
* C F dash K: 21 percent.
* X G dash C F: 28 percent.
* X G dash C F dash K: 25 percent.
* H sub 2 O sub 2: 8 percent.
* C F plus H sub 2 O sub 2: 88 percent.
* C F dash K plus H sub 2 O sub 2: 82 percent.
* X G dash C F plus H sub 2 O sub 2: 92 percent.
* X G dash C F dash K plus H sub 2 O sub 2: 96 percent.
Each bar includes a small black error bar at the top. There is a significant increase in decolorization efficiency when H sub 2 O sub 2 is added to the treatment processes.
The adsorption efficiencies of M-GR were 13.2%, 17.5%, 20.8%, 27.9%, and 25.5% for K, CF, CF-K, XG-CF, and XG-CF-K, respectively. In contrast, the decolorization efficiencies were 7.5%, 88.4%, 82.3%, 91.6%, and 95.9% when using H2O2 alone and in combination with CF, CF-K, XG-CF, and XG-CF-K. Clearly, the adsorption performances of XG-CF-K, XG-CF, CF-K, CF and K were significantly lower than their catalytic performances in the presence of H2O2, confirming that the removal of M-GR was dominated by catalytic oxidation rather than surface adsorption. Moreover, the XG-CF-K/H2O2 system exhibited a higher decolorization efficiency compared with CF/H2O2, CF-K/H2O2, and XG-CF/H2O2. The incorporation of XG, kaolin, and CoFe2O4 into XG-CF-K enhances the surface area, improves the pore structure, and increases the number of active sites and functional groups. The synergistic interaction among XG, kaolin, and CoFe2O4 in XG-CF-K may further enhange radical generation and catalytic activity. As a result, XG-CF-K achieved the highest decolorization efficiency among all tested systems.
Decolorization of other cationic dyes and COD removal
To further evaluate the Fenton-like decolorization performance of the catalyst toward other cationic dyes, methylene blue (M-BL) and methyl violet 2B (M-VI2B) were tested under the optimum conditions determined for M-GR (C dye: 20 mg L–1, XG-CF-K amount: 1 g L–1, C H2O2: 0.147 M, pH: 6, T: 25°C). The absorbance of M-BL was measured at 665 nm, while that of M-VI2B was measured at 584 nm. After 45 min of reaction, the decolorization efficiencies of M-GR, M-VI2B, and M-BL were 96%, 91% and 75.7%, respectively (Fig. 9a). For M-GR and M-VI2B, a similar trend was observed, with rapid decolorization during the initial stage of the reaction followed by a plateau after ~20 min. In contrast, the decolorization of M-BL continued to increase throughout the reaction period, suggesting that greater removal efficiencies might be achieved at longer reaction times. The observed differences in decolorization behaviour may be related to differences in the molecular structures of dyes (Fig. 9b). M-GR and M-VI2B possess triangular molecular structures, whereas M-BL has a linear structure. In M-BL, the positive charge is located at the center of the molecule, while in M-GR and M-VI2B it is positioned at the vertex. M-BL molecules strongly adsorb onto the negatively charged sites of the adsorbent through their sulfur groups. Owing to their linear structure, they spread across the surface and block neighboring adsorption sites, leading to a disordered distribution and lower efficiency (Yu et al., Reference Yu, Wei and Wu2015). In contrast, M-VI2B and M-GR interact mainly through their N+ groups, and due to electrostatic repulsion, most of their triangular structures remain away from the surface, minimizing site blockage (Findik, Reference Findik2025d; Yu et al., Reference Yu, Wei and Wu2015). Consequently, the blockage of active sites by M-BL molecules may also hinder the generation of •OH radicals, further reducing decolorization efficiency.
(a) Decolorization of different cationic dyes (C dye: 20 mg L–1, amount of XG-CF-K: 1 g L–1, C H2O2: 0.147 M, pH: 6, T: 25°C); (b) molecular structure of dyes used in the present study.

Figure 9. Long description
Panel a is a grouped bar chart. The y-axis is labeled Decolorization of dye in percent, ranging from 0 to 100. The x-axis is labeled Reaction time in minutes, with intervals at 5, 10, 15, 20, 30, and 45. Three dyes are represented: M-G R in green, M-V I 2 B in purple, and M-B L in light blue.
* M-G R shows a rapid increase from approximately 82 percent at 5 minutes to a plateau of 95 percent from 20 to 45 minutes.
* M-V I 2 B starts high at 88 percent and remains stable around 90 percent throughout the duration.
* M-B L shows a steady linear increase from 38 percent at 5 minutes to approximately 78 percent at 45 minutes.
Panel b displays three molecular structures arranged horizontally from left to right:
1. Malachite green: A triphenylmethane structure with two dimethylamino groups and a C l minus counterion.
2. Methyl violet 2 B: A similar triphenylmethane structure with an H C l molecule shown above it.
3. Methylene blue: A heterocyclic phenothiazine structure containing a central sulfur atom with a positive charge and a C l minus counterion.
It should be noted, however, that the L–H kinetic model was evaluated only for M-GR, which was selected as the target pollutant. As the corresponding adsorption and kinetic parameters were not determined for M-VI2B and M-BL, a quantitative comparison of the three dyes in terms of adsorption affinity and reaction kinetics cannot be made. Therefore, the above discussion should be regarded as a qualitative interpretation of the observed trends.
Decolorization alone does not confirm the complete mineralization of dyes into CO2 and H2O, as intermediate products are often generated during the degradation process. The COD values reflect the total concentration of organics in the solution, and their decrease is used to estimate the degree of mineralization of organic pollutants in water treatment (Modirshahla et al., Reference Modirshahla, Behnajady and Ghanbary2007; Sivakumar et al., Reference Sivakumar, Selvaraj, Ramasamy and Balasubramanian2013). In the Fenton-like system, COD removal of M-GR, M-BL and M-VI2B was evaluated under the optimum conditions. Samples were collected at 20, 30, and 45 min (Table 2). The COD analysis confirmed that both decolorization and partial mineralization occurred, with dye molecules being transformed into colorless intermediates (Sivakumar et al., Reference Sivakumar, Selvaraj, Ramasamy and Balasubramanian2013). Although 96%, 91%, and 75.7% decolorization were achieved for M-GR, M-VI2B and M-BL, respectively, within 45 min, COD removal was relatively low compared with decolorization efficiency. The lower COD removal can be attributed to the presence of colorless intermediates (Sivakumar et al., Reference Sivakumar, Selvaraj, Ramasamy and Balasubramanian2013). These intermediates are more difficult to degrade, and their oxidization rate can be significantly slower than that of the parent dye molecules (El Allaoui et al., Reference El Allaoui, Benzeid, Zari, Qaiss and Bouhfid2024). The COD removal increased with reaction time, suggesting that extended reaction periods may enhance mineralization further.
Comparison of COD removal and decolorization of different cationic dyes (C dye: 20 mg L–1, XG-CF-K dosage: 1 g L–1, C H2O2: 0.147 M, pH: 6, T: 25°C)

Table 2. Long description
The table consists of seven columns. The first column is Reaction time in minutes, with rows for 20, 30, and 45 minutes. The remaining columns are grouped in pairs for three dyes: M-GR, M-VI2B, and M-BL. Each dye has two metrics: Decolorization percentage and C O D removal percentage.
* For M-GR: At 20 minutes, decolorization is 95.90 and C O D removal is 13.5. At 30 minutes, decolorization remains 95.90 and C O D removal increases to 19.1. At 45 minutes, decolorization is 96.00 and C O D removal is 24.7.
* For M-VI2B: At 20 minutes, decolorization is 91.00 and C O D removal is 17.30. At 30 minutes, decolorization remains 91.00 and C O D removal increases to 27.40. At 45 minutes, decolorization remains 91.00 and C O D removal is 32.80.
* For M-BL: At 20 minutes, decolorization is 56.10 and C O D removal is 21.60. At 30 minutes, decolorization is 65.80 and C O D removal is 31.10. At 45 minutes, decolorization is 75.70 and C O D removal is 39.10.
Possible reaction mechanism
Fenton-like decolorization of M-GR using the XG-CF-K catalyst in the presence of H2O2 increased with reaction time. To analyze the decolorization mechanism of M-GR and identify changes in its structural characteristics, the absorbance of M-GR at different wavelengths was monitored over a 45 min reaction period (Fig. 10a). The characteristic peak of M-GR at 618 nm decreased rapidly after 5 min. This result indicates that the structure of M-GR was disrupted and its chromophoric groups were degraded during the Fenton-like process. As a result, intermediate products, water, and carbon dioxide were formed.
(a) Changes in absorbance with wavelength over the reaction time; (b) effect of different scavengers on the decolorization of M-GR (C M-GR: 20 mg L–1, XG-CF-K amount: 1 g L–1, C H2O2: 0.147 M, pH: 6, T: 25°C, t: 20 min (for b)).

Figure 10. Long description
Panel a is a line graph titled a. The y-axis is Absorbance in a dot u units ranging from 0 to 1.8. The x-axis is Wavelength in n m ranging from 400 to 800. A series of curves represent reaction times from 0 to 45 minutes. At 0 minutes, a prominent peak reaches approximately 1.6 at 620 n m and a smaller peak reaches 0.35 at 420 n m. As time progresses to 5, 10, 15, 20, 30, and 45 minutes, these peaks rapidly decrease until the line is nearly flat at the baseline by 45 minutes.
Panel b is a bar chart titled b. The y-axis is Decolorization of M minus G R in percent ranging from 70 to 100. The x-axis lists Scavengers. Five green bars represent different conditions. From left to right:
1. No scavenge shows approximately 96 percent.
2. 0.28 M D M S O shows a decrease to approximately 87 percent.
3. 0.35 M Et O H shows approximately 94 percent.
4. 1.45 m M K I shows the lowest value at approximately 86 percent.
5. 0.025 M Na N sub 3 shows approximately 96 percent.
Quenching experiments were conducted to identify the reactive species generated during the Fenton-like decolorization of M-GR with H2O2 and to elucidate the underlying mechanism. For this purpose, dimethyl sulfoxide (DMSO), EtOH, potassium iodide (KI), and sodium azide (NaN3) were employed as scavenging agents. EtOH, DMSO and KI act as a •OH scavengers, whereas NaN3 serves as a scavenger for 1O2 (Gan and Li, Reference Gan and Li2013; Guo et al., Reference Guo, Zhang, Chen, Ahmad, Fida and Zhang2022). Alcohols are the most commonly used scavengers for •OH, and they may quench •OH radicals either bound to the catalyst surface or present in the bulk solution, depending on their affinity to the surface. However, the interactions between individual alcohols and specific catalyst surfaces vary, making generalizations difficult. KI is typically used to quench surface-bound •OH (Li et al., Reference Li, Yin, Cheng, Qin, Liu, Yi, Zhang, Fu, Yang, Zhou, Zeng and Lai2023b). As observed, the decolorization efficiency did not change when NaN3 was used, whereas the presence of other scavengers led to a decrease in efficiency compared with the control without scavengers (Fig. 10b). These results indicate that •OH radicals are generated both on the catalyst surface and in the bulk solution during the Fenton-like process.
The possible decolorization mechanism can be explained based on the scavenger experiments and supporting literature. Firstly, dye molecules and H2O2 diffuse into the solution and adsorb onto the surface of XG-CF-K (Liu et al., Reference Liu, Du, Sun, Chang and Peng2019; Findik, Reference Findik2025a). The Fe2+/Fe3+ and Co2+/Co3+ species are then involved in the activation of H2O2 (Liu et al., Reference Liu, Chen, Hao, Tang, Jiang, Li, Tian, Yan, Luo and Jia2022). The Co2+ and Fe2+ species on the surface of XG-CF-K react with H2O2 to generate •OH radicals (Eqns (6) and (7)) (Hong et al., Reference Hong, Li, He, Saeed, Zhang, Wang, Kong and Liu2020; Li et al., Reference Li, Li, Cao, Zhao, Wang and Cheng2023a). The resulting Co3+ and Fe3+ species can subsequently react with H2O2 to regenerate Co2+ and Fe2+ (Eqns (8) and (9)) (Hong et al., Reference Hong, Li, He, Saeed, Zhang, Wang, Kong and Liu2020; Liu et al., Reference Liu, Chen, Hao, Tang, Jiang, Li, Tian, Yan, Luo and Jia2022; Li et al., Reference Li, Li, Cao, Zhao, Wang and Cheng2023a). In addition, Co3+ can also be reduced back to Co2+ through reactions with Fe2+ (Eqn (10)) (Hong et al., Reference Hong, Li, He, Saeed, Zhang, Wang, Kong and Liu2020; Liu et al., Reference Liu, Chen, Hao, Tang, Jiang, Li, Tian, Yan, Luo and Jia2022). Finally, the dye molecules react with •OH radicals, leading to the formation of indermediates, CO2 and H2O (Eqn (11)) (Li et al., Reference Li, Li, Cao, Zhao, Wang and Cheng2023a):


Comparison of XG-CF-K with other catalysts
The decolorization efficiency of XG-CF-K was compared with that of other catalysts reported in the literature (Table 3). The decolorization performance depends on reaction parameters such as catalyst amount, pH, temperature, and reaction time. The XG-CF-K exhibited good performance under nearly neutral conditions and required a relatively short reaction time compared with other catalysts. Although the decolorization efficiency was high, COD removal was lower than the decolorization rate. However, in this study, the COD removal efficiency was higher than that obtained in our previous studies (Findik, Reference Findik2025a; Findik, Reference Findik2025b). These results demonstrate that XG-CF-K is a promising alternative material for wastewater-treatment applications.
Comparison of decolorization efficiency of XG-CF-K with other composites

Table 3. Long description
The table contains 10 columns: Catalyst, Dye, Dye concentration in m g L sub -1, Catalyst amount in g L sub -1, H sub 2 O sub 2 concentration, Temperature in degrees Celsius, p H, Time in minutes, Decolorization percentage, and References.
* Row 1: F e sub 3 O sub 4 all over M M T catalyst with M-B L dye at 50 m g L sub -1 concentration, 0.5 g L sub -1 catalyst, 0.19 M H sub 2 O sub 2, 20 degrees Celsius, p H 3, 120 minutes, achieving 90 percent decolorization.
* Row 2: C o F e sub 2 O sub 4 catalyst with R R dye at 40 m g L sub -1 concentration, 1 g L sub -1 catalyst, 200 m M H sub 2 O sub 2, 22 degrees Celsius, p H 7.2, 270 minutes, achieving 91.14 percent decolorization.
* Row 3: C o F e sub 2 O sub 4 catalyst with R h-B dye at 20 m g L sub -1 concentration, 0.5 g L sub -1 catalyst, 10 m M H sub 2 O sub 2, p H 3, 90 minutes, achieving 95.5 percent decolorization.
* Row 4: m-C M C-K catalyst with M-V I 2 B dye at 50 m g L sub -1 concentration, 0.5 g L sub -1 catalyst, 35.4 m M H sub 2 O sub 2, 23 degrees Celsius, p H 6.5, 45 minutes, achieving 88.9 percent decolorization.
* Row 5: m-X G-Zeo catalyst with M-G R dye at 20 m g L sub -1 concentration, 1 g L sub -1 catalyst, 23.6 m M H sub 2 O sub 2, 20 degrees Celsius, p H 6, 10 minutes, achieving 96.7 percent decolorization.
* Row 6: X G-C F-K catalyst (this study) tested against three dyes at 20 m g L sub -1 concentration, 1 g L sub -1 catalyst, 0.147 M H sub 2 O sub 2, 25 degrees Celsius, p H 6, and 45 minutes. Decolorization results are 96 percent for M-G R, 91 percent for M-V I 2 B, and 75.7 percent for M-B L.
Conclusions
In this study, a novel catalyst (XG-CF-K) composed of xanthan gum (XG), kaolin, and CoFe2O4 was synthesized successfully. XG-CF-K exhibited a BET surface area of 58.55 m2 g–1 and a magnetic saturation of 27.2 emu g–1. The catalyst demonstrated excellent performance for the decolorization of malachite green (M-GR) via a heterogeneous Fenton-like oxidation process. Under optimized conditions (1 g L–1 catalyst dosage, 20 mg L–1 M-GR concentration, pH 6, 0.147 M H2O2, 25°C, and 20 min), a decolorization efficiency of 95.9% was achieved. The decolorization kinetics followed a pseudo-first order model and were well described by the Langmuir–Hinshelwood kinetic mechanism. XG-CF-K also showed good stability and reusability, with minimal metal leaching remaining within permissible limits. A plausible degradation mechanism was proposed. Furthermore, the catalyst was effectively applied to other cationic dyes, including methylene blue and methyl violet 2B, achieving high decolorization efficiencies. Although the decolorization performance was high, COD removal remained relatively low compared with color removal. COD reduction could be improved by extending the reaction time or by further optimizing and enhancing the composite structure. Overall, the findings of this study indicate that, with structural improvements, XG-CF-K has strong potential as an alternative catalyst for wastewater-treatment applications.
Acknowledgments
None.
Data availability statement
Data will be made available on request.
Author contributions
Serap Fındık: conceptualisation, methodology, writing, original draft, data curation, and editing.
Financial support
No financial support was received for this work.
Competing interests
The author declares no competing interests.







 Open access

