INTRODUCTION
Tillage involves the mechanical modification of soil structure by tension, cutting or compression (Chamen Reference Chamen2000). While tillage is carried out for weed control, removal of compaction and levelling of the soil surface, the main aim is to create a seedbed for uniform seedling emergence and crop development (Cannell Reference Cannell1985). Existing tillage systems in cool Atlantic climates can be classified as either conventional or conservation tillage. Conventional tillage refers to mouldboard ploughing while conservation tillage, also known as minimum tillage or reduced tillage, refers to a range of non-inversion tillage systems that typically leave 0·30 of the soil surface covered with residues after planting (Davies & Finney Reference Davies and Finney2002). Conservation tillage systems were initially developed in more arid climates to protect the soil from wind and water erosion and conserve soil moisture (Doran Reference Doran1980; Van Den Bossche et al. Reference Van Den Bossche, De Bolle, De Neve and Hofman2008), and while the sustainability benefits arising from these systems are also considered in cool Atlantic climates (Holland Reference Holland2004), recent interest in conservation tillage in this region has mainly arisen from a need to reduce the costs and the amount of time and labour associated with crop establishment (Hansen et al. Reference Hansen, Munkolm and Olesen2011).
Spring barley is an important crop in the cool Atlantic climate regions of Northern Europe. In Ireland, for example, spring barley is grown on 150 000 ha accounting for almost half of the arable area and produces an average grain yield of 6·7 t/ha at 85% dry matter (DM) (CSO 2010). The dominant system for spring barley establishment in cool Atlantic climates is conventional tillage, which involves mouldboard ploughing to 175–280 mm depth followed by a secondary cultivation prior to, or in combination with, sowing. While conservation tillage systems are frequently used to establish winter-sown cereal crops, they are rarely used for spring barley establishment in these regions. The use of conservation tillage in the spring can result in a delayed sowing date and poor early spring growing conditions due to slower soil drying (Nyborg & Malhi Reference Nyborg and Malhi1989; Soane et al. Reference Soane, Ball, Arvidsson, Basch, Moreno and Roger-Estrade2012). The slower drying is due to the absence of porous plough furrows and increased volumetric heat capacity in reduced tillage (RT) soils combined with the insulation effect of crop residues (Rasmussen Reference Rasmussen1999). Other reasons for the limited use of conservation tillage for spring barley establishment include reduced drainage (Lopez-Bellido & Lopez-Bellido Reference Lopez-Bellido and Lopez-Bellido2001), grass weed problems (Forristal & Murphy Reference Forristal and Murphy2009) and lower soil nitrogen (N) levels (Francis & Knight Reference Francis and Knight1993).
Although autumn-sown crops established by conservation tillage are capable of producing grain yields similar to those produced by conventionally established crops (Machado et al. Reference Machado, Petrie, Rhinhart and Qu2007; Sip et al. Reference Sip, Ruzek, Chrpova, Vavera and Kusa2009) this may not be the case with spring crops, which have a shorter time period in which to develop an adequate root system and are more sensitive to adverse soil conditions (Hodgson et al. Reference Hodgson, Proud and Browne1977), often encountered with conservation tillage in difficult years (Lopez-Bellido & Lopez-Bellido Reference Lopez-Bellido and Lopez-Bellido2001). Previous studies in cool oceanic climates have reported slower growth patterns and lower grain yields when spring barley established by conservation tillage was subjected to cold and wet soil conditions in early spring (Riley et al. Reference Riley, Bleken, Abrahamsen, Bergjord and Bakken2005; Machado et al. Reference Machado, Petrie, Rhinhart and Qu2007).
The extended time period between harvest and sowing of the following spring barley crop provides multiple opportunities for soil tillage. Børresen (Reference Børresen1999) found tillage in spring alone produced higher yields than tillage in autumn and spring. In contrast, Riley et al. (Reference Riley, Bleken, Abrahamsen, Bergjord and Bakken2005, Reference Riley, Børresen and Lindemark2009) reported higher yields with tillage in autumn and spring compared to spring alone. Forristal & Murphy (Reference Forristal and Murphy2009) reported poor establishment conditions and lower yields with tillage in the autumn alone. While the contrasting results of these studies demonstrate that tillage timing can influence spring barley performance, the optimum timing and number of passes remain unknown.
The degree of soil disturbance as affected by the tillage system has been shown to influence plant/soil N dynamics (Power & Peterson Reference Power and Peterson1998; Lopez-Bellido & Lopez-Bellido Reference Lopez-Bellido and Lopez-Bellido2001). Conservation tillage promotes the build-up of soil organic matter (SOM) content in the soil surface layer (Van Den Bossche et al. Reference Van Den Bossche, De Bolle, De Neve and Hofman2008; Simon et al. Reference Simon, Javurek, Mikanova and Vach2009), which can be mineralized to provide a significant proportion of inorganic soil N for crop uptake (Olk Reference Olk, Schepers and Raun2008). However, the lower degree of soil disturbance with conservation tillage can reduce N mineralization and the supply of soil N compared to conventional systems (Nyborg & Malhi Reference Nyborg and Malhi1989; Francis & Knight Reference Francis and Knight1993). In addition, the accumulation of crop residue on the soil surface with conservation tillage can promote N immobilization (Knowles et al. Reference Knowles, Hipp, Graff and Marshall1993). To compensate for reduced soil N supply, McConkey et al. (Reference McConkey, Curtin, Campbell, Brandt and Selles2002) suggested that N application rates should be increased with conservation tillage.
In contrast, other studies have found that the use of conservation tillage systems has little effect on the fertilizer N uptake of the growing crop (Giacomini et al. Reference Giacomini, Recous, Mary and Aita2007) and as a result, found no case for proposing increased N application rates (Riley Reference Riley1998; Thomsen & Christensen Reference Thomsen and Christensen2007).
While previous studies have determined the suitability of RT for winter wheat establishment in cool Atlantic climates such as Ireland (Fortune et al. Reference Fortune, Kennedy, Mitchell, Dunne, Murphy, Connery and Grace2005; Forristal & Murphy Reference Forristal and Murphy2009), the results with spring barley appear to be more challenging (Forristal & Murphy Reference Forristal and Murphy2009; Soane et al. Reference Soane, Ball, Arvidsson, Basch, Moreno and Roger-Estrade2012). Despite these challenges, escalating production costs have increased the demand for establishment systems that can lower expenditure without reducing yield potential. The aim of the current experiment was to compare the effects of conventional and conservation tillage systems with varying tillage timings on the establishment, grain yield, nitrogen use efficiency (NUE) and the N uptake pattern of monoculture spring barley, in a cool Atlantic climate. The hypothesis was that the variable cool Atlantic climate would present extra challenges for RT conservation systems.
MATERIALS AND METHODS
Site description
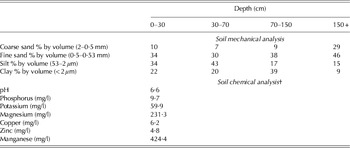
The experiment was conducted with spring barley (Hordeum vulgare) during the 2009, 2010 and 2011 growing seasons at the Teagasc Crops Research Centre, Knockbeg site (52°86′87N, −6°94′14W; 57 m a.s.l.) near Carlow, Ireland. The site has been growing spring barley in monoculture since the experiment commenced in 2007, during which time tillage systems have been continuously differentiated as part of a permanent cultivation systems trial. The soil type is an Alfisol Orthic Typudalf and its texture is a medium clay loam of the Mortarstown series. A full soil description is given in Table 1. The average annual temperature at the site is 9·5 °C and the mean annual rainfall is 789·4 mm.
Soil characteristics of the experimental site (Knockbeg Research Farm)*

* Soil type: medium clay loam. USDA Classification: Alfisol Orthic Typudalf.
† Soil chemical analysis conducted according to procedures outlined by Byrne (Reference Byrne1979).
Experimental design
A split-plot design arranged in randomized complete blocks with five replicates was used. The main plot factor was tillage treatment. There were four tillage treatments: conventional ploughing in spring (CT), reduced tillage with autumn only tillage (RT A), reduced tillage with spring only tillage (RT S); reduced tillage with both autumn and spring tillage (RT A+S). The split-plot factor was N treatment. Five rates of fertilizer N (0, 75, 105, 135 and 165 kg N/ha) were used. Main plot size was 30×20 m and split-plot size was 2·7×10 m. To avoid residual N carry-over between years, each main plot was divided into two equally sized sections. Split-plot treatments were alternated between sections each year, with a standard N rate (135 kg N/ha) applied to the section not being used for experimental measurements. Crop residues were removed during the period studied.
The RT A and RT A+S plots were cultivated following the harvest of the previous crop (September) to 70–100 mm with a tine cultivator (Horsch Maschinen GmbH, Sitzenhof, Germany) and rolled to allow volunteers and weeds to emerge. All other treatment plots were left undisturbed over the winter period. A non-selective herbicide was applied to all plots in February. The CT plots were mouldboard ploughed in early March to a depth of 225 mm. Two days before sowing in March, the RT A+S and RT S treatments were cultivated with the same tine cultivator. The CT treatments were cultivated with a rotary power harrow to 100 mm at the same time. All plots were sown on the same day with a cultivator drill (Vaderstad Rapid) fitted with disc coulters (Vaderstad-Verken AB, Hogstadvagen, Vaderstad, Sweden). The complete experimental area was ring-rolled after planting.
Crop management
The barley cultivar Snakebite was planted each year at a seeding rate of 300 seeds m2 with sowing dates of 24, 15 and 23 March in 2009, 2010 and 2011, respectively. The crop was managed according to normal commercial practice, with the exception of N application rates. A weed control programme was applied 4 weeks after planting and a two-application fungicide programme focusing on Rhynchosporium was used for disease control.
Nitrogen was applied as calcium ammonium nitrate (27% N) using a modified seed drill at crop emergence (0·5 of the total amount) and at Zadoks decimal growth stage (GS) 25 (0·5 of the total amount) (Zadoks et al. Reference Zadoks, Chang and Konzak1974).
Crop sampling
Plant density (plants/m2) was determined following emergence each year by counting the number of plants at three random locations within each split-plot. Crop N uptake sampling commenced each year prior to the second N application (GS 25) and was conducted again at GS 39–41, GS 53–55, GS 69–71 and immediately prior to harvest, dividing the main growing season into four crop growth phases (GS 25 to 39–41; GS 39–41 to 53–55; GS 53–55 to 69–71; GS 69–71 to harvest). Plants from three randomly selected 0·5 m row lengths within each split-plot were cut at ground level and bundled together as one composite sample for analysis. Samples were oven-dried at 65 °C to a constant mass and weighed for DM determination. Dried samples were finely ground (<2·0 mm) in a cutting mill (RetschMühle, Retsch GmbH Haan, Germany) and analysed for total N using the Dumas combustion method (Dumas Reference Dumas1831) with a Leco FP 328 autoanalyser (LECO Corporation, St. Joseph, MI, USA). At crop maturity, crop sampling was conducted in a similar fashion. Ears in each sample were counted to determine ears/m2. Samples were threshed to determine grains/ear. Straw was oven-dried, ground and analysed for total N content as above. The trials were harvested using a Deutz-Fahr plot-combine (SDF Group Treviglo, Italy) with harvest dates of 24, 16 and 22 August in 2009, 2010 and 2011, respectively. Plot yield was recorded, adjusted to 15% moisture content and grain N content was analysed by near infrared spectroscopy (Infratec 1241, Foss A/S, Hillerød, Denmark).
Nitrogen use efficiency, as defined by Moll et al. (Reference Moll, Kamprath and Jackson1982) was calculated as the yield of grain (85% DM) achieved per unit of N available to the crop and expressed in kg/kg. Nitrogen available to the crop was calculated as the sum of applied fertilizer N and harvest N accumulation at 0 kg N/ha for each tillage treatment. Nitrogen uptake efficiency (NUpE) was calculated as the total plant N accumulated above ground while nitrogen utilization efficiency (NUtE) was calculated as the grain produced per N accumulated in the plant (Moll et al. Reference Moll, Kamprath and Jackson1982). Both are expressed in kg/kg.
Statistical Analysis
Combined analysis of variance over the three years was carried out on yield and NUE data. Tillage, N rate and year were included as fixed effects; blocks and blocks × tillage were included as random effects. When significant effects of year, tillage and their interactions were found, least-square means were separated by independent pairwise t tests.
When significant effects of N rate or its interactions with other treatment factors were detected, stepwise regression analysis with groups, using N rate as a quantitative factor, was carried out. Linear and quadratic effects and their interactions with the other treatment factors were sequentially tested. Only significant effects were included in the final model. The resulting quadratic regression equations were of the form:
 $$Y = a + bx + cx^2 $$
where Y is the predicted grain yield (t/ha) or NUE (kg grain/kg N), x is the N fertilizer rate (kg N/ha) and the parameters a (intercept), b (linear coefficient) and c (quadratic coefficient) include all adjustments for the other factors.
All analyses above were carried out using the MIXED procedure of SAS 9·3 with P=0·05 (SAS 2011) and the GENSTAT 13 package (Payne et al. Reference Payne, Murray, Harding, Baird and Soutar2010) was used to carry out ANOVA of plant density and yield component data and N uptake during the growing season.
All mean comparisons were adjusted as appropriate for multiplicity effects using Tukey's adjustments for the P values. Residuals for all analyses were checked to ensure that there were no departures from the main assumptions of the analysis (normality and constant variance) and responses were transformed as required.
RESULTS
Weather conditions
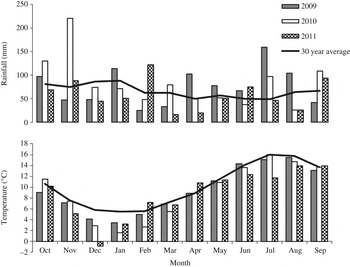
Cumulative rainfall amounts for each month and monthly mean temperatures for the three years in comparison with the 30-year mean values are presented in Fig. 1. There was a large variation in rainfall amounts within and between years, with monthly amounts ranging from 16·0 to 220·2 mm. Cumulative rainfall for the growing season (March–August) was above average (331·8 mm) in 2009 (514·5 mm), similar to the average in 2010 (340·9 mm) and below average in 2011 (233·8 mm).
Monthly cumulative rainfall amounts and mean air temperatures for the three experimental years, 2009–2011.

Monthly mean air temperatures during the growing season ranged from 5·5 to 16 °C. Temperatures were close to the 30-year mean during the 2009 and 2010 growing seasons, while the 2011 season was cool with temperatures between 1·8 and 4·3 °C below average.
Plant density and yield components
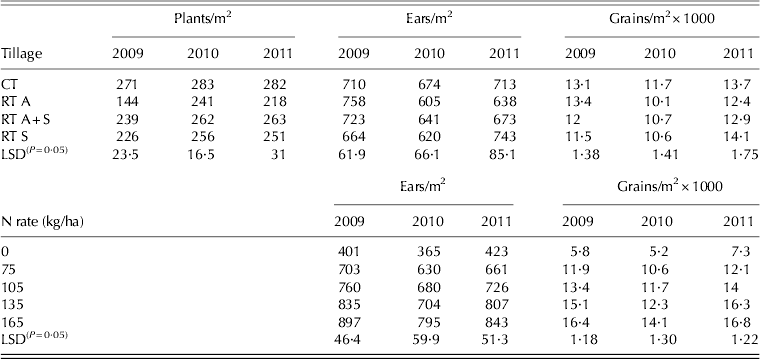
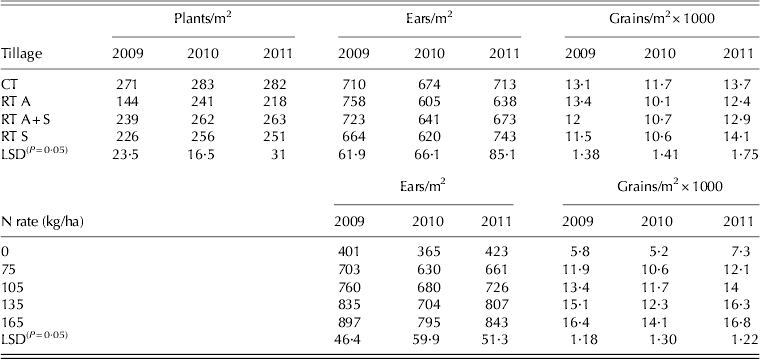
The effects of tillage system, straw treatment and N rate on yield components are presented in Table 2.
The effect of tillage treatment and nitrogen rate on plant density, and yield components for the three years 2009–2011
LSD, least significant difference (Tukey's adjusted P<0·05).
Tillage had a significant effect (P<0·05) on plant density, but its effect varied between years. The CT treatment had the highest plant density throughout the experiment and a significantly (P<0·05) higher plant density than the three RT treatments in 2009 and 2010. The RT A treatment had the lowest plant population in all three years, which was significantly (P<0·05) lower than the other treatments in 2009 and 2011.
Nitrogen application increased ear numbers. Ears/m2 increased significantly (P<0·05) with N increments up to 135 kg N/ha in each year of the study. The effect of tillage system on ears/m2 varied between years. Despite having the lowest plant population, the RT A system produced the highest number of ears/m2 in 2009, significantly (P<0·05) more than the RT S treatment. In contrast, the RT A system produced the lowest number of ears/m2 in both 2010 and 2011. The CT and RT S treatments had the greatest number of ears/m2 in 2010 and 2011, respectively, and both had significantly (P<0·05) more than the RT A treatments in the respective years.
Similar to ears/m2, N application also increased grain numbers. In 2009 and 2010, N application up to 165 kg N/ha significantly (P<0·05) increased grains/m2. The effect of tillage on grains per m2 followed a similar pattern to its effect on ears/m2, suggesting a minimal effect of the tillage system on the number of grains/ear in the current experiment. The RT A, the CT and the RT S systems produced the highest number of grains/m2 while the RT S, the RT A and the RT A had the lowest in 2009, 2010 and 2011 respectively.
Grain yield response to tillage system and fertilizer N
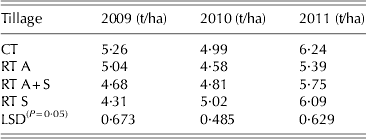
Spring barley grain yield was significantly influenced by the main effects of year (P<0·01), tillage (P<0·001) and N rate (P<0·001). There was a year × tillage interaction for grain yield (P<0·001). In 2009, the CT and the RT A treatments had significantly (P<0·05) higher yields than RT S. Tillage system had no significant effect on yield in 2010, while in 2011, when the highest yields were achieved, the CT and RT S treatments produced significantly (P<0·05) higher yields than the RT A (Table 3).
The effect of tillage systems on the mean grain yield for the three years 2009–2011
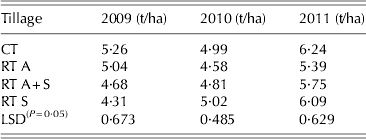
LSD, least significant difference (Tukey's adjusted P<0·05).
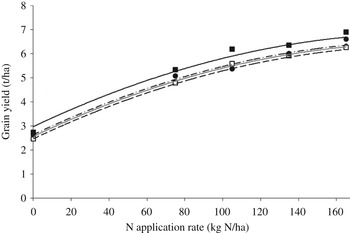
Examination of the parameter estimates of the quadratic response curves, demonstrating the effect of N application rates on grain yield for the four tillage treatments, indicated that there was no significant effect of tillage on yield response to increasing rates of N (Table 4). The grain yield difference between CT and the RT treatments remained consistent from 0 to 165 kg N/ha (Fig. 2), as demonstrated by the identical linear and quadratic components of the response curves. The cultivation timing of RT had no significant effect on grain yield response to N.
The effect of a tillage × N rate (kg N/ha) interaction on grain yield response (t/ha) from years 2009–2011. Lines represent regression analysis of tillage systems: CT (—), RT A (— —), RT S (– - –), RT A+S (- - - -). Symbols represent means of tillage and straw treatments : CT (■), RT A (□), RT S (●), RT A+S (○).

Parameter estimates for quadratic polynomial regression models relating to the grain yield response to nitrogen (N) for spring barley for the three years 2009–2011. N rate × tillage interaction

Values in parentheses are s.e.
Nitrogen use efficiency
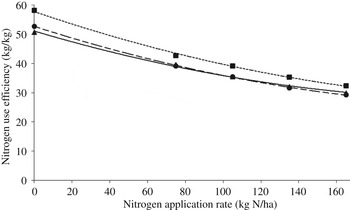
Nitrogen use efficiency was significantly affected by the main effects of N rate (P<0·001), year (P<0·001) and tillage system (P<0·001). Irrespective of the year and tillage system, NUE was highest at 0 kg N/ha and decreased as N application rates increased (Figs 3 and 4). However, the NUE response to N was influenced by the year and tillage system as demonstrated by significant interactions between the N rate and year (P<0·01) and between the N rate and tillage system (P<0·01). The parameter estimates of the quadratic response curves relating N rate to NUE for the three years indicate that there was no significant difference between the NUE in 2009 and 2010, which were both consistently lower than the NUE in 2011 at all N rates (Table 5 and Fig. 3).
The effect of a year × nitrogen application rate interaction on nitrogen use efficiency. Solid line (—), broken line (– –) and dotted line (- - - -) represents regression analysis in 2009, 2010 and 2011, respectively. Symbols represent means of years: 2009 (▲), 2010 (●), 2011 (■).

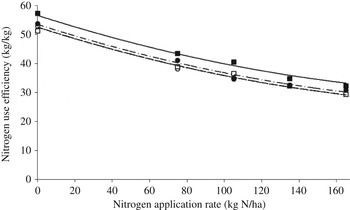
The effect of a tillage × nitrogen application rate interaction on nitrogen use efficiency. Lines represent regression analysis of tillage systems: CT (—), RT A (— —), RT S (– - –), RT A+S (- - - -). Symbols represent means of tillage treatments: CT (■), RT A (□), RT S (●), RT A+S (○).

Parameter estimates for quadratic polynomial regression models relating to the nitrogen use efficiency of spring barley for the three years 2009–2011. Year × nitrogen rate interaction

Values in parentheses are s.e.
The effect of tillage system on the NUE response to N over the three years is presented in Table 6 and Fig. 4. Conventional tillage had significantly (P<0·05) higher NUE than all three RT systems over the range of fertilizer N rates examined. The three RT systems had similar NUE over the range of N rates used. Tillage system did not significantly affect the rate of decline in NUE in response to increasing amounts of applied fertilizer N.
Parameter estimates for quadratic polynomial regression models relating to the nitrogen use efficiency of spring barley for the three years 2009–2011. Nitrogen rate × tillage interaction

Values in parentheses are s.e.
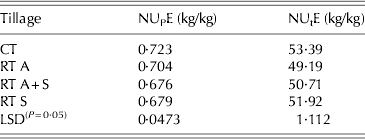
Nitrogen uptake efficiency and NUtE were significantly influenced by main effects of the tillage system (NUpE :[P<0·05]; NUtE: [P<0·001]), N rate (NUpE :[P<0·001]; NUtE: [P<0·001]) and year (NUpE :[P<0·01]; NUtE: [P<0·001]). The effects of tillage system on NUpE and NUtE are presented in Table 7. Over the three years CT had a significantly higher NUpE than RT A+S and a significantly higher NUtE than all three RT systems (both P<0·05). The RT A+S treatment produced a significantly (P<0·05) lower NUtE than RT A.
The effect of tillage systems on nitrogen uptake and utilization efficiency for the three years 2009–2011
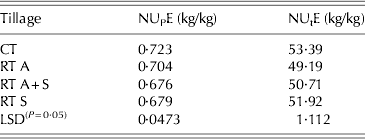
LSD, least significant difference (Tukey's adjusted P<0·05).
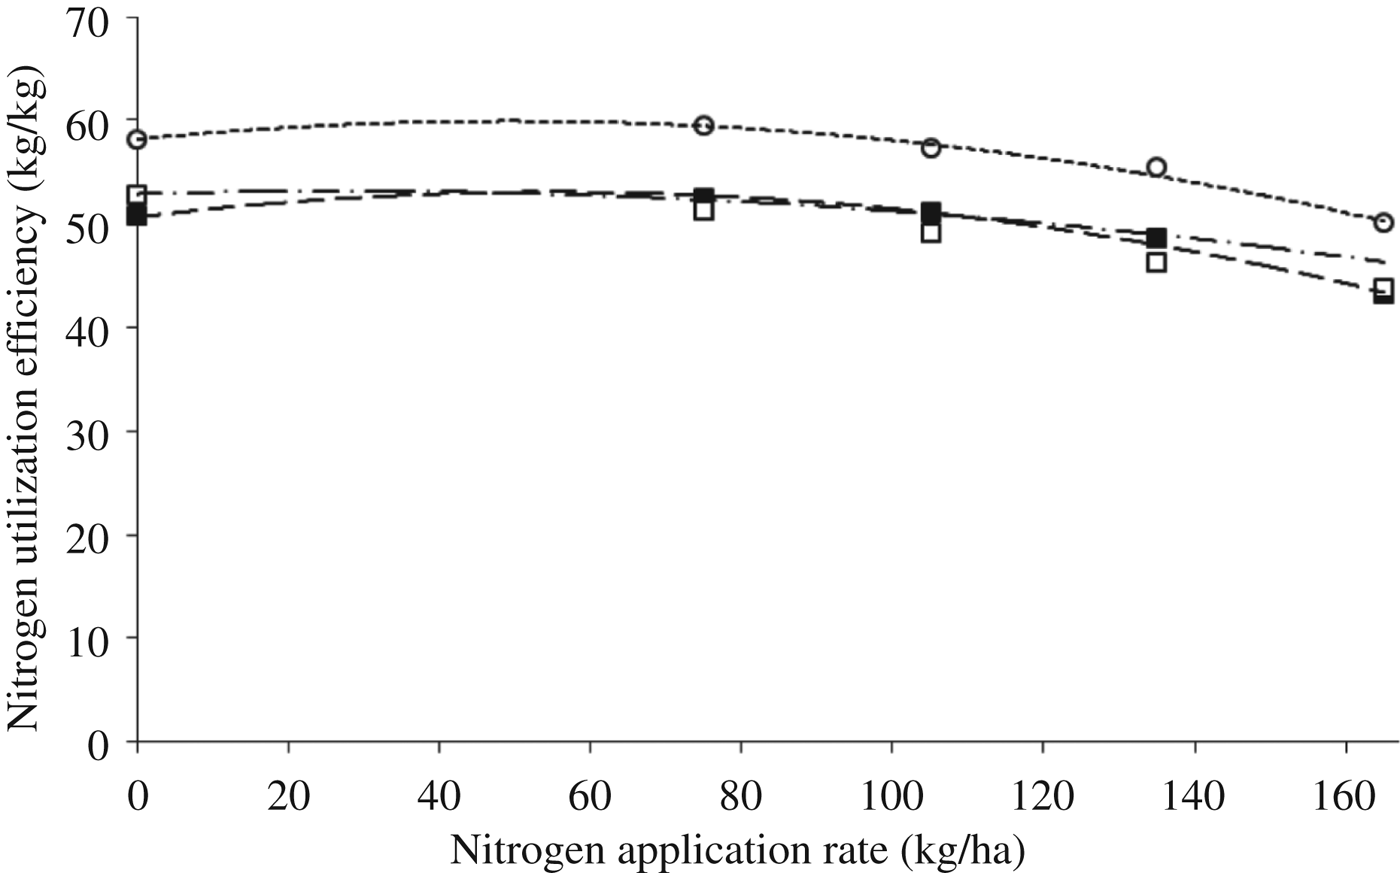
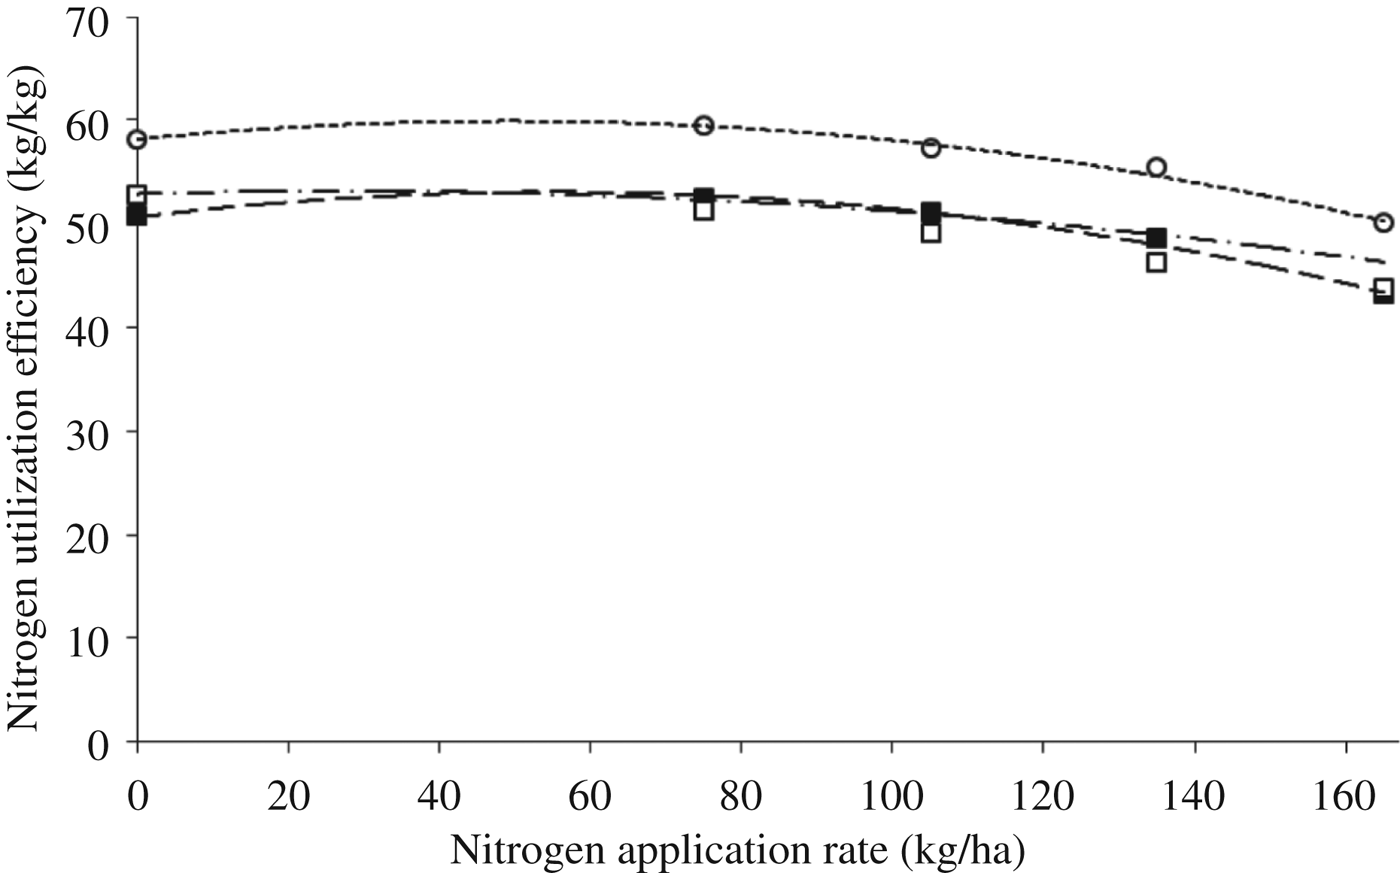
The NUpE declined as N application rates increased but there was no effect of year or tillage on the rate of decline. The effect of N application rate on NUtE was influenced by year as demonstrated by significant interactions between N rate and year (P<0·05). Examination of the parameter estimates of the quadratic response curves, demonstrating the effects of N application rate on NUtE for the three years indicate that there was no significant difference between the NUtE in 2009 and 2010, which were both lower than the NUtE in 2011 at all N rates (Table 8 and Fig. 5).
The effect of a season × nitrogen application rate interaction on nitrogen utilization efficiency. Lines represent regression analysis of seasons: 2009 (— —), 2010 (– - –), 2011 (- - - -). Symbols represent means of tillage and straw treatments: 2009 (□), 2010 (■), 2011 (○).
Parameter estimates for quadratic polynomial regression models relating to the nitrogen (N) utilization efficiency of spring barley for the three years 2009–2011. N rate × year interaction

Values in parentheses are s.e.
Nitrogen accumulation during the growing season
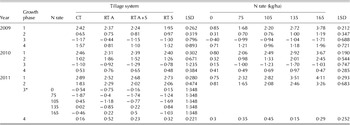
Mean daily N uptake rates for each of the four growth phases are presented in Table 9. Crop N uptake patterns were similar in all years, with large N uptake rates during phase 1, lower rates during phase 2, N loss during phase 3 and N uptake again during phase 4. The largest daily N uptakes of the experiment were achieved during growth phase 1 in 2011, while the greatest daily N losses occurred during phase 3 in 2009.
The effect of tillage and nitrogen (N) rate on daily N accumulation (kg N ha/day) during each crop growth phase in the three years 2009–2011

LSD, least significant difference (Tukey's adjusted P<0·05).
* A tillage system×N rate interaction was detected for daily N accumulation during period 3 in 2011.
Daily N uptake rates were significantly (P<0·05) influenced by N application rate in each growth phase, by tillage each year and by an interaction between the N rate and tillage system in growth phase 3 in 2011.
Increased N rates promoted N uptake in the first two growth phases each year, resulted in higher rates of N loss in phase 3 and had an inconsistent effect during phase 4. While the highest N rate produced the highest rate of N uptake during growth phase 4 in 2009, N rate had no significant effect on the rate of N uptake during the same phase in 2010 and 2011.
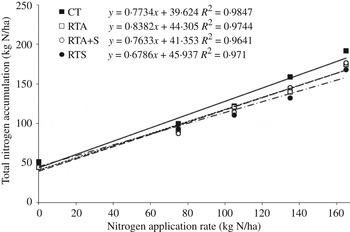
Tillage system had a significant (P<0·05) effect on the daily N uptake in seven of the 12 growth phases. In all years, while the difference was not always significant, the CT system had the highest daily N uptakes during phase 1 and the lowest during phase 2. Also, while the effect of RT system varied between years, the RT system with the lowest daily rate of N uptake during phase 1 consistently had the highest rate of uptake during phase 2. Conventional tillage had a significantly (P<0·05) higher rate of daily N loss than the RT systems during growth phase 3 in 2009; however, the effect of tillage on the rate of N accumulation during growth phase 3 in 2011 was influenced by an interaction with the N rate. While the tillage system had no significant effect on N uptake during growth phase 4 in 2009 and 2010, the RT A treatment accumulated significantly (P<0·05) more N than the CT or RT A+S systems during the same phase in 2011. Total N uptake at harvest is presented in Fig. 6. While there was no difference between tillage systems at lower N rates, the CT system had a higher total N uptake than the other systems as the N rate increased.
The effect of a tillage and nitrogen (N) application rate on total crop N accumulation at harvest. Trendlines represent tillage systems: CT (—), RT A (— —), RT S (– - –) and RT A+S (- - - -). Symbols represent means of tillage treatments: CT (■), RT A (□), RT S (●), RT A+S (○).

DISCUSSION
The higher plant populations with CT compared to the RT systems throughout the experiment concur with similar results on adjacent trial sites (Fortune et al. Reference Fortune, Kennedy, Mitchell, Dunne, Murphy, Connery and Grace2005), implying that CT produces more suitable conditions for spring barley establishment in this region. The low plant populations produced by the RT A system in all three years of the current experiment was most likely due to the autumn-cultivated soil becoming consolidated over the winter, resulting in inadequate soil tilth at seeding in spring and possibly cooler and wetter soil at seeding depth. A study conducted by Børresen (Reference Børresen1999) also reported lower spring cereal plant populations when conservation tillage systems provided poor seed coverage.
The poor relationship between plant populations and ear numbers is consistent with the findings of Wade et al. (Reference Wade, Spink and Orson2006), who noted that low plant population crops, irrespective of establishment method, tend to compensate by producing an increased number of plant shoots. This was particularly evident in the current experiment in 2009, where the RT A system produced the highest ear population from the smallest plant population. Low-density spring barley crops have been shown to produce up to 10 ears/plant and generate the optimum grain yield with plant populations as low as 81 plants/m2 (Wade & Froment Reference Wade and Froment2003). The importance of ear population for achieving optimum grain yield was outlined by Braim et al. (Reference Braim, Chaney and Hodgson1992).
The effects of tillage on ears and grains/m2 is consistent with the findings of Chia (Reference Chia1982) who noted that while the tillage system affected spring barley ear population, it had no significant influence on grains/ear.
The influence of year on mean grain yield was a consequence of the large variations in rainfall and temperature during the experiment. While yields were similar in 2009 and 2010, cool summer temperatures prolonged the grain filling period in 2011, resulting in greater yields. In comparable climates, Børresen (Reference Børresen1999) and Riley (Reference Riley1998) found similar weather effects on spring barley yields.
The effect of tillage system on the mean grain yield also varied between years, similar to the findings of Riley (Reference Riley2006). Conventional tillage produced a significantly higher mean grain yield overall and never produced significantly lower yields than any of the RT systems in any year, indicating the suitability of this system for the soils and climate encountered in the current experiment. This is consistent with the findings of Francis & Knight (Reference Francis and Knight1993) and Riley et al. (Reference Riley, Bleken, Abrahamsen, Bergjord and Bakken2005) who also reported a yield penalty when conservation tillage systems were used to establish spring barley. The low grain yields produced by the RT S treatment in 2009 may have been due to large annual meadowgrass (Poa annua) populations caused by poor grass weed control as previously demonstrated by Fortune et al. (Reference Fortune, Kennedy, Mitchell, Dunne, Murphy, Connery and Grace2005). While the cause of the low grain yields from the RT A in 2011 is uncertain, Francis & Knight (Reference Francis and Knight1993) suggested that grain yields may be lower in the absence of spring tillage due to reduced levels of N mineralization. However, the grain yield results in 2009 in the present study do not support this theory. Despite never producing the highest grain yield of the RT systems, RT A+S produced the most consistent yield of the RT systems.
The diminishing response effect of applied N rates on grain yield is consistent with the findings of Malhi & Lemke (Reference Malhi and Lemke2007). While the tillage system did not affect the rate of grain yield response to N, the higher yields produced by CT suggest that at N rates below 100 kg/ha the RT system requires an additional 15–20 kg N/ha more than the CT system to achieve the same yields. However, at any given rate of applied N, the CT system would produce higher yields than any RT system. Similarly, Francis & Knight (Reference Francis and Knight1993) reported that spring barley established by non-inversion tillage requires an additional 10–20 kg N/ha to obtain yields similar to conventionally established crops. However, Hansen et al. (Reference Hansen, Munkolm and Olesen2011) suggested that applying more N would further reduce the NUE of lower yielding RT systems. The timing or number of passes of RT had little effect on N response at this location.
Nitrogen use efficiency varied widely across all treatments and years from 29·2 to 57·8 kg grain/kg N. Previous research estimated that the mean NUE of spring barley in the UK is 27 kg grain/kg N at an N application rate of 101 kg/ha (Sylvester-Bradley & Kindred Reference Sylvester-Bradley and Kindred2009). Over the three years of the present study, NUE at 101 kg N/ha was considerably higher, ranging from 35·7 to 39·8 kg grain/kg N. Similarly to other studies (Semenov et al. Reference Semenov, Jamieson and Martre2007; Limon-Ortega et al. Reference Limon-Ortega, Govaerts and Sayre2008), NUE was highest at 0 kg N/ha and decreased at a diminishing rate as the N rate increased, irrespective of tillage treatment. The inter-annual variation in spring barley NUE as evidenced by the N rate by year interaction is consistent with the findings of Muurinen et al. (Reference Muurinen, Kleemola and Peltonen-Sainio2007). Nitrogen use efficiency followed yield trends with the highest results occurring in 2011 when weather favoured grain fill and produced greater yields. Similar relationships were reported by Lopez-Bellido & Lopez-Bellido (Reference Lopez-Bellido and Lopez-Bellido2001) who found that high yielding seasons also had the highest NUE.
The effect of tillage system on NUE was similar to that on yield, with conventional tillage having higher NUE values at all N rates, consistent with the findings of Lopez-Bellido & Lopez-Bellido (Reference Lopez-Bellido and Lopez-Bellido2001). Reduced tillage timing or number of passes had no effect on NUE. These results suggest that CT will have significantly higher spring barley NUE than the RT systems in this climate irrespective of the rate of N applied.
Similar to NUE, NUpE and NUtE were both highest in 2011 as a result of the favourable weather conditions and increased grain yields. The significant effect of tillage system on both NUpE and NUtE throughout the experiment indicates that it was the combined effects of tillage on N uptake and utilization that influenced NUE. However, the tillage system had a greater effect on NUtE than on NUpE, which suggests that the majority of the variation in NUE between the tillage systems in the current experiment was due to the increased ability of CT to transform N accumulated in the plant into grain yield. One possible explanation for lower NUtE rates with RT is outlined in studies by Masle & Passioura (Reference Masle and Passioura1987) and Young et al. (Reference Young, Montagu, Conroy and Bengough1997), who found that increased soil strength and root impedance can reduce the rate of leaf elongation in cereal plants, with a negative effect on plant metabolic processes as a consequence.
The larger daily N accumulation with the CT system during growth phase 1 in all years may have been due to larger plant populations. Francis & Knight (Reference Francis and Knight1993) reported that spring barley established with CT may have higher early spring N uptakes due to tillage-induced mineralization. However, in the current experiment the tillage system had no significant effect on N uptake at 0 kg N/ha during growth phase 1 (data not shown), which suggests that there was no significant difference in soil N supply. While not measured in the present study, the delayed root development associated with RT as outlined by Rasmussen (Reference Rasmussen1999) may have reduced N uptake. The tillage systems with the highest and lowest N uptakes during phase 1 in each year had the highest and lowest mean grain yields, respectively, suggesting that the capacity for N uptake during late tillering and stem extension may be a yield determining factor. In addition, the tillage system with the lowest N uptake in growth phase 1 had the highest N uptake in phase 2 each year and vice versa, indicating the presence of a limited supply of N to the crop between late tillering to anthesis. While higher N application rates increased N uptake during phases 1 and 2, they promoted N loss during growth phase 3 which is supported by the findings of Daigger et al. (Reference Daigger, Sander and Peterson1976), and Raun & Johnson (Reference Raun and Johnson1999) who outlined that cereal plants lose N in the form of NH3 during the grain filling period after anthesis. Daigger et al. (Reference Daigger, Sander and Peterson1976) found that between anthesis and maturity, wheat plants lost 41% of the anthesis N content when 133 kg N/ha was applied, and with 73% of the total N loss occurring through the shoots. Papakosta & Gagianas (Reference Papakosta and Gagianas1991) also reported a relationship between N application rate and N loss in wheat, suggesting that higher N translocation rates to the grain after anthesis increases the risk of plant N loss.
Similarly to the findings of Daigger et al. (Reference Daigger, Sander and Peterson1976), N content tended to stabilize in phase 4, with N uptakes greater than phase 2 in 2009 but lower than phase 2 in 2010 and 2011. Since plant N loss and N accumulation were not measured independently, it remains unknown whether N loss continued to maturity as suggested by Papakosta & Gagianas (Reference Papakosta and Gagianas1991). Probably due to the time elapsed since tillage and N application, the effects of these two factors on daily N accumulation during phase 4 of this experiment was small and inconsistent.
The CT system had a higher total N content than the RT systems due to increased rates of N accumulation throughout the growing season.
CONCLUSIONS
The more consistent results from season to season with better crop establishment leading to improved NUE and higher yields were achieved with CT, indicating that CT was the most suitable method of seedbed preparation for spring barley under the conditions encountered in the present study. Where RT systems were used there were indications that autumn cultivations alone were less successful than autumn and spring cultivations or spring cultivations alone. There was no evidence to suggest that fertilizer N requirements of spring barley are dependent on establishment system used but the efficiency with which N is used by the crop was consistently higher with CT as a result of the higher yields achieved.
The different tillage systems evaluated in the current experiment had a significant effect on spring barley performance from establishment to harvest. While successful crop establishment may have contributed to the higher grain yields of CT, the yields of the RT systems, particularly RT A and RT S, were inconsistent and generally unrelated to plant numbers at establishment. Although CT produced consistently higher yields at all N rates, the yield response to increasing rates of N was not influenced by tillage. In the present study, NUE followed grain yield trends, demonstrating the importance of high yields for improving NUE. Tillage system had a greater effect on NUtE compared to NUpE. Nitrogen accumulation pattern was also affected by tillage with the CT system taking up larger amounts of N than the RT systems earlier in the season but less as the season progressed.
The overall conclusion of the present study is that yield penalties may be incurred with the adoption of RT systems for spring barley establishment in a cool Atlantic climate. Where lower N rates are being used, this penalty may be partially offset by increased N application rates, but at a cost of further reductions in NUE and a reduced economic return to N use. While cultivation timing or number of passes had no effect on the overall grain yield or NUE, the RT A+S system proved to be the most consistent non-inversion system. This work stresses the importance with spring barley, of having an adequately established crop capable of taking up nutrients at an early growth stage, to ensure that the yield and NUE are optimized.
The authors thank the staff at the Oak Park Research Centre, particularly Kevin Murphy for technical assistance in the field.