Automatic enrollment in defined contribution retirement savings plans – where eligible individuals begin saving in the plan at a strictly positive default contribution rate with balances invested in a default asset allocation unless they opt out – has been growing rapidly in prevalence.Footnote 1 A comprehensive review of prior research (presented in Section 1) finds that relative to a regime where one must opt into saving, automatic enrollment increases plan participation rates by 26–91 percentage points at short time horizons (up to one year after employees are automatically enrolled). Employees frequently remain at the default contribution rate and asset allocation. At time horizons of up to five years, 22–72 percent of employees continue to contribute at the default contribution rate, and at time horizons of up to four years, 26–89 percent of plan participants continue to have their balances entirely invested in the default asset allocation.
This previous research examines modest default contribution rates in the range of 1–6 percent of income. What happens when the default is much higher?
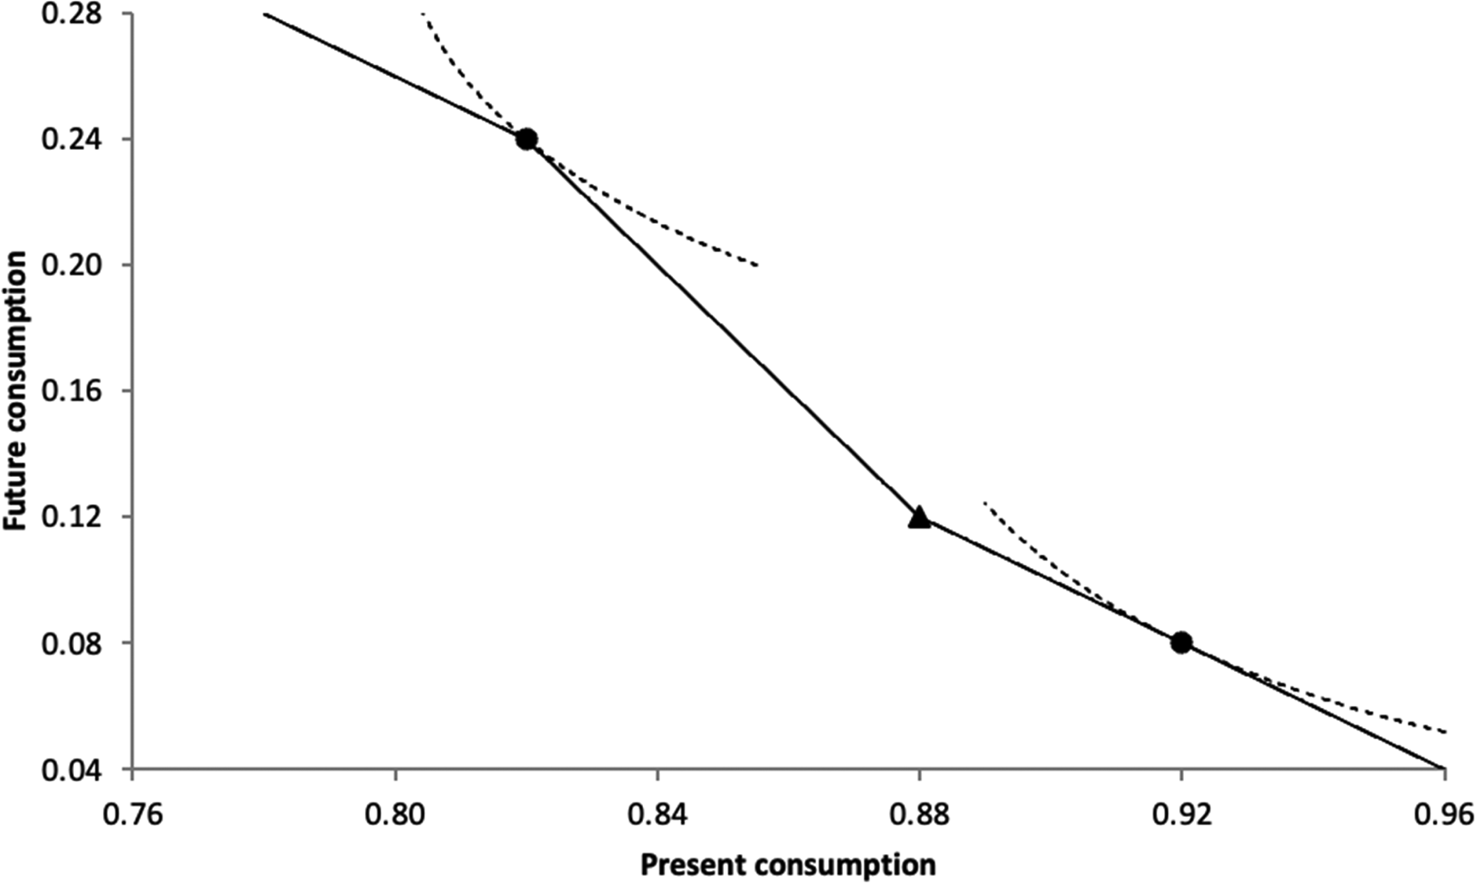
In this paper, we provide initial evidence on employee responses to a very high default contribution rate by analyzing the defined contribution retirement savings plan of a firm in the United Kingdom with a 12 percent default contribution rate. This default was not only considerably higher than previously studied defaults, but it was also likely to be a suboptimal contribution rate for employees. The firm did not make any matching contributions on the first 12 percent of pay contributed by the employee, but only matched the next 6 percent of pay contributed (at a 100% marginal match rate). In a stylized two-period model where the employee divides resources between present and future consumption, this match structure creates a non-convex employee budget set (see Figure 1 and its caption for details). A standard indifference curve cannot be tangent to the budget set at the point corresponding to a 12 percent contribution rate, where there is a non-convex kink. In addition, when it is possible to contribute in more than one year, a strategy that contributes 12 percent in both years t and t′, which earns no matching dollars, is likely inferior to strategies that earn matching dollars by contributing less than 12 percent in t and more than 12 percent in t′.Footnote 2
Two-period model of the employee's contribution rate decision. This figure illustrates the structure of employer matching contributions in the retirement savings plan that we study. In this stylized two-period model, income in the present period is one, and income in the future period is zero. Employee contributions and employer contributions are invested in an asset with a net rate of return of zero. There are no taxes. The solid lines depict the employee's budget set. In the bottom-right corner of the figure, the budget set begins at the point characterized by 0.96 in present consumption and 0.04 in future consumption because a 4% employee contribution rate is the minimum contribution rate allowed in the retirement savings plan that we study. From that point, the budget set travels up and to the left with a one-unit reduction in present consumption translating into a one-unit increase in future consumption until present consumption reaches 0.88, which is a contribution rate of 12%. Employee contributions between 12% and 18% earned employer matching contributions on a one-for-one basis, so the budget set then travels up and to the left with a one-unit reduction in present consumption translating into a two-unit increase in future consumption until present consumption reaches 0.82. At that point, employer matching contributions ceased, and the budget set resumes traveling up and to the left with a one-unit reduction in present consumption translating into a one-unit increase in future consumption. The dotted curves in the figure are two possible indifference curves, with their tangency points indicated by circles. The triangle marks the non-convex kink in the budget set at the contribution rate of 12%, which is also the default contribution rate. Note that no smooth indifference curve could be tangent to the budget set at this default.

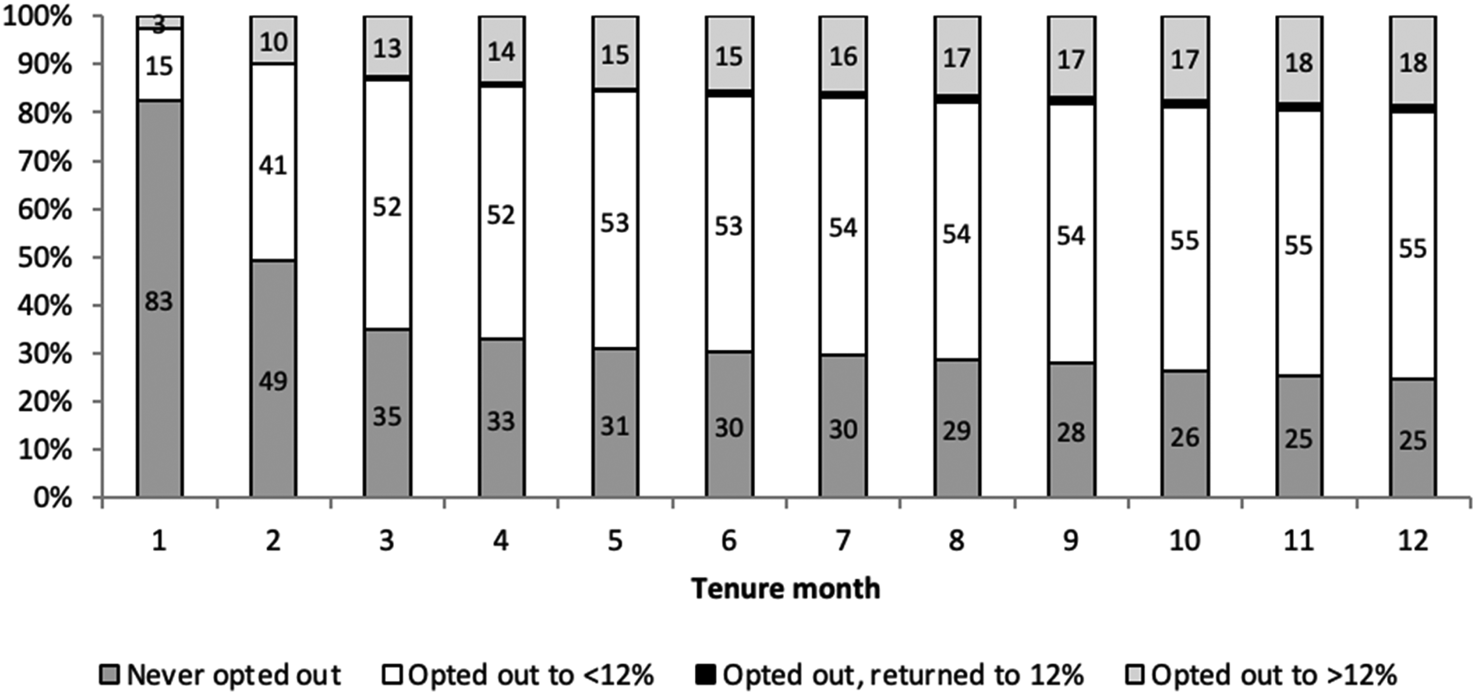
Using data on employees hired at a firm between July 2006 and June 2007, we analyze the extent to which employees opted out of this likely suboptimal default to either lower unmatched contribution rates or higher marginally matched contribution rates. By 12 months of tenure, only 25 percent of employees had not opted out of the 12 percent default contribution rate. This percentage is smaller than the comparable percentages reported in previous research, which studied plans with lower contribution defaults. Among the papers reviewed in Section 1 that reported the comparable percentage for a group of employees with tenure levels in a range that included 12 months, the percentages were 33 percent (5–16 months), 41 percent (7–12 months), 42 percent (12–35 months), 55 percent (12–17 months), 65 percent (3–15 months), and 71 percent (0–23 months). In all of these examples, the default contribution rate was 3 percent.
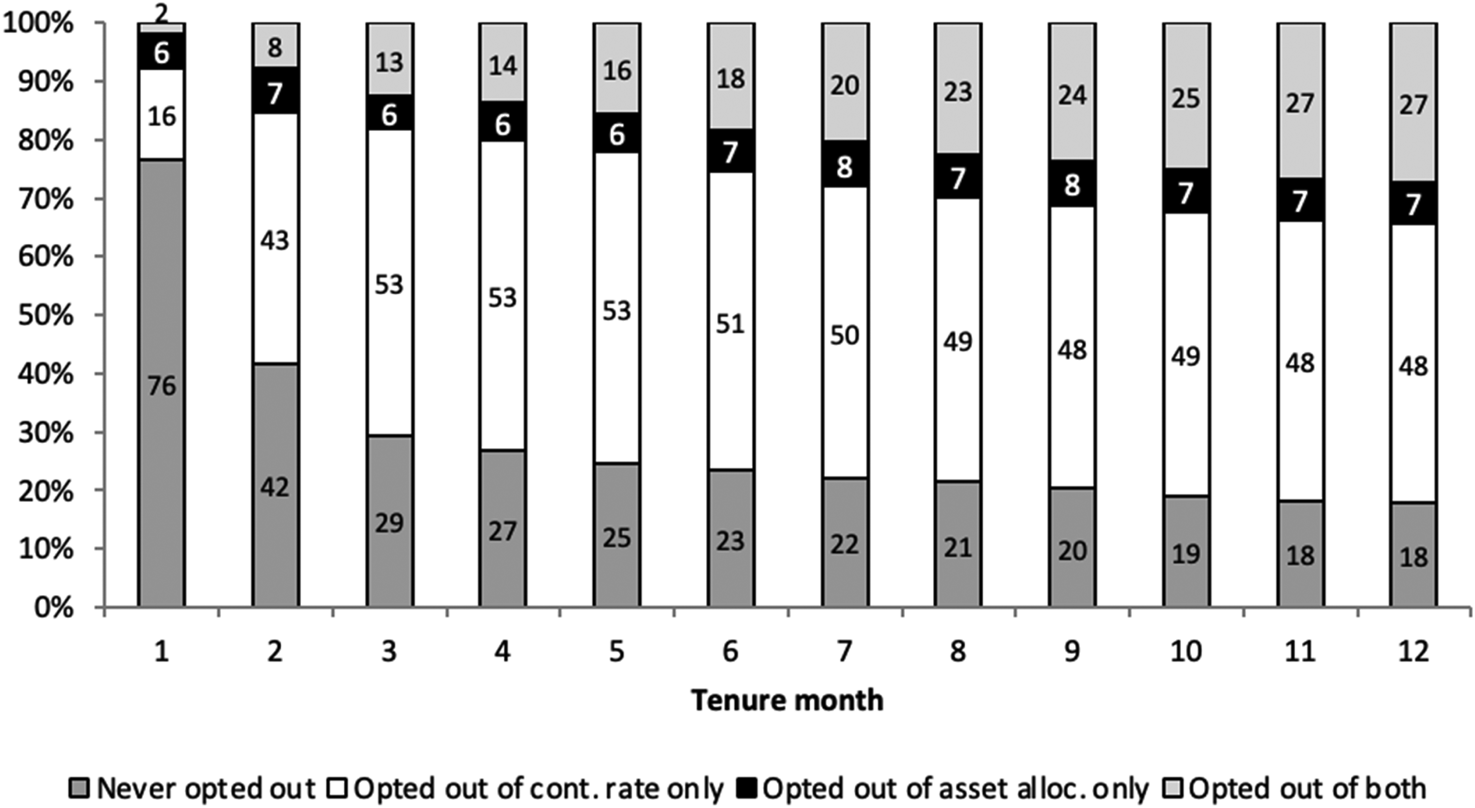
At the firm we study, opt-out behavior along the asset allocation dimension was strikingly different from opt-out behavior along the contribution rate dimension: 66 percent of employees remained at the default investment allocation for their first 12 months of tenure, even though 73 percent of those who remained at the default investment allocation had opted out of the default contribution rate. This pattern suggests that the high opt-out rate from the contribution default was not purely driven by characteristics of the employee population, such as a tendency to be intensely engaged in their financial affairs. The pattern is consistent with the hypothesis that employees had some sense of their optimal contribution rate but little expertise in the multi-dimensional asset allocation problem, making them more likely to rely on the default asset allocation for guidance. The evidence is also consistent with the complementary hypothesis that the default asset allocation was close to the optimum for many employees, creating little need to opt out.
The evidence on opt-out behavior suggests that contribution rate defaults can lose influence as they become higher. Still, at the firm we study, a meaningful fraction of employees were slow to opt out of the default. We explore which types of employees contributed at the 12 percent default rate at 12 months of tenure, and we find that female employees and employees with higher salaries were less likely to be at the default.
We then examine the relationship between contribution rate decisions and salary in more detail. Employees who contributed at the 12 percent default rate after 12 months of tenure had an average salary that was approximately one-third lower than the level predicted from a regression of salary on contribution rate among employees who chose non-default contribution rates. This result echoes previous work documenting that low-income individuals are slower to opt out of defaults than high-income individuals (e.g., Choi et al., Reference Choi, Laibson, Madrian, Metrick and Wise2004). Two explanations can potentially account for this pattern. First, low-income employees might be slower to opt out because the default is close to their ideal contribution rates, which are the options that they would select if they were forced to actively choose a contribution rate. Second, low-income employees might be slower to opt out because they face higher barriers to active decision making, such as a tendency to procrastinate or a lack of expertise in financial decision making. The first explanation invokes the natural idea that the likelihood of opting out increases as the distance between the ideal contribution rate and the default increases (Carroll et al., Reference Carroll, Choi, Laibson, Madrian and Metrick2009). Our analysis, however, suggests that the first explanation does not fully account for the lower opt-out frequency of low-income employees.Footnote 3, Footnote 4 We conclude that the second explanation – higher barriers to active decision making – at least partly accounts for the lower opt-out frequency of low-income employees.Footnote 5
It is important to note the key limitations of our analysis. We rely on data from a single company, so we must be cautious when extrapolating our results to other companies and contexts. Furthermore, we do not have data from a time period when the company's employees were not automatically enrolled in the retirement savings plan. Employees hired during such a time period could have served as a control group, and because we do not have this control group, we cannot draw sharp conclusions regarding the causal effects of automatic enrollment with a 12 percent default contribution rate relative to an opt-in retirement plan.Footnote 6 Nonetheless, our results provide practical insights for designing retirement savings plans. In particular, policy makers and managers should keep in mind that although employees may become less likely to remain at the automatic enrollment default contribution rate as it increases, low-income employees may face higher barriers to active decision making and thus be more likely than high-income employees to remain at the default.
In Section 1, we present a systematic review of the research literature on the causal effects of automatic enrollment in field settings. Section 2 provides background on the company we study and its savings plan design. Section 3 describes the data we use. Section 4 analyzes the frequency of opting out of the default, and Section 5 studies correlates of the likelihood of opting out. Section 6 concludes.
1. Previous research on automatic enrollment in defined contribution plans
We conducted a systematic search for previous research estimating the causal effect of automatic enrollment in defined contribution plans. We began with four early papers that studied this topic (Madrian and Shea, Reference Madrian and Shea2001; Choi et al., Reference Choi, Laibson, Madrian and Metrick2002, Reference Choi, Laibson, Madrian, Metrick and Wise2004; Beshears et al., Reference Beshears, Choi, Laibson, Madrian, Kay and Sinha2008). The reference lists of these four papers revealed no additional research on our key question. We used Elsevier's Scopus database to identify the 1,607 articles published as of December 2022 that cited at least one of those four papers. We narrowed this set of articles to those that included at least one word from each of the following two lists in their title, abstract, or keywords:
(1) Words related to retirement savings: retire, pension, defined contribution, DC, 401(k), and their linguistic derivatives.
(2) Words related to automatic enrollment: automatic enrollment, auto-enrollment, auto enrollment, auto-IRA, auto IRA, default, opt-out, opt out, nudge, and their linguistic derivatives.
We manually examined the 606 articles identified by this process and found 15 that studied the effects of automatic enrollment or other default features in retirement savings plans.Footnote 7 We combined these 15 articles with the four that were the starting point for the search. From these 19 articles, we collected estimates of the effects of automatic enrollment or other default features on plan participation, contribution rates, and asset allocations. When an article reported results at multiple time horizons, we focused on the shortest horizon, the longest horizon, and the horizon closest to one year.
Table 1 summarizes the relevant empirical results from the 13 articles that studied automatic enrollment in a field setting. Table 2 summarizes the results from the six articles that studied other default features or studied automatic enrollment in a laboratory setting.
Previous research on automatic enrollment in defined contribution plans

* Results for the third company studied by Choi et al. (Reference Choi, Laibson, Madrian, Metrick and Wise2004) are summarized by Choi et al. (Reference Choi, Laibson, Madrian and Metrick2002) and appear in the Choi et al. (Reference Choi, Laibson, Madrian and Metrick2002) entry in this table.
Previous research on other default features and automatic enrollment in the laboratory

The evidence on the effects of automatic enrollment comes from employers of all sizes, ranging from the US Army, which automatically enrolled tens of thousands of new civilian employees per year (Beshears et al., Reference Beshears, Choi, Laibson, Madrian and Skimmyhorn2022), to the small firms (2–29 employees) analyzed by Cribb and Emmerson (Reference Cribb and Emmerson2021). The employers represent a variety of industries, including manufacturing, food products, health care, and telecommunications. The employers are also in several countries: the United States, the United Kingdom, and Afghanistan.
Across this wide spectrum of employers, automatic enrollment consistently leads to large increases in the fraction of employees who participate in the retirement plan. The smallest reported effect size over a horizon of one year or less is 26 percentage points (Beshears et al., Reference Beshears, Choi, Laibson, Madrian, Kay and Sinha2008), and the largest is 91 percentage points (Clark and Pelletier, Reference Clark and Pelletier2022). The effect size becomes smaller but is still substantial – in the range of 12 percentage points (Falk and Karamcheva, Reference Falk and Karamcheva2023) to 36 percentage points (Choi et al., Reference Choi, Laibson, Madrian and Metrick2002) – at horizons of two to five years.
The large participation effects are primarily driven by employees' tendency to passively accept default contribution rates, which are as low as 1 percent and as high as 6 percent of pay in the articles included in Table 1. At horizons of less than one year, the fraction of employees who continue contributing at the default rate under automatic enrollment ranges from 36 percent (Blumenstock et al., Reference Blumenstock, Callen and Ghani2018) to 72 percent (Choi et al., Reference Choi, Laibson, Madrian, Metrick and Wise2004). At horizons of two to five years, the fraction ranges from 22 percent (Falk and Karamcheva, Reference Falk and Karamcheva2023) to 64 percent (Choi et al., Reference Choi, Laibson, Madrian and Metrick2002). In addition to increasing the contribution rates of some employees who would have contributed zero under opt-in enrollment, automatic enrollment sometimes decreases the contribution rates of some employees who would have contributed at a rate higher than the automatic enrollment default.
Automatic enrollment tends to have modest effects on mean contribution rates beyond a horizon of one year. Madrian and Shea (Reference Madrian and Shea2001) estimate that at 3–15 months of tenure, automatic enrollment at a 3 percent default increased the average contribution rate by 1.1 percent of income, and Blumenstock et al. (Reference Blumenstock, Callen and Ghani2018) find that automatic enrollment at a 5 percent default increased the average contribution rate by 1.8 percent of income two months after implementation. But Choi et al. (Reference Choi, Laibson, Madrian, Metrick and Wise2004) find that automatic enrollment at a 2 percent default contribution rate increased the average contribution rate by only 0.4 percent of income at 47 months of tenure, and automatic enrollment at the company studied by Madrian and Shea (Reference Madrian and Shea2001) increased the average contribution rate by only 0.5 percent of income at 26 months of tenure. Similarly, Falk and Karamcheva (Reference Falk and Karamcheva2023) record a mere 0.6 percent increase at 5–16 months of tenure, and a 0.3 percent increase at 41–52 months of tenure. At a horizon of 49–53 months, automatic enrollment at a 3 percent default contribution rate increased mean cumulative employee contributions by only 1.6 percent of pay among civilian employees of the US Army (Beshears et al., Reference Beshears, Choi, Laibson, Madrian and Skimmyhorn2022).
Table 1 also shows that employees often passively accept asset allocation defaults. At horizons of up to four years, the fraction of plan participants who remain at the automatic enrollment investment default ranges from 26 percent (Beshears et al., Reference Beshears, Choi, Laibson, Madrian, Kay and Sinha2008) to 89 percent (Choi et al., Reference Choi, Laibson, Madrian, Metrick and Wise2004).Footnote 8 The articles in Table 1 that report these results all study a money market or stable value fund default investment option. Typical financial advice, as reflected in the design of target date retirement funds that are intended to be investment vehicles for retirement savings, recommends that retirement savings should be invested with substantial equity exposure (Choi, Reference Choi2022). Money market and stable value funds hold no equities, so it is striking that employees nonetheless frequently passively accepted such funds when they were the default.
The articles summarized in Table 2 corroborate the overarching message from Table 1: defaults influence retirement savings outcomes. Camilleri et al. (Reference Camilleri, Cam and Hoffman2019) find that approximately half of the participants in their online experiment accept the default investment option in a simulated lifecycle portfolio choice problem. Foltice et al. (Reference Foltice, Arling, Kirby and Saajasto2018) demonstrate in a laboratory experiment that changing the default contribution rate from 3 percent to 15 percent increases participants' mean chosen contribution rate from 7.3 percent to 9.2 percent. We chose not to include these two articles in Table 1 because they involve subjects making hypothetical decisions and might therefore be less predictive of workers' behavior in defined contribution plans than field data.
Rubaltelli and Lotto (Reference Rubaltelli and Lotto2021) introduced a new web interface for Italian freelance psychologists choosing retirement savings plan contributions. Relative to a version that featured a pre-selected contribution rate of 10 percent (the mandatory minimum), a web interface that had a pre-selected contribution rate of 20 percent increased the mean chosen contribution rate from 10.2 percent to 11.7 percent. Even though this study changed the default contribution rate in a field setting, we did not include it in Table 1 because the freelancers in the study had taken the active step of visiting the web interface, an experience that is different from that of an employee under automatic enrollment, which requires no action by the employee.
The other three articles summarized in Table 2 examine automatic contribution escalation programs. Employees who are enrolled in such a program experience automatic increases in their contribution rates at prespecified times (e.g., on an annual basis) unless they opt out. Employees frequently accept their scheduled contribution rate increases (Thaler and Benartzi, Reference Thaler and Benartzi2004; Mahasuweerachai and Mahariwirasami, Reference Mahasuweerachai and Mahariwirasami2019). Furthermore, when employees are automatically enrolled in an automatic escalation program, only 16 percent opt out (Benartzi et al., Reference Benartzi, Peleg, Thaler and Shafir2013).
In summary, our literature review finds consistent evidence that individuals often accept retirement savings plan defaults. However, the estimated effects of automatic enrollment on mean contributions are modest. Automatic escalation programs lead to contribution rate increases, but these increases are implemented only slowly over time. A natural question is whether automatically enrolling employees upon hire at a contribution rate well above 6 percent would generate large, immediate contribution rate increases. On the one hand, employees might passively accept a high default contribution rate like they accept low defaults. On the other, employees might opt out of a high default because it is outside the range of contribution rates that they find acceptable. Our analysis of a retirement plan with a 12 percent default contribution rate provides initial evidence on this open question.
2. Company background and plan design
We study a global company that had its headquarters in the United Kingdom using data from July 2006 through June 2008. At this time, the UK pension system consisted of three tiers. The first tier, the Basic State Pension, was a mandatory government scheme to which individuals contributed while working in return for an annuity stream in retirement.Footnote 9 The second tier, the State Second Pension, was also a government scheme, but it was less progressive in the provision of benefits, as payouts in retirement were more closely linked to lifetime earnings.Footnote 10 The third tier was the system of private retirement savings plans. Contributions to these plans were tax-deductible for individuals up to a limitFootnote 11 and were generally tax-deductible for employers.Footnote 12 In 2006, slightly more than half of UK workers were enrolled in a private defined benefit or defined contribution retirement savings plan, and of these workers, approximately one-third had a defined contribution plan.Footnote 13
The company had more than 50,000 employees engaged in a range of job functions, including manufacturing, marketing, research and development, and administration. It maintained legacy defined benefit plans for some of its employees, but all UK employees hired during 2006–2008 were eligible only for a defined contribution plan. We restrict our analysis to the company's primary defined contribution plan for UK employees. Less than one percent of UK employees hired during this period were not eligible for the primary plan but were instead eligible for a plan with a different structure. These employees generally had low salaries, and we exclude them from our analysis because they faced distinct plan rules and are too few in number to be examined separately.
New UK employees of the firm we study (besides the small ineligible group described above) were automatically enrolled upon hire in the primary defined contribution plan at a 12 percent default contribution rate. Employees could opt out of the plan entirely, but in order to remain active plan participants, they ordinarily had to contribute at least 4 percent of every paycheck to the plan.Footnote 14 Subject to the 4 percent floor and some restrictions described below, employees could elect any contribution rate at any time.Footnote 15 The firm did not match the first 12 percent of income contributed by employees, but the next 6 percent of income contributed was matched at a 100 percent marginal rate, so that employees could receive a maximum of 6 percent of their income in matches. Matching contributions vested immediately. In order to receive the match, an employee was required to elect a contribution rate greater than 12 percent within their first three months of hire or within the three-week open enrollment period in late May and early June, and the employee was required to maintain this contribution rate until the next open enrollment period. Employees who chose contribution rates greater than 12 percent outside of the designated windows did not receive matching contributions.Footnote 16 All contributions to the plan were made on a before-tax basis, and loans from the plan were not permitted.
Plan balances were allocated according to the employee's wishes across 11 investment funds: one cash fund, two bond funds, and eight equity funds. During 2006–2008, the plan's investment menu did not include target date retirement funds (which slowly shift from equities to fixed-income investments over time) or employer stock. Employees who did not elect otherwise had their contributions invested in the default asset allocation, which was a mix of bonds and equities.
3. Data on plan outcomes
We have monthly administrative retirement plan records from three data extracts. The first extract covers March 2006 through October 2007; the second extract covers November 2007 through March 2008; and the third extract covers April 2008 through June 2008. Each extract includes all employees who were active participants in the plan as of the end of the extract period (October 31, 2007; March 31, 2008; or June 30, 2008). We restrict our attention to the 671 employees who began their tenure at the firm between July 1, 2006, and July 1, 2007,Footnote 17 and who have data records for their first twelve full months of employment.Footnote 18 Our analysis excludes employees who left the firm or plan before the end of their twelfth tenure month, as well as employees who left the firm or plan after the end of their twelfth tenure month but before the end of the extract period that would have included their twelfth tenure month. We do not have data to construct a control group of employees who were not automatically enrolled in the retirement plan. This data limitation makes it difficult to draw strong conclusions regarding the causal effect of automatic enrollment at a 12 percent default contribution rate relative to a system under which employees must actively opt in to contribute to the retirement plan. Nonetheless, savings outcomes under an automatic enrollment policy with a 12 percent default contribution rate are interesting in their own right, and results from previous research examining automatic enrollment at lower default contribution rates serve as a useful reference point.
The data set includes the gender, marital status, age, and hire date of each employee. In addition, for each month, we observe employee compensation, the value of employee contributions to the plan, and the value of employer contributions to the plan. To calculate employee and employer contribution rates, we divide contributions by compensation. However, we make some adjustments to these calculations because administrative processes in the retirement savings plan often lagged those in the employee payroll system. For instance, when an employee received a pay raise, the compensation record reflected the pay increase immediately, but the plan contribution amount sometimes stayed at the contribution rate multiplied by the previous compensation level, generating a misleadingly low ratio of contributions to compensation. In this example, the subsequent month's contribution amounts often adjusted upward to reflect the new compensation level and to make up for the missed contributions in the previous month, generating a misleadingly high ratio of contributions to compensation. More complicated scenarios arose when an employee experienced multiple salary changes within a short timeframe. A similar issue affected plan contributions at the beginning of an employee's tenure: contributions in the first or second full tenure month sometimes represented contributions for that month and for previous month(s). In all of these cases, we reattribute contributions to the appropriate months before calculating contribution rates.
Another factor that affects the calculation of contribution rates is employee contributions out of bonus pay. Bonuses do not appear in our compensation data, but the plan contributions that we observe represent the sum of contributions out of regular pay and contributions out of bonuses. The contributions out of bonuses sometimes generate misleadingly large calculated contribution rates. Our analysis attempts to ignore contributions out of bonus compensation by adopting the following procedure. Because bonuses were often awarded in April, when we calculate an April employee contribution rate that exceeds the March contribution rate and the May contribution rate by more than six percentage points, we set the April contribution rate equal to the March contribution rate.
After making the above adjustments, some non-integer contribution rates still remain. We round these to the nearest integer.
Our data do not include a variable indicating which employees were participants in the firm's primary defined contribution plan. However, the difference in structure between the primary plan and the other plan (for which almost no employees were eligible) allows us to identify employees who were likely to be members of the other plan. The primary plan provided matching contributions only when the employee contribution rate exceeded 12 percent, whereas the other plan provided a match when the employee contribution rate exceeded 4 percent. An employee who received a marginal match on contributions above 4 percent of pay would therefore be identified as a participant in the other plan, although no such employees exist in our sample. To be conservative, our analysis sample excludes employees who are never observed with a contribution rate greater than 4 percent of pay (the default contribution rate in the other plan), even though some of these individuals might have been participants in the primary plan. This restriction eliminates five employees from the sample (0.7% of the sample), a fraction that is in line with the fact that less than one percent of employees were eligible for the other plan instead of the primary plan.
Finally, our data include information on employee asset allocations. On a monthly basis, we observe the value of shares bought or sold in each mutual fund in the investment menu, as well as variables indicating whether an employee had ever opted out of the default asset allocation for new contribution flows and whether an employee had ever reallocated existing balances across funds.Footnote 19
Table 3 presents summary statistics for our sample. More than half of the employees were female, and slightly less than half were married. The mean age was 35 years. At £28,700, the median annual salary was higher than the median for full-time UK workers at the time, but there was considerable variation in pay across the firm's employees. The mean employee contribution rate at 12 months of tenure was 9.4 percent of pay, and the mean employer contribution rate was only 0.9 percent of pay, reflecting the fact that the firm did not match employee contributions (on the margin) unless the employee contribution exceeded 12 percent of pay (with marginal matching capping out above 18% of pay contributed).
Sample characteristics

This table presents summary statistics for the 671 employees who are observed in the data for at least 12 months. The variables are measured as of tenure month 12 for each employee. For the employee contribution rate, contributions out of bonuses are disregarded.
4. Opt-out rates
In this section, we analyze the rate at which employees opted out of the savings plan defaults. We are particularly interested in opt-out behavior vis-à-vis the 12 percent default contribution rate, since this can give us insight into employee reactions to higher contribution rate defaults. Furthermore, the budget set non-convexity created by this plan's match structure makes the 12 percent default contribution rate unlikely to be an optimal choice for employees,Footnote 20 so opt-out behavior in this setting sheds light on how employees respond when the default option is likely contrary to their best interests.
Figure 2 shows employee contribution rates at the firm by tenure. The darker gray bar represents the fraction of employees in our sample who had never opted out of the 12 percent default contribution rate up to that point; the white bar represents the fraction at a contribution rate below 12 percent; the small black bar represents the fraction who had originally opted out of the default but are now again at the 12 percent contribution rate; and the lighter gray bar represents the fraction who are at a contribution rate above 12 percent. In these calculations, we disregard contributions out of bonus pay because they are infrequent occurrences that involve a separate decision-making process. The figure indicates that employees opted out of the default rapidly. By tenure month 3, only 35 percent of the employees had never opted out of the default, and this fraction steadily declined to 25 percent by tenure month 12. As a point of contrast, recall from the Introduction of this paper that previous research, which examined automatic enrollment with lower default contribution rates, found that 33–71 percent of employees remained at the default contribution rate at roughly comparable time horizons.Footnote 21
Opt-out from the 12% default contribution rate by tenure. For each level of tenure, this figure displays the fraction of employees who had never opted out of the 12% default contribution rate, opted out to a lower contribution rate, opted out of and subsequently returned to the 12% default contribution rate, and opted out to a higher contribution rate. The sample is the 671 employees who are observed in the data for at least 12 months.

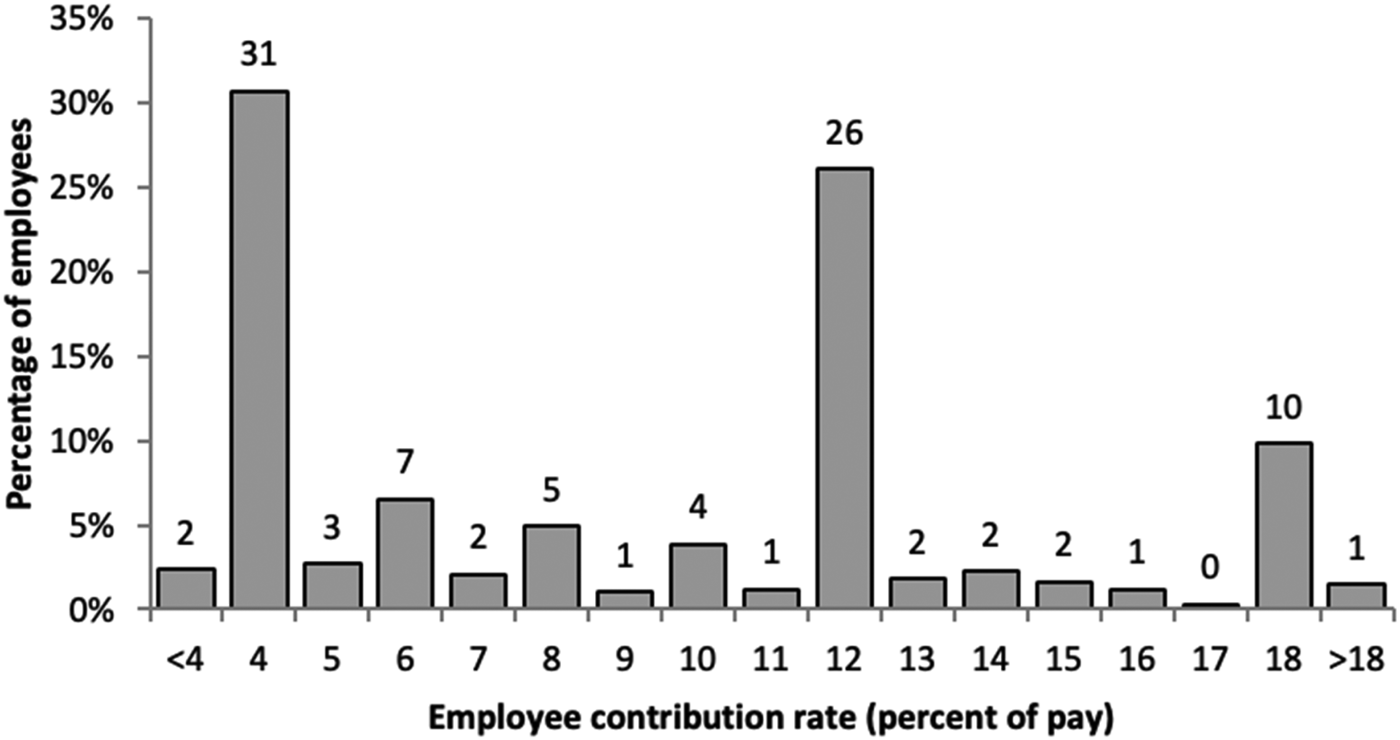
Of the employees who opted out of the default contribution rate, 55.4/75.4 = 74 percent chose a rate lower than 12 percent in tenure month 12. Figure 3 shows a more detailed distribution of employee contribution rates at 12 months of tenure. Consistent with the findings of previous studies (see, e.g., Choi et al., Reference Choi, Laibson, Madrian, Metrick and Wise2004), many employees contributed the minimum amount required to receive the maximum employer match – in this case, 10 percent of the sample had a contribution rate of 18 percent. However, 31 percent of the sample chose a contribution rate of 4 percent, which was the lowest officially permissible rate for employees who wished to remain active plan participants. A small number of employees received special permission to participate at a lower contribution rate. The distribution of contribution rates has little mass immediately to the left or right of 12 percent, so many employees who opted out of the default rejected the 12 percent contribution rate decisively (as predicted by optimization theory) instead of adjusting their contribution rates incrementally.
Distribution of employee contribution rates at tenure month 12. This figure shows the distribution of employee contribution rates at tenure month 12. Employee contributions out of bonuses are disregarded. The sample is the 671 employees who are observed in the data for at least 12 months.

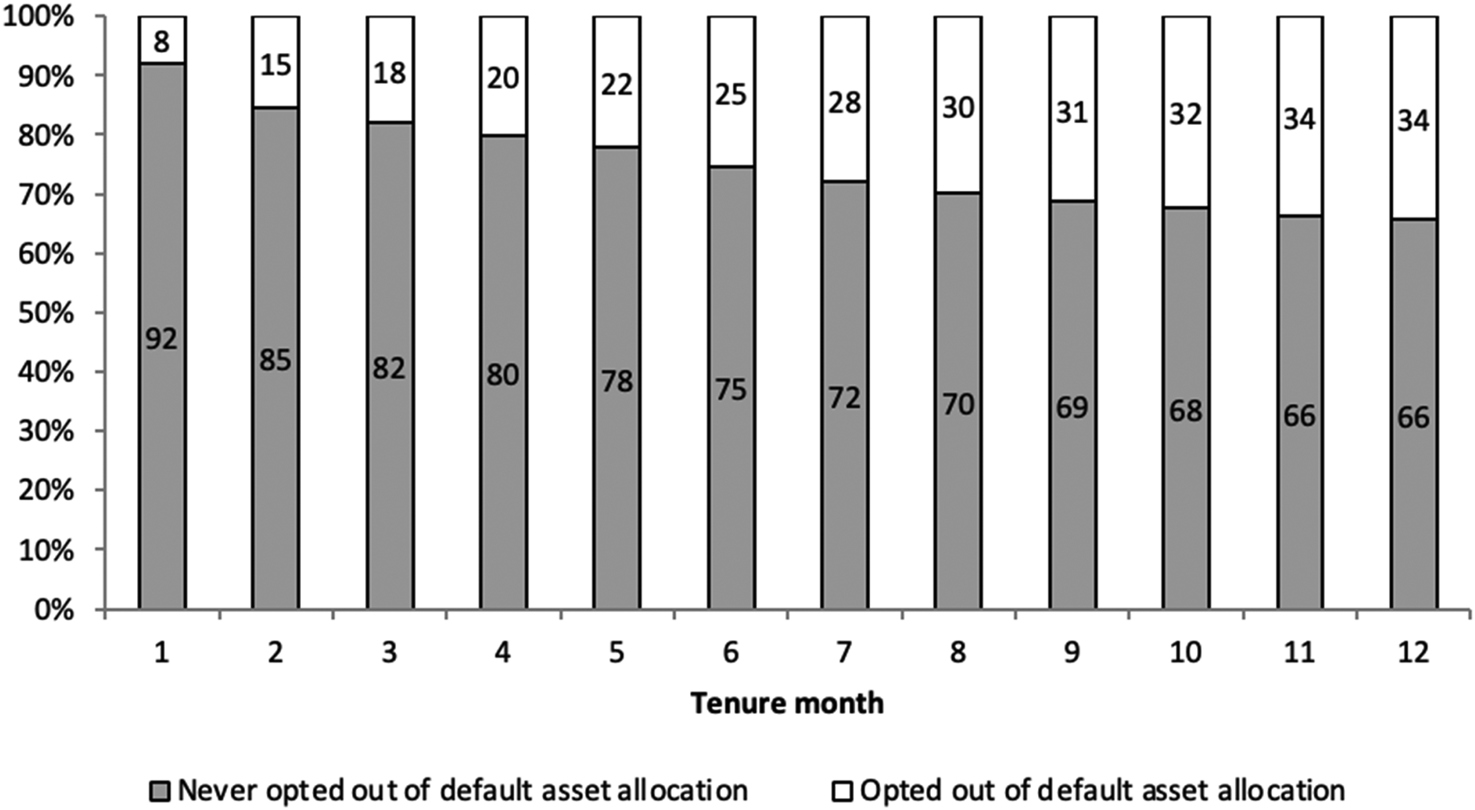
Opt-out patterns on the asset allocation dimension are quite different from those on the contribution rate dimension. Figure 4 shows that 66 percent of the sample had never opted out of the asset allocation default by tenure month 12. This outcome is close to the midpoint of outcomes in the plans studied in previous work, where 26–89 percent of participants had all of their balances invested in the default at roughly similar time horizons.
Opt-out from the default asset allocation by tenure. For each level of tenure, this figure displays the fraction of employees who had never opted out of the default asset allocation, which was a mix of bonds and equities. The sample is the 671 employees who are observed in the data for at least 12 months.

Figure 5 combines information on contribution rate opt-out behavior with information on asset allocation opt-out behavior. At 12 months of tenure, 18 percent of the sample had never opted out of the contribution rate default or the asset allocation default, whereas 27 percent had opted out of both. Interestingly, 48 percent had opted out of the contribution rate default but not the asset allocation default, and the reverse was true for only 7 percent of the sample. It is possible that the asset allocation default had a greater impact than the contribution rate default because individuals had more confidence in their ability to choose an appropriate savings rate than in their ability to choose an appropriate asset allocation. Such individuals might have opted out of the default contribution rate but maintained the default asset allocation, which they perceived as implicitly endorsed by their employer. It is also possible that many employees kept the default asset allocation because it was close to their optimal asset allocation.
Opt-out from the default contribution rate and asset allocation by tenure. For each level of tenure, this figure displays the fraction of employees who had opted out of neither the 12% default contribution rate nor the default asset allocation, opted out of the default contribution rate but not the default asset allocation, opted out of the default asset allocation but not the default contribution rate, and opted out of both defaults. The sample is the 671 employees who are observed in the data for at least 12 months.

5. Who remains at the default contribution rate?
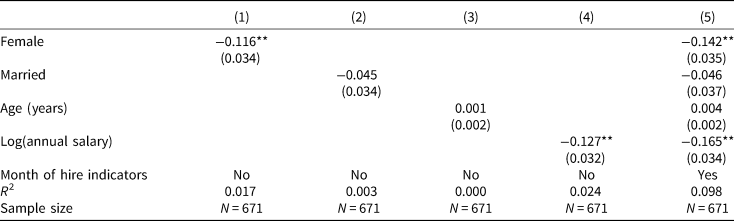
In this section, we examine which employees were more likely to remain at the default contribution rate. We begin by studying correlations between contributing at the default rate and employee characteristics. Table 4 presents the results of ordinary least squares regressions in which the outcome variable is an indicator for being at the default contribution rate of 12 percent at tenure month 12. The sample is the 671 employees who remained in our data set for at least 12 months, and we calculate heteroskedasticity-robust standard errors.
Predictors of being at the default contribution rate

This table presents the results of ordinary least squares regressions in which the outcome variable is an indicator for being at the default contribution rate of 12% at tenure month 12. The predictor variables, which are all measured as of tenure month 12, are as shown. The sample is the 671 employees who are observed in the data for at least 12 months. Heteroskedasticity-robust standard errors are in parentheses. * and ** indicate statistical significance at the 5% and 1% levels, respectively.
In column 1 of Table 4, the sole predictor variable is an indicator for female employees, and we find that female employees are a statistically significant 11.6 percentage points less likely to be at the default contribution rate than male employees. In column 2, the sole predictor variable is an indicator for being married, and while the point estimate indicates that married employees are 4.5 percentage points less likely to be at the default contribution rate than non-married employees, the estimate is not statistically significantly different from zero. The sole predictor variable in column 3 is employee age, and the point estimate is close to zero and not statistically significant. In column 4, the sole predictor variable is the logarithm of annual salary, and we find that an increase in annual salary of 10 log points is associated with a 1.27 percentage point decrease in the likelihood of contributing at the default rate. This estimate is statistically significant at the 1 percent level. The interquartile range for the logarithm of annual salary is 9.91–10.66, so a move from the 25th percentile to the 75th percentile of the distribution predicts a 0.127 × (10.66 − 9.91) = 9.53 percentage point decrease in the likelihood of being at the default contribution rate. In column 5, all four predictor variables are included in the same regression, along with a series of indicators for month of hire, and the results are similar. If anything, the coefficients on the female indicator and the logarithm of annual salary are larger in magnitude.Footnote 22
We proceed to conduct detailed analyses of the statistically significant relationships from the regressions, focusing first on the relationship between contribution rates and salaries. We will then show that the relationship between contribution rates and gender exhibits patterns that are similar but weaker.
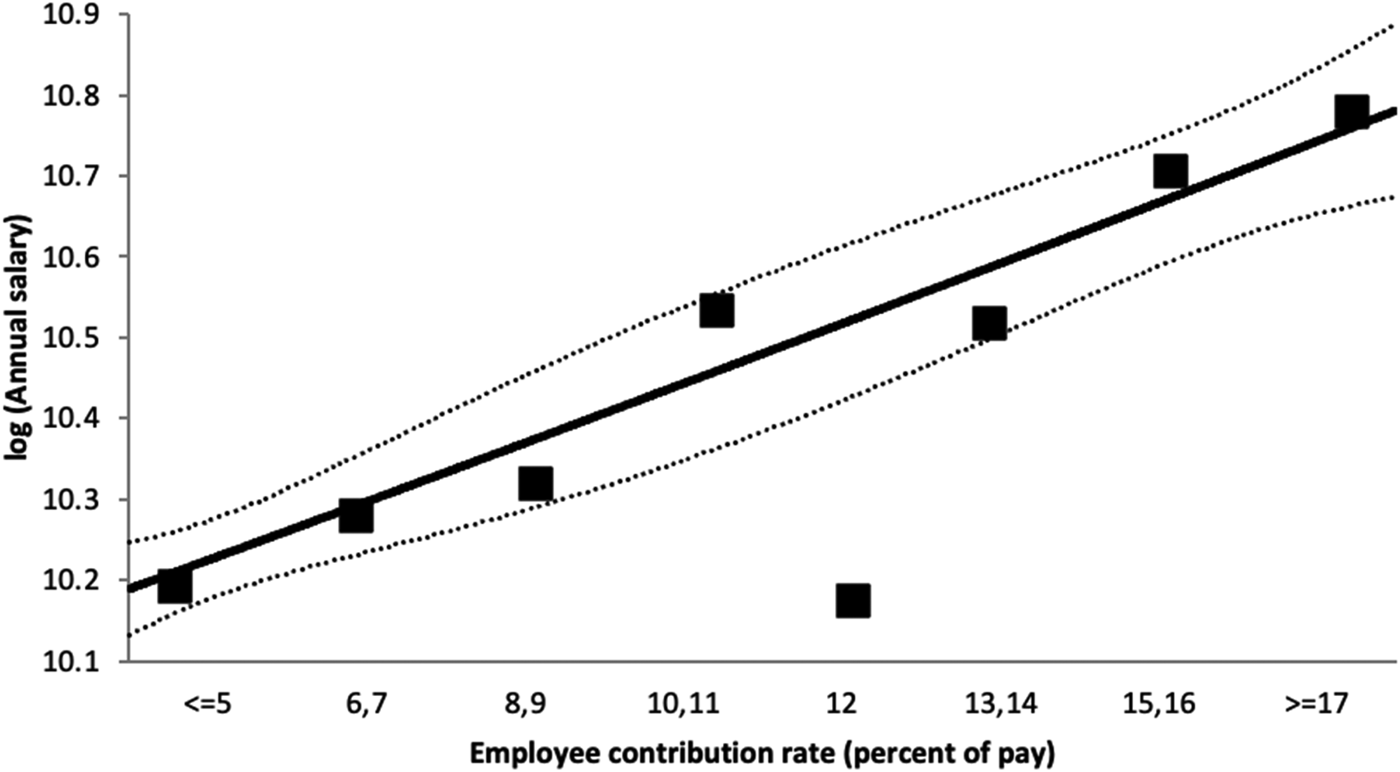
In Figure 6, we group employees into eight categories based on their contribution rates at tenure month 12. Employees with a contribution rate of 12 percent form one group, but other groups are based on pairs of contribution rates. For example, employees with contribution rates of 13 percent and 14 percent are grouped together.Footnote 23 In this figure and in the regressions that accompany it (see Table 5), contribution rates less than 4 percent are recoded as being equal to 4 percent, and contribution rates greater than 18 percent are recoded as being equal to 18 percent, although the results are nearly identical if employees with contribution rates less than 4 percent or greater than 18 percent are dropped from the sample. The boxes in Figure 6 indicate the mean of the logarithm of annual salary for each group of employees. Annual salary is the sum of monthly compensation over the first 12 full months of tenure. It is clear from the figure that employees contributing at a 12 percent rate had lower salaries on average than employees who chose a slightly higher or lower contribution rate.
Employee salaries by contribution rate at tenure month 12. This figure divides employees into groups based on their employee contribution rate at tenure month 12. Employee contributions out of bonuses and employer contributions are disregarded. Employee contribution rates less than 4% are recoded to be equal to 4%, and employee contribution rates greater than 18% are recoded to be equal to 18%. The boxes indicate the mean of the logarithm of annual salary for employees in each group. We perform an ordinary least squares regression of the logarithm of annual salary on the employee contribution rate, the employee contribution rate squared, and an indicator variable for the employee contribution rate being 12%. The solid line shows the predicted values from this regression, restricting the contribution rate indicator variable to be zero at all contribution rates. The dotted lines delineate the 95% confidence interval. The sample is the 671 employees who are observed in the data for at least 12 months.

Regressions of log employee salary on contribution rate

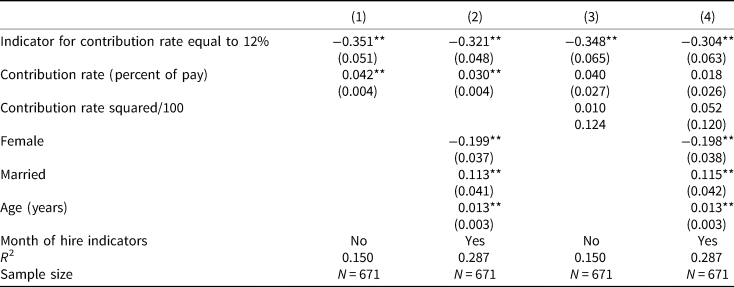
This table presents the results of ordinary least squares regressions in which the outcome variable is the logarithm of annual salary and the predictor variables are as shown. The contribution rate is the employee contribution rate, disregarding contributions out of bonuses and employer contributions. Employee contribution rates less than 4% are recoded to be equal to 4%, and employee contribution rates greater than 18% are recoded to be equal to 18%. All variables are measured as of tenure month 12 for each employee. The sample is the 671 employees who are observed in the data for at least 12 months. Heteroskedasticity-robust standard errors are in parentheses. * and ** indicate statistical significance at the 5% and 1% levels, respectively.
To formally show this difference in salaries, we run an ordinary least squares regression of the logarithm of annual salary on the employee contribution rate, the employee contribution rate squared, and an indicator variable for the employee contribution rate being equal to 12 percent (which keeps employees at the 12% default from affecting the estimation of the other contribution rate coefficients). The fitted values from this regression, restricting the indicator variable to be zero at all contribution rates, are shown by the solid line in Figure 6; the dotted lines delineate 95 percent confidence intervals. Employees at a 12 percent contribution rate had salaries that were 35 log points lower on average than the level we would predict from the relationship between salaries and contribution rates among employees who are not at 12 percent, a highly statistically significant difference.
The regression results used to construct Figure 6 are reported in column 3 of Table 5. Column 1 of Table 5 reports the results when the squared term is dropped from the specification. Columns 2 and 4 add controls for gender, marital status, age, and month of hire to the regressions. All of the specifications give similar results: the coefficient on the indicator variable for having a contribution rate of 12 percent ranges from −0.304 to −0.351 and is always statistically significant at the 1 percent level, supporting the robustness of the claim that employees with 12 percent contribution rates had salaries that were approximately one-third lower on average than would be predicted by the characteristics of employees who chose non-default contribution rates. The composition of employees who contribute at the default rate is markedly different from the composition of employees who contribute at neighboring rates.
Previous studies have documented that low-income employees are slower to opt out of defaults than high-income employees (Choi et al., Reference Choi, Laibson, Madrian, Metrick and Wise2004). The results from this savings plan are consistent with those prior results. Two broad sets of explanations could account for low-income employees' lower frequency of opting out of the default. First, the default might be closer to low-income employees' ideal contribution rates – what they would choose if they were compelled to make active decisions – than to high-income employees' ideal contribution rates.Footnote 24 Second, low-income employees might face higher barriers to active decision making, such as a tendency to procrastinate or a lack of financial expertise. We discuss next why the savings plan studied in this paper provides suggestive evidence that the latter explanation partly accounts for low-income employees' higher likelihood of remaining at the default.
Under the hypothesis that low-income employees are more likely to remain at the default only because the default is closer to their ideal contribution rates, low-income and high-income employees who have the same ideal contribution rate share the same probability of opting out of the default to that ideal contribution rate. Under the assumption that employees have a stronger desire to opt out of the default when the default is farther from their ideal contribution rate (e.g., due to a strictly monotonic loss function; see Carroll et al., Reference Carroll, Choi, Laibson, Madrian and Metrick2009), this probability of opting out of the default increases with the distance between the default and the ideal contribution rate. If low-income employees' ideal contribution rates are closer to the default than high-income employees' ideal contribution rates, the percentage of low-income employees who remain at the default is higher than the percentage of high-income employees who remain at the default.
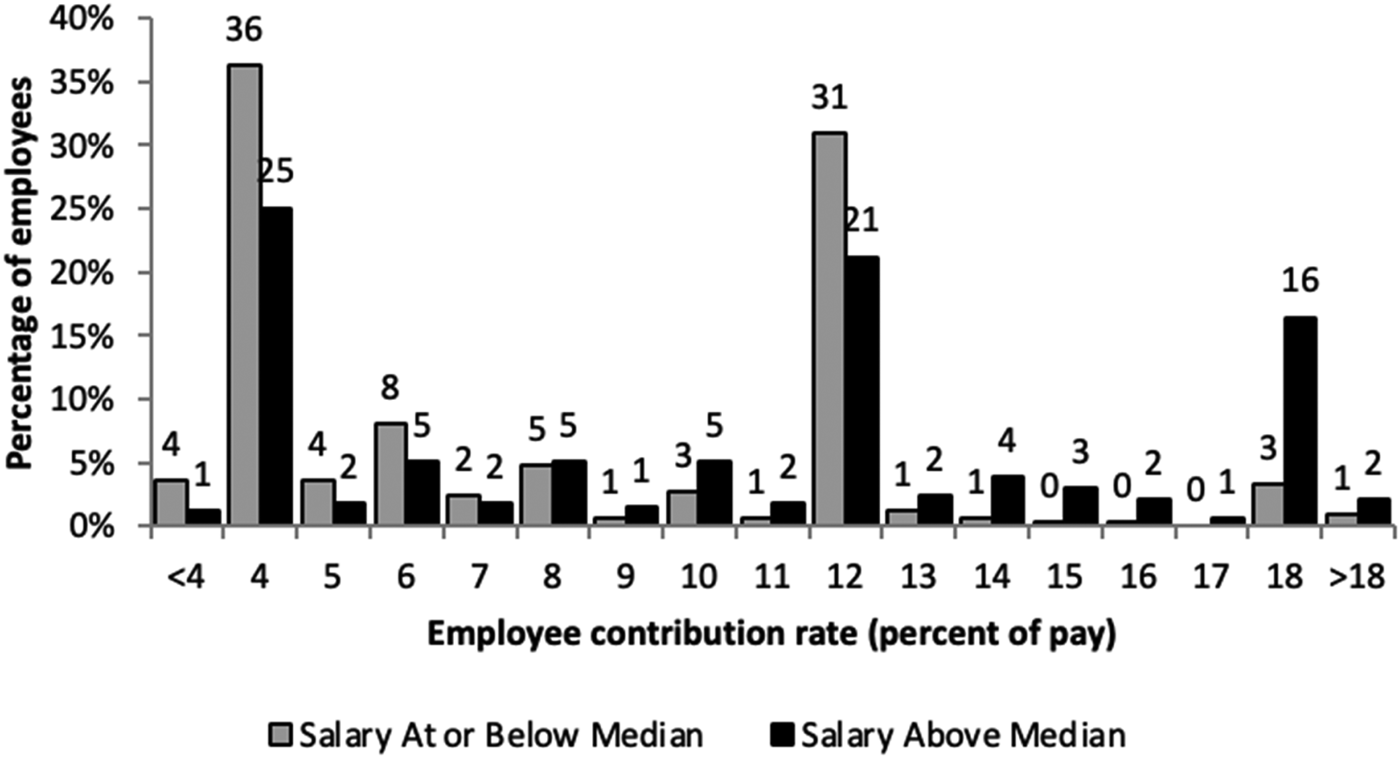
The savings plan studied in this paper seems not to fit this model of contribution rate decisions. Figures 7 and 8 suggest that low-income employees' ideal contribution rates are farther from the default than high-income employees' ideal contribution rates. Figure 7 shows the distribution of employee contribution rates at tenure month 12, separately for employees with annual salaries above the sample median and for employees with annual salaries at or below the sample median. When employees with salaries at or below the median opt out of the default contribution rate, they tend to opt out to contribution rates that are farther from the default than employees with salaries above the median. Indeed, conditional on opting out of the default, the mean absolute deviation between the selected contribution rate and the default of 12 percent was 6.9 percentage points for employees with salaries at or below the median and 6.0 percentage points for employees with salaries above the median, a difference that is statistically significant at the 1 percent level.Footnote 25 Of course, the chosen contribution rates of employees who opt out of the default are unlikely to be a perfect guide to the ideal contribution rates of employees who are still at the default, and the latter group of employees is relevant for judging whether low-income employees' ideal contribution rates are closer to the default than are high-income employees' ideal contribution rates. We therefore pursue a complementary analysis strategy, which we describe next.
Distribution of employee contribution rates at tenure month 12 among employees with annual salaries above the median and among employees with annual salaries at or below the median. This figure shows the distribution of employee contribution rates at tenure month 12, separately for employees with annual salaries above the median and for employees with annual salaries at or below the median. The sample is the 671 employees who are observed in the data for at least 12 months. Employee contributions out of bonuses and employer contributions are disregarded.

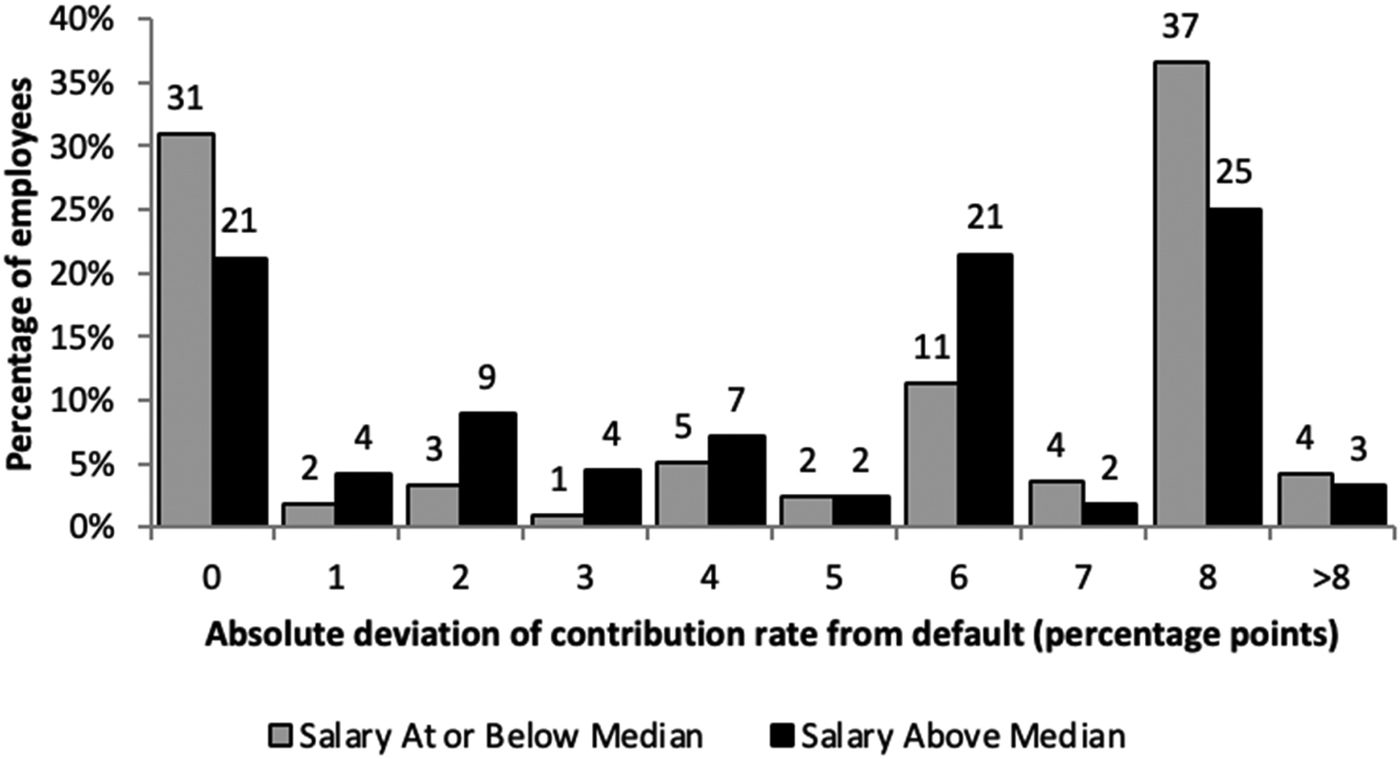
Distribution of absolute distance between employee contribution rate at tenure month 12 and default contribution rate among employees with annual salaries above the median and among employees with annual salaries at or below the median. This figure shows the distribution of the absolute distance between an employee's contribution rate at tenure month 12 and the default contribution rate of 12%, separately for employees with annual salaries above the median and for employees with annual salaries at or below the median. The sample is the 671 employees who are observed in the data for at least 12 months. Employee contributions out of bonuses and employer contributions are disregarded.

Figure 8 shows the distribution of the absolute distance between the employee contribution rate and the default contribution rate, separately for employees with annual salaries above the sample median and for employees with annual salaries at or below the sample median. This figure reveals that the percentage of employees who opted out of the default to a contribution rate from 1 to X percentage points away from the default is, for all positive values of X, greater for employees with salaries above the median than for employees with salaries at or below the median. In the Appendix, we show that this pattern is inconsistent with a model in which no employee has the default as their ideal contribution rate (see Figure 1) and in which the likelihood of opting out of the default is an increasing function of the absolute distance between the default and the ideal contribution rate, with the same function applying to all employees. Intuitively, interpreting the empirical pattern through the lens of the model implies that the percentage of employees with ideal contribution rates between 1 and X percentage points away from the default, for all feasible positive values of X, is greater for employees with salaries above the median than for employees with salaries at or below the median. But this is a contradiction because the percentage of employees with ideal contribution rates that are the maximum feasible distance from the default or less must be equal to 100 percent both for employees with salaries above the median and for employees with salaries at or below the median. We conclude that such a model of contribution rate decisions is incomplete.
A leading explanation for the observed patterns in the data is that if an employee with a salary at or below the median has the same ideal contribution rate as an employee with a salary above the median, the former employee is less likely to opt out of the default than the latter employee, perhaps due to barriers to active decision making, such as procrastination or a lack of expertise with respect to financial decisions. An important caveat, however, is that we cannot rule out some alternative interpretations. For example, the relationship between the likelihood of opting out and the signed difference between the ideal contribution rate and the default might not be symmetric around zero difference, as we assumed in our analysis. Perhaps employees with salaries at or below the median had weaker financial incentives to opt out of the 12 percent default because employees with salaries above the median had a greater capacity to increase their contribution rates above 12 percent and thereby obtain employer matching contributions. On the other hand, a countervailing argument is that if employees with salaries at or below the median are constrained in their ability to obtain employer matching contributions, they should have a strong motive to opt out of the default to lower contribution rates, which enables them to save outside the retirement plan and later choose higher contribution rates inside the plan to earn employer matching contributions. Overall, the evidence suggests that barriers to active decision making partly explain why employees with salaries at or below the median have a lower likelihood of opting out of the default contribution rate than employees with salaries above the median.
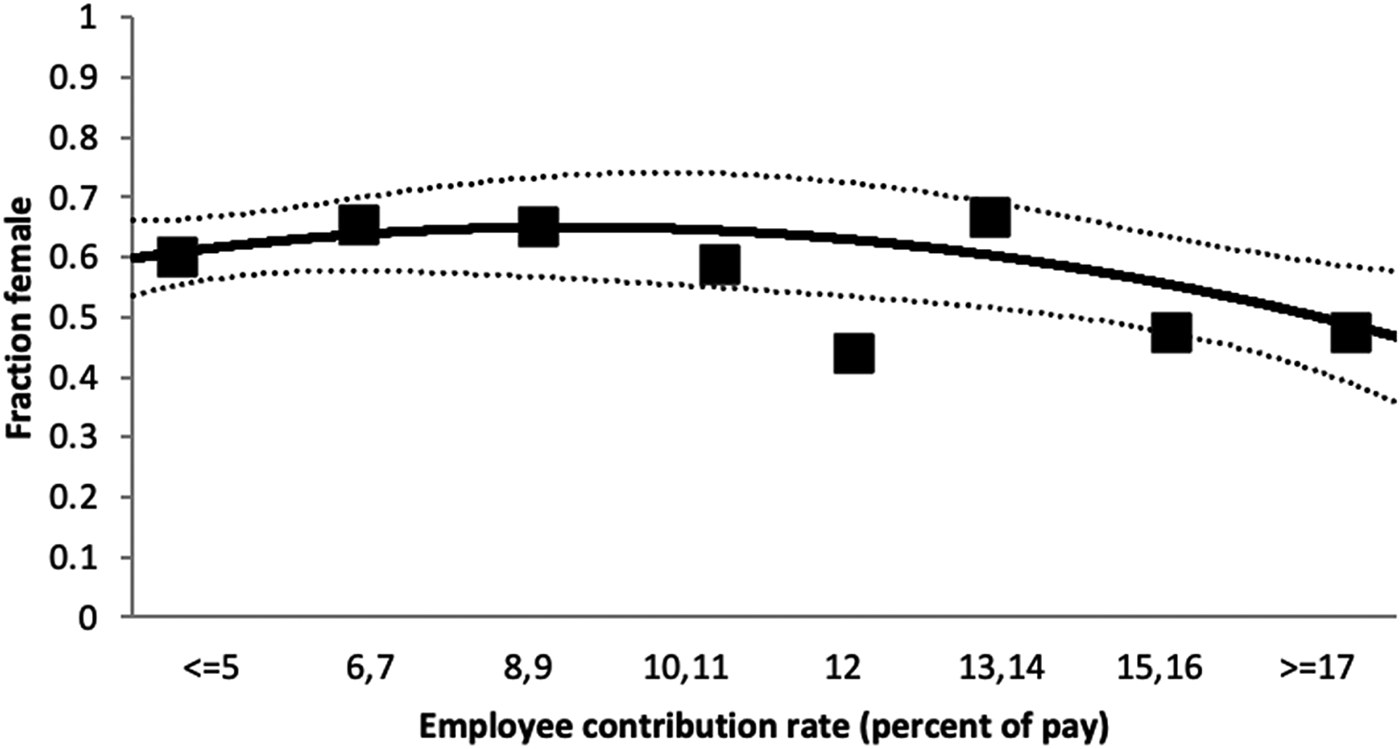
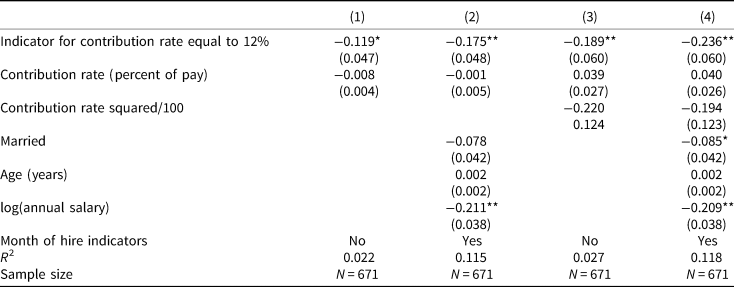
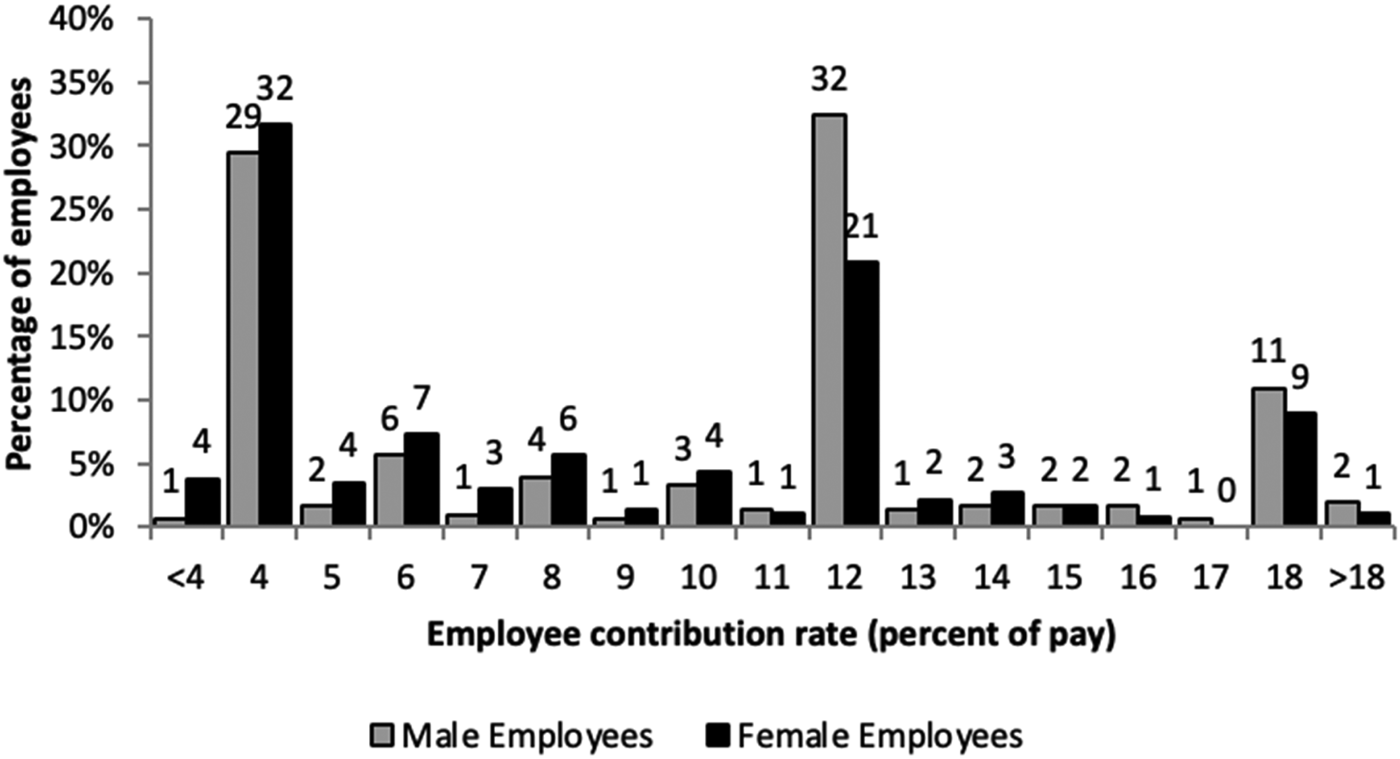
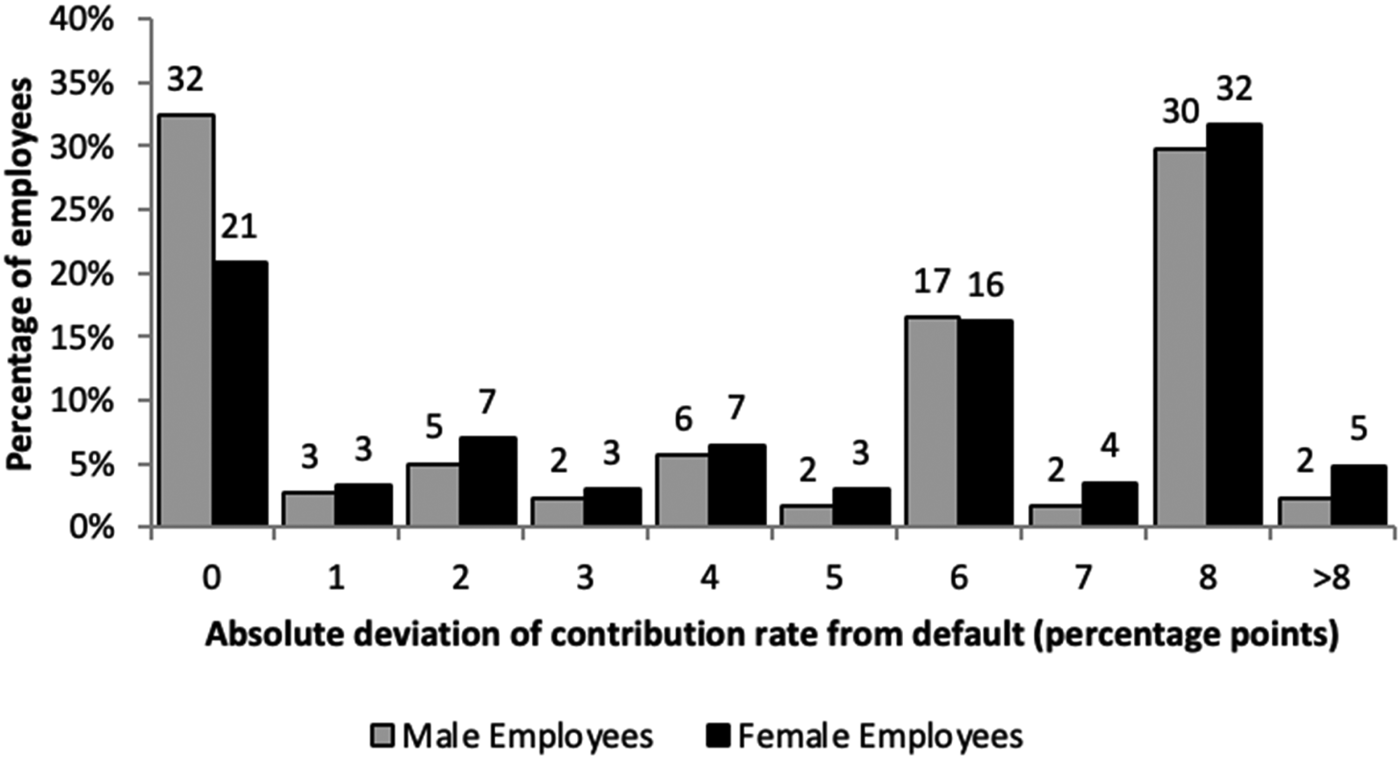
The empirical contrast between female employees and male employees is directionally similar to but weaker than the contrast between employees with salaries above the median and employees with salaries at or below the median. Figure 9, which is analogous to Figure 6, shows that the percentage of employees at a 12 percent contribution rate who are female is 19 percentage points lower than would be predicted by the percentage of employees at neighboring contribution rates who are female. Table 6, which is analogous to Table 5, reveals that this qualitative conclusion is robust to different regression specifications, with the estimates indicating that the percentage of employees at a 12 percent contribution rate who are female is between 11.9 and 23.6 percentage points lower than would be predicted by the percentage of employees at non-default contribution rates who are female. Figure 10, which shows the distribution of employee contribution rates at tenure month 12 separately for female employees and for male employees, suggests that female employees who opt out of the default of 12 percent choose contribution rates that are closer to 12 percent than do male employees who opt out of the default. Figure 11, which shows the distribution of the absolute distance between the employee contribution rate and the default contribution rate separately for female employees and for male employees, indicates that the percentage of employees who opted out of the default to a contribution rate that is between 1 and X percentage points away from the default is, for all positive values of X, higher for female employees than for male employees. However, among employees who opted out of the default, the mean of the absolute distance between the chosen contribution rate and the default is 6.3 percentage points for female employees and 6.6 percentage points for male employees, a difference that is not statistically significant.Footnote 26
Fraction of employees who are female by contribution rate at tenure month 12. This figure divides employees into groups based on their employee contribution rate at tenure month 12. Employee contributions out of bonuses and employer contributions are disregarded. Employee contribution rates less than 4% are recoded to be equal to 4%, and employee contribution rates greater than 18% are recoded to be equal to 18%. Each box indicates the fraction of employees in a group who are female. We perform an ordinary least squares regression of an indicator for female employees on the employee contribution rate, the employee contribution rate squared, and an indicator variable for the employee contribution rate being 12%. The solid line shows the predicted values from this regression, restricting the contribution rate indicator variable to be zero at all contribution rates. The dotted lines delineate the 95% confidence interval. The sample is the 671 employees who are observed in the data for at least 12 months.

Regressions of female indicator on contribution rate

This table presents the results of ordinary least squares regressions in which the outcome variable is an indicator for female employees and the predictor variables are as shown. The contribution rate is the employee contribution rate, disregarding contributions out of bonuses and employer contributions. Employee contribution rates less than 4% are recoded to be equal to 4%, and employee contribution rates greater than 18% are recoded to be equal to 18%. All variables are measured as of tenure month 12 for each employee. The sample is the 671 employees who are observed in the data for at least 12 months. Heteroskedasticity-robust standard errors are in parentheses. * and ** indicate statistical significance at the 5% and 1% levels, respectively.
Distribution of employee contribution rates at tenure month 12 among female employees and among male employees. This figure shows the distribution of employee contribution rates at tenure month 12, separately for female employees and for male employees. The sample is the 671 employees who are observed in the data for at least 12 months. Employee contributions out of bonuses and employer contributions are disregarded.

Distribution of absolute distance between employee contribution rate at tenure month 12 and default contribution rate among female employees and among male employees. This figure shows the distribution of the absolute distance between an employee's contribution rate at tenure month 12 and the default contribution rate of 12%, separately for female employees and for male employees. The sample is the 671 employees who are observed in the data for at least 12 months. Employee contributions out of bonuses and employer contributions are disregarded.

In summary, employees with salaries at or below the median likely faced greater barriers to active decision making than employees with salaries above the median, and those barriers can partly explain why employees with salaries at or below the median were less likely to opt out of the default contribution rate than employees with salaries above the median. It is not clear that male employees faced greater barriers to active decision making than female employees, although the evidence does not rule out this possibility.
6. Conclusion
Prior research has examined retirement savings plan automatic enrollment at default contribution rates in the range of 1–6 percent of income. This literature documents that 36–72 percent of employees continue to contribute at the default rate at time horizons of less than one year. In this article, we study a unique plan that automatically enrolled new employees at a 12 percent default contribution rate. This default rate was likely suboptimal for employees because the employer only matched employee contributions that exceeded 12 percent of pay. By 12 months of tenure, 75 percent of the employees had opted out of this default, and many of these employees chose lower contribution rates. Thus, our results suggest that the default contribution rate loses some of its influence if it is not close to a rate the employees would actively choose for themselves.
Many employees opted out of the default contribution rate, but there were also some who did not. Employees who had a 12 percent contribution rate at 12 months of tenure had salaries that were approximately one-third lower than what would be predicted from the salaries of employees who had chosen non-default contribution rates. Our analysis suggests that barriers to active decision making, such as a tendency to procrastinate or a lack of domain relevant knowledge, played some role in low-income employees' higher likelihood of remaining at the default.
A limitation of our analysis is that we study data from a single retirement plan, and our results might not extrapolate to other plans. Another limitation is that we do not have data to construct a control group of employees at the same company who were not automatically enrolled in the retirement plan, making it difficult to draw strong conclusions regarding the causal impact of automatic enrollment at a 12 percent default contribution rate on savings outcomes. It would be valuable for future research to estimate the effects of high default contribution rates in settings that offer a control group.
It would also be valuable for future research to investigate the optimality of high default contribution rates from the social planner's perspective. We have emphasized that the structure of employer matching contributions at the company we study implies that the default contribution rate of 12 percent was unlikely to be the ideal contribution rate from the perspective of any individual employee. However, the default contribution rate of 12 percent might have been a wise policy for a social planner to adopt. It prompted many employees to opt out, and those employees might have had sufficient knowledge to select the contribution rates that were best suited to their individual circumstances. Carroll et al. (Reference Carroll, Choi, Laibson, Madrian and Metrick2009) derive theoretical conditions under which an unattractive default might be optimal for such a reason. At the same time, the employees who remained at the default saved at a rate that was higher than the rate of most other employees, suggesting that they were less likely to fall short of retirement savings goals. However, employees who accepted the default contribution rate at this particular employer received no matching dollars. Future work should analyze the consequences of high default contribution rates for consumption and retirement plan balances over the long run to better understand the implications for employee welfare.
Acknowledgments
The authors thank Joshua Rauh and two anonymous reviewers for their comments and thank Yeguang Chi and Richard Lombardo for excellent research assistance.
Author contributions
Conceptualized paper: J. B., D. L., B. C. M., J. C., wrote paper: J. B., J. C., edited paper: D. L., implemented empirical analysis: J. B., R. G., project leadership: J. B., J. C.
Financial support
The research reported herein was supported by the US Social Security Administration (SSA) through grant no. 10-M-98363-1-02 to the National Bureau of Economic Research (NBER) as part of the Retirement Research Consortium (RRC). The authors also acknowledge individual and collective financial support from the National Institutes of Health (grants R01-AG-021650 and T32-AG-000186) and the Pershing Square Fund for Research on the Foundations of Human Behavior. The findings and conclusions expressed are solely those of the authors and do not represent the views of SSA, any agency of the Federal Government, the RRC, the authors' universities, or NBER.
Appendix. A model of the likelihood of opting out of the default contribution rate
Figures 7 and 8 contrast the contribution rate distribution at tenure month 12 for employees with annual salaries above the sample median with the contribution rate distribution at tenure month 12 for employees with annual salaries at or below the sample median. In this Appendix, we show that the empirical patterns in Figures 7 and 8 are inconsistent with a model in which an employee's likelihood of opting out of the default contribution rate and moving to their ideal contribution rate is an increasing function of the distance between the default and their ideal, with the same function applying to all employees.
Let $\pi _d^h$ ($\pi _d^l$
 ) denote the fraction of high-income employees (low-income employees) who have their ideal contribution rate an absolute distance of d percentage points away from the default contribution rate of 12 percent. We assume that $\pi _0^h = \pi _0^l = 0$
 because in the retirement savings plan that we study, the default contribution rate of 12 percent corresponds to a non-convex kink in the budget set and is unlikely to be ideal for any employee (smooth indifference curves cannot be tangent to a budget set at a point where the budget set has a non-convex kink; see Figure 1). Given an ideal contribution rate of absolute distance d percentage points away from the default contribution rate, the function f(d) maps the absolute distance d to the probability that the employee opts out of the default and moves to their ideal contribution rate. We assume that the function is identical for all employees in our model to capture the assumption that barriers to active decision making do not differ by salary. We further assume that $0 < f( d ) {\kern 1pt} {\rm \leqslant }{\kern 1pt} 1$
 for d > 0 and that the function is non-decreasing in d: $f( d ) {\kern 1pt} {\rm \leqslant }{\kern 1pt} f( {{d}^{\prime}} )$
 for d < d ′. If an employee does not move to their ideal contribution rate, they remain at the default.
A high-income employee is observed at a contribution rate with an absolute distance of d percentage points away from the default if their ideal contribution rate is an absolute distance of d percentage points away from the default and they decide to opt out of the default. Thus, the fraction of high-income employees who are observed at a contribution rate with an absolute distance of d percentage points away from the default is $f( d ) \pi _d^h$ . The analogous fraction for low-income employees is $f( d ) \pi _d^l$
 .
When we interpret Figure 8 through the lens of the model, it indicates that $\sum\nolimits_{d = 1}^D {f( d ) \pi _d^l } < \sum\nolimits_{d = 1}^D {f( d ) \pi _d^h }$ for $D = 1, \;\;2, \;\;3, \;\;\ldots , \;\;\bar{D}$
 , where $\bar{D}$
 is the maximum possible value for d.Footnote 27 We will demonstrate that these conditions, which are implied by the combination of the model and the data, generate a contradiction.
We will show that $\sum\nolimits_{d = 1}^D {\pi _d^l } < \sum\nolimits_{d = 1}^D {\pi _d^h }$ for $D = 1, \;\;2, \;\;3, \;\;\ldots , \;\;\bar{D}$
 by strong induction. First, note that $f( 1 ) \pi _1^l < f( 1 ) \pi _1^h$
 implies that $\pi _1^l < \pi _1^h$
 , so the proposition holds for D = 1. We now describe the proof for D > 3, but straightforward shortened versions of the proof apply for D = 2, 3:

Because $\pi _1^h -\pi _1^l > 0$ and f(d) ≤ f(d ′) for d < d ′:

Because $\sum\nolimits_{d = 1}^2 {( {\pi_d^h -\pi_d^l } ) > 0}$ and f(d) ≤ f(d ′) for d < d ′:

Thus, $\sum\nolimits_{d = 1}^D {\pi _d^l } < \sum\nolimits_{d = 1}^D {\pi _d^h }$ holds for all D. In particular, $\sum\nolimits_{d = 1}^{\bar{D}} {\pi _d^l } < \sum\nolimits_{d = 1}^{\bar{D}} {\pi _d^h }$
 . However, because $\{ {\pi_d^l } \}$
 and $\{ {\pi_d^h } \}$
 represent probability distributions and we assume that $\pi _0^h = \pi _0^l = 0$
 , we have $\sum\nolimits_{d = 1}^{\bar{D}} {\pi _d^l } = \sum\nolimits_{d = 1}^{\bar{D}} {\pi _d^h = 1}$
 , and we have reached the contradiction 1 < 1. We conclude that the model and the data are inconsistent with each other.
Intuitively, Figure 8 shows that the fraction of high-income employees who choose contribution rates 1 percentage point away from the default is greater than the fraction of low-income employees who do the same. The model assumes that conditional on having the same ideal contribution rate, a high-income employee and a low-income employee have the same likelihood of opting out of the default to their ideal rate – that is, the same function f applies to all employees. When we interpret Figure 8 through this lens, we infer that a greater fraction of high-income employees than low-income employees have an ideal contribution rate that is 1 percentage point away from the default. Figure 8 further shows that the fraction of high-income employees who opt out to contribution rates that are d > 1 percentage points or less away from the default is greater than the fraction of low-income employees who do the same, regardless of the distance d that we consider. This fact, combined with the assumption that f is non-decreasing in d, implies that according to the model, a greater fraction of high-income employees than low-income employees have an ideal contribution rate that is 1 to d percentage points away from the default, regardless of the distance d that we consider. However, if we consider the maximum possible value for d – that is, $\bar{D}$ – we reach a contradiction because both the fraction of high-income employees and the fraction of low-income employees who have their ideal contribution rate 1 to $\bar{D}$
 percentage points away from the default must be equal to one, since we assume that no employee's ideal contribution rate equals the default.