Nomenclature
- ATC
-
air traffic control
- EASA
-
European Union Aviation Safety Agency
- FAA
-
Federal Aviation Administration
- FDM
-
flight data monitoring
- HF
-
human factors
- ICAO
-
International Civil Aviation Organization
- RI
-
runway incursion
- RQ
-
research question
- SRM
-
safety risk management
- VWM
-
visual working memory
Greek symbol
-
 $\rho$
-
Spearman rank-order correlation coefficient

1.0 Introduction
Runway incursions (RIs) remain a significant surface-operations hazard. International runway-safety programmes emphasise layered defences including standardised aerodrome signs, markings and lighting, flight crew training and surface movement guidance systems [1, 2]. Visual aids are therefore not merely ‘information’, but part of the safety architecture that must remain effective under high workload, low visibility and time pressure.
The design of aerodrome visual aids is highly standardised (e.g. ICAO Annex 14 and ICAO Doc 9157 Part 4; FAA AC 150/5340-18) [3–5]. Nevertheless, safety reviews and empirical studies continue to identify pilot deviations and surface-navigation errors as recurring elements in RI scenarios, especially where complexity, unfamiliarity, construction changes or degraded visibility increase cognitive demand [2, 6–Reference Pope9].
Prior manuscripts on perception can be criticised (fairly) when they (i) rely mainly on general perceptual theory, (ii) lack explicit methods and (iii) make recommendations without validation. To avoid those grounds, this paper makes three concrete contributions:
-
1. It reports original empirical data from an operational pilot survey focused on aerodrome signs, markings and lighting.
-
2. It specifies the research design (instrument, sampling, analysis) and states findings as exploratory insights rather than proof of causal safety benefit.
-
3. It derives testable implications linked to standards and runway-safety programmes, and proposes a staged validation agenda.
1.1. Research questions
The survey and analysis were organised around three research questions (RQs):
-
• RQ1: Which visual attributes (shape/text, colour, lighting cues) do pilots report as most salient for rapid recognition during taxi and runway crossing?
-
• RQ2: How do pilots report workload-related states (time pressure, low visibility, fatigue) influencing the likelihood of missed or delayed recognition?
-
• RQ3: Are workload-related difficulties in perceiving airport signage, markings and lighting associated with self-reported hesitation or confusion during taxiing or runway crossing?
2.0 Background: perception, cognitive load and aerodrome visual aids
2.1. Literature approach
This paper is not a Preferred Reporting Items for Systematic reviews and Meta-Analyses (PRISMA)-style systematic review. Instead, it uses a targeted narrative approach: (i) authoritative standards and runway-safety guidance (ICAO/FAA/EASA), and (ii) empirical studies on runway incursions and surface operations involving visual aids and pilot cognition. Sources were identified through keyword searches (e.g. “runway incursion pilot deviation signs markings lights”, “airport movement area signage cognition”, “surface operations visual attention”) and citation chaining from high-authority documents [1, 2, 6].
2.2. Aerodrome visual aids as a safety interface
Aerodrome markings, signs and lighting are specified to provide conspicuity, legibility and unambiguous meaning across diverse aerodromes [3–5]. From a human-factors perspective, these aids act as an external constraint and memory support during surface navigation [2]. When cues are noticed late or misinterpreted, risk can escalate rapidly because stopping distance is limited and the ‘time-to-unsafe’ on an active runway is short.
2.3. Pre-attentive features and attention under workload
Visual cognition distinguishes rapid processing of basic features (e.g. colour, orientation, simple shape) from slower, attention-demanding processing such as reading and serial search [Reference Treisman and Gelade10, Reference Wolfe11]. Under increased workload, attentional resources narrow and omission becomes more likely, particularly for information that requires foveal attention and visual working memory (VWM) [Reference Wickens12, Reference Baddeley13]. These mechanisms are relevant to surface operations, where pilots must alternate between inside-the-cockpit tasks (clearances, FMS updates, checklists) and external scanning.
2.4. Luminance-dependent colour perception
In low illumination, spectral sensitivity shifts, altering relative brightness and colour salience (the Purkinje shift), and affecting conspicuity unless supported by luminance and contrast [Reference Wyszecki and Stiles14]. Because taxi and runway crossing frequently occur at night or in reduced visibility, the interaction of colour, luminance and contrast matters for both markings and lighting.
2.5. Shape-based perception and enclosure effects
Geometric shape influences visual attention through pre-attentive processing mechanisms. Rounded and enclosed shapes tend to guide visual attention inward, supporting holistic perception and rapid figure–ground separation, whereas pointed or angular shapes introduce directional cues that project attention outward and increase visual search demands [Reference Ware15]. In high-workload environments, such as taxi and runway crossing, shapes that minimise orientation dependence and visual fragmentation are more likely to be detected and interpreted rapidly. Circular or smoothly enclosed forms are therefore perceptually robust across viewing angles and partial occlusion, while shapes with sharp vertices may require greater attentional resources to decode [Reference Goldstein16]. The widespread use of circular enclosures in regulatory signage across transport domains reflects these principles, not as a design preference, but as an adaptation to fundamental characteristics of human visual processing under time pressure.
3.0 Methodology
3.1. Design and ethics
We conducted an anonymous, cross-sectional online survey to capture pilots’ reported perception and use of aerodrome markings, signs and lighting during ground operations. Participation was voluntary and respondents provided informed consent. No identifying personal data were collected beyond broad experience categories. The survey was open from 3 January to 8 June 2026. Of 107 responses received, two did not give consent and were excluded from all analyses, giving an analysed sample of 105. The survey items are listed in the Appendix.
3.2. Participants
A total of
 $N=105$
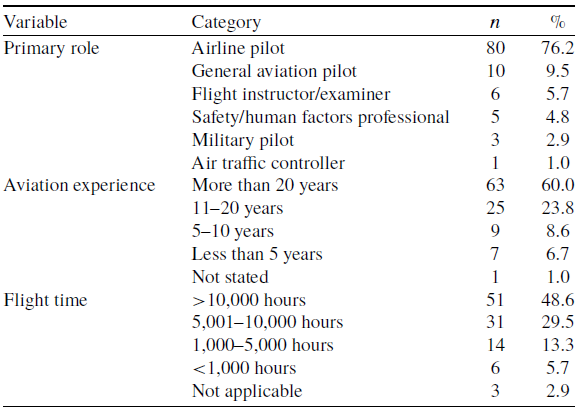
responses were analysed. Most respondents were airline pilots (76.2%), and 78.1% reported more than 5,000 flight hours (Table 1). The sample therefore reflects high-experience operational perspectives while including instructors and safety/HF professionals.
3.3. Instrument
The instrument contained 23 Likert-scale statements (1 = strongly disagree to 5 = strongly agree), grouped under: (i) ground-operations demand and visibility, (ii) shape/text perception and omission under pressure, (iii) colour salience, (iv) aerodrome lighting colour recognition and (v) self-reported hesitation/confusion and perceived RI relevance. Items were designed to be operationally concrete (e.g. runway holding position markings; stop bars; taxiway centreline/edge lights) and aligned with standardised visual aids described in guidance [4, 5].
3.4. Analysis
We report descriptive statistics (mean, standard deviation and proportion agreeing: 4–5). Associations were explored using Spearman rank correlation. The analysis avoids causal language and does not claim demonstrated safety improvement.
4.0 Results
4.1. Participant characteristics
Participant characteristics (
 $N=105$
)

Table 1. Long description
The table presents participant characteristics in an aviation study, focusing on primary roles, aviation experience, and flight time. It has three columns: Variable, Category, n, and Percentages are of total respondents. The table includes data for 105 participants. The primary role categories are Airline pilot, General aviation pilot, Flight instructor/examiner, Safety/human factors professional, Military pilot, and Air traffic controller. The aviation experience categories are More than 20 years, 11-20 years, 5-10 years, Less than 5 years, and Not stated. The flight time categories are 10,000 hours, 5,001-10,000 hours, 1,000-5,000 hours, less than 1,000 hours, and Not applicable. Notable trends include a high percentage of airline pilots (76.2%) and participants with more than 20 years of aviation experience (60.0%). Additionally, a significant portion of participants have accumulated more than 10,000 flight hours (48.6%).
Percentages are of total respondents (
 $N=105$
) and may not sum to 100 owing to rounding.
4.2. Perceived salience of colour, lighting and shape/text cues
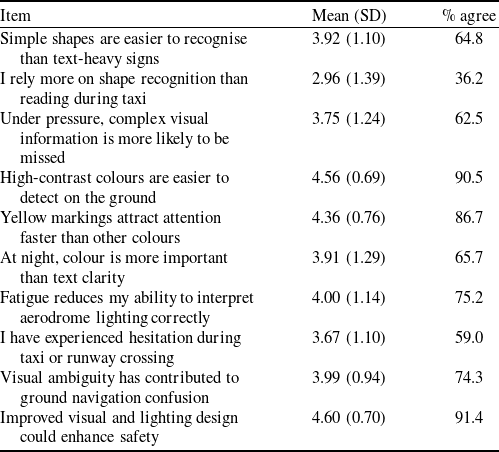
Table 2 summarises selected items most relevant to the research questions. Respondents strongly endorsed the role of high-contrast colours in rapid detection (90.5% agreement) and reported that yellow markings attract attention faster than other colours (86.7% agreement). Respondents also strongly agreed that improved visual and lighting design could enhance safety (91.4% agreement).
Selected survey items: mean (sd) on a 1–5 scale and percentage agreeing (4–5)

Table 2. Long description
A table with 11 rows and 3 columns. The columns are labeled ‘Item’, ‘Mean (SD)’, and ‘% agree’. The rows list various survey items related to aerodrome signage, markings, lighting, workload, and safety experience, along with their mean scores and standard deviations, and the percentage of respondents who agreed with each item. Row 1: Simple shapes are easier to recognise than text-heavy signs, Mean (SD) 3.92 (1.10), % agree 64.8. Row 2: I rely more on shape recognition than reading during taxi, Mean (SD) 2.96 (1.39), % agree 36.2. Row 3: Under pressure, complex visual information is more likely to be missed, Mean (SD) 3.75 (1.24), % agree 62.5. Row 4: High-contrast colours are easier to detect on the ground, Mean (SD) 4.56 (0.69), % agree 90.5. Row 5: Yellow markings attract attention faster than other colours, Mean (SD) 4.36 (0.76), % agree 86.7. Row 6: At night, colour is more important than text clarity, Mean (SD) 3.91 (1.29), % agree 65.7. Row 7: Fatigue reduces my ability to interpret aerodrome lighting correctly, Mean (SD) 4.00 (1.14), % agree 75.2. Row 8: I have experienced hesitation during taxi or runway crossing, Mean (SD) 3.67 (1.10), % agree 59.0. Row 9: Visual ambiguity has contributed to ground navigation confusion, Mean (SD) 3.99 (0.94), % agree 74.3. Row 10: Improved visual and lighting design could enhance safety, Mean (SD) 4.60 (0.70), % agree 91.4.
SD = standard deviation. Agreement is the proportion of responses scored 4 or 5.
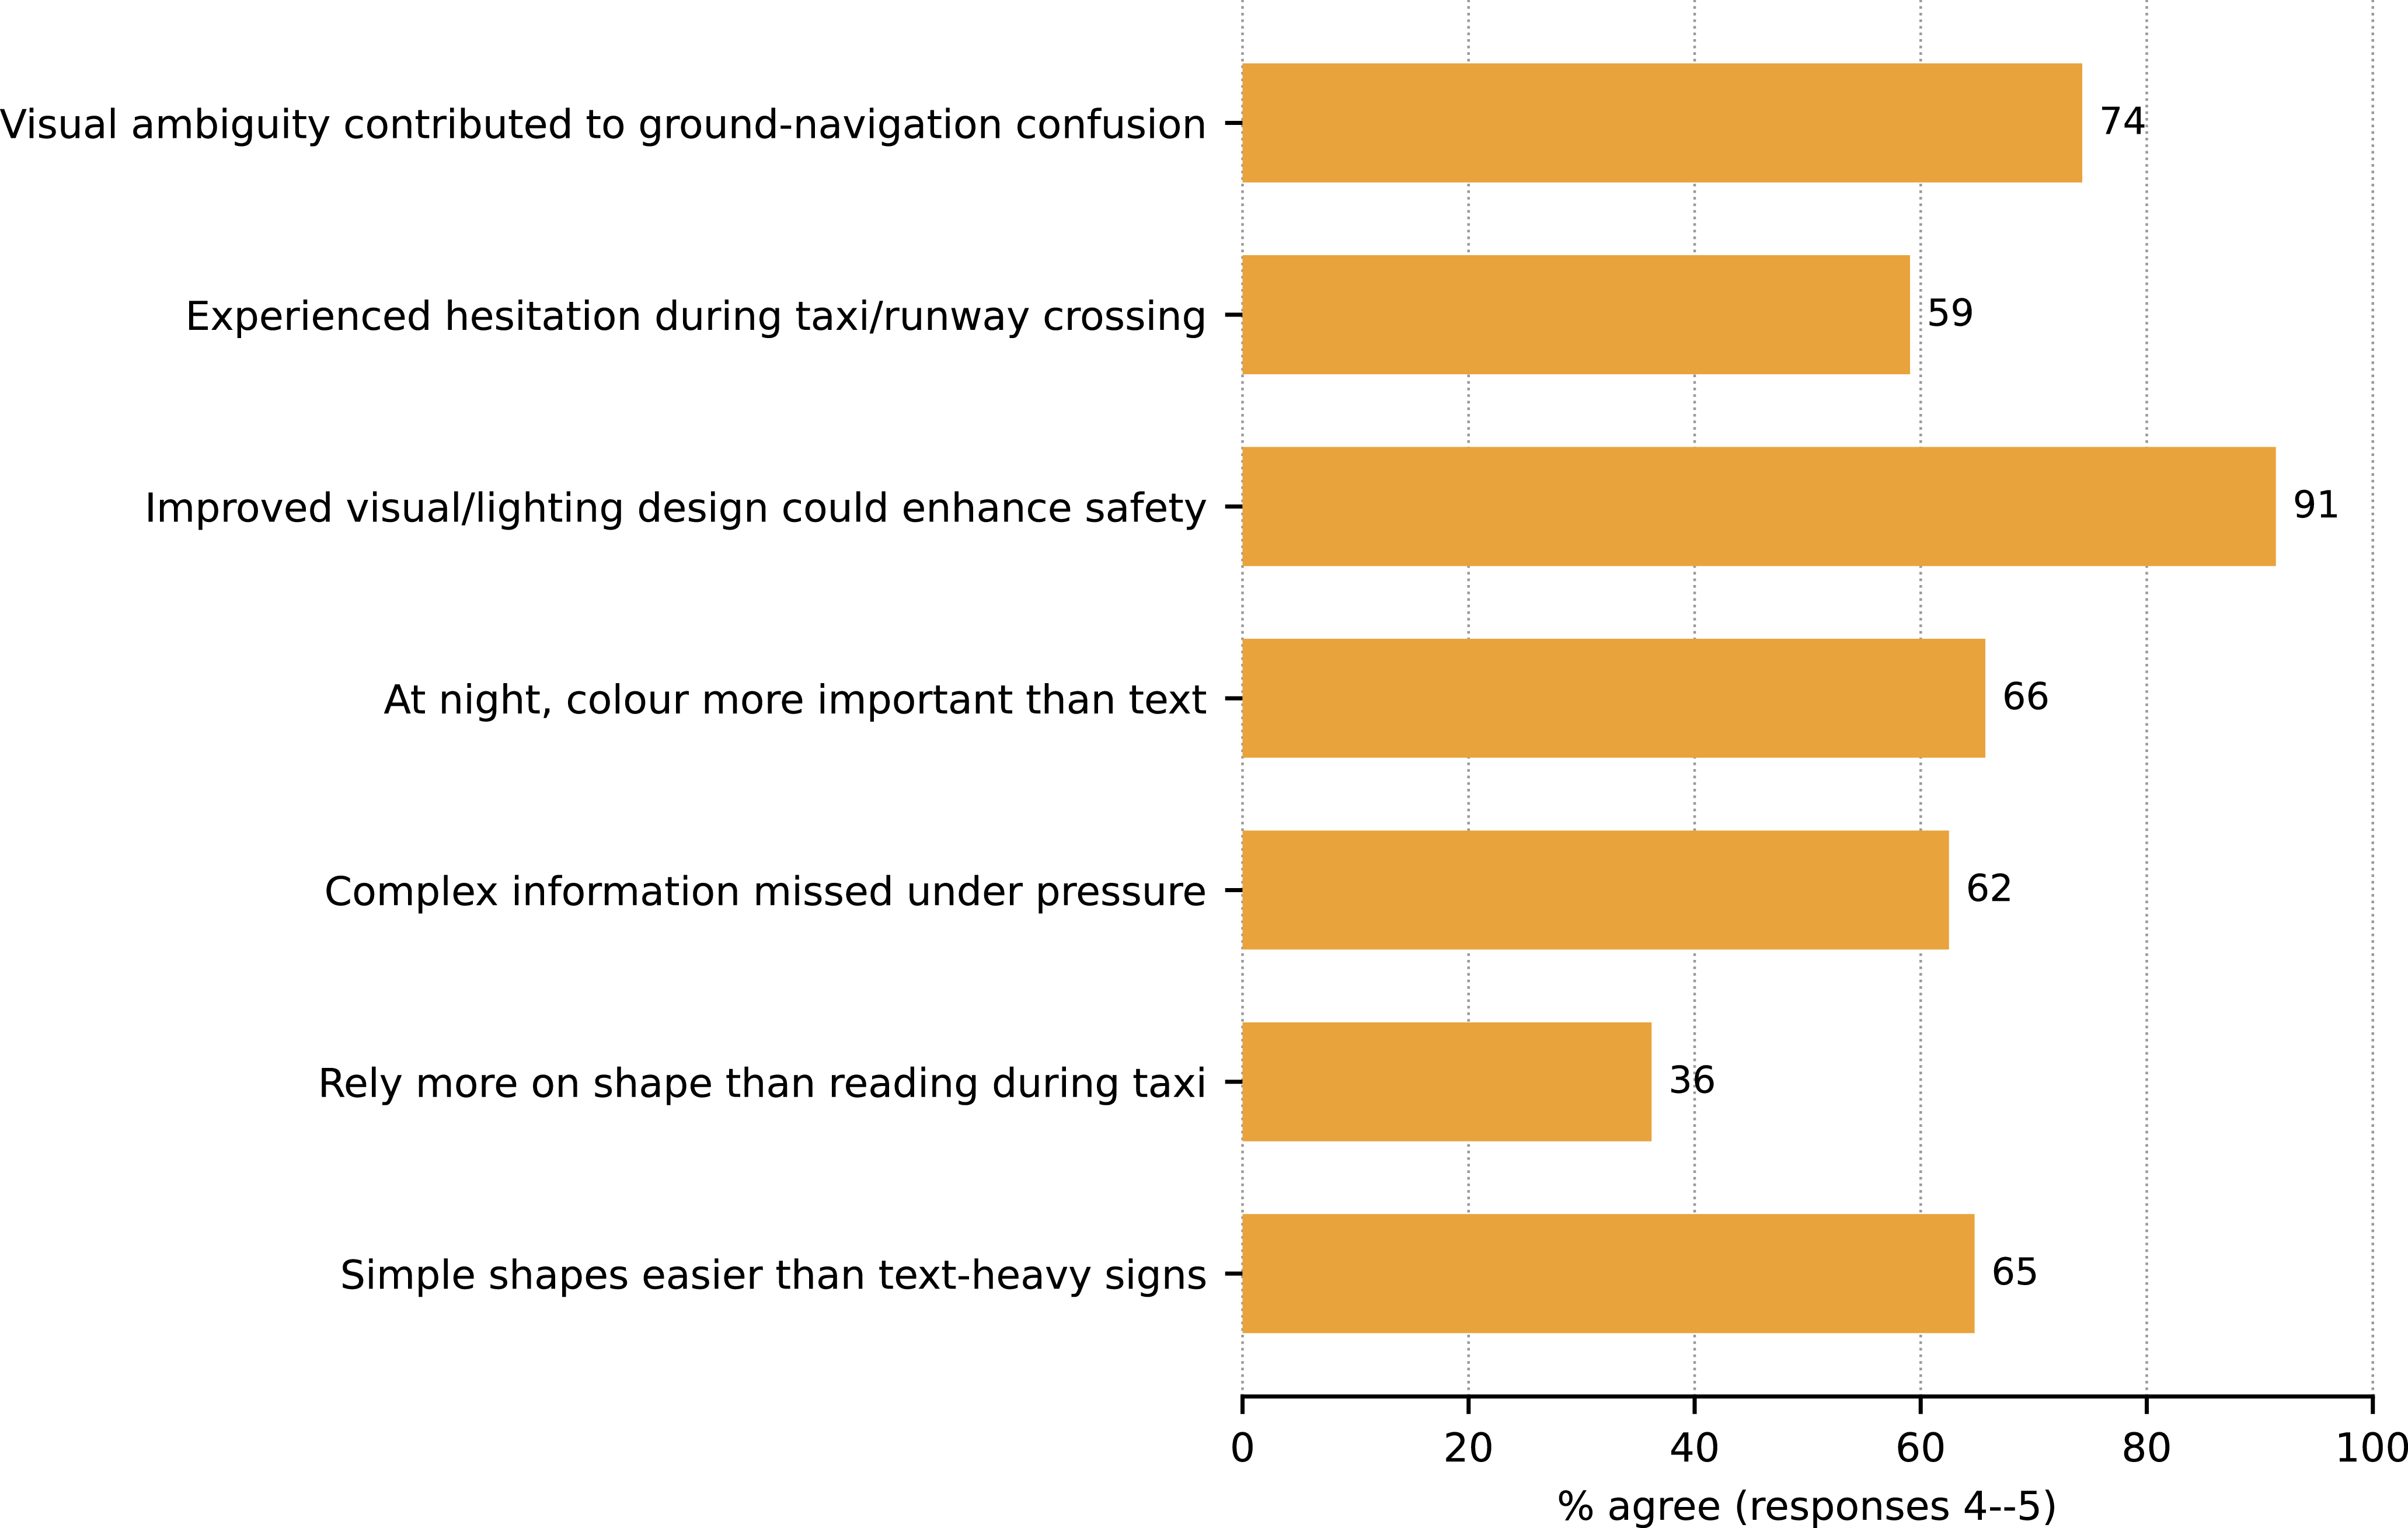
Agreement rates (responses 4–5) for selected survey items relating to aerodrome signage, markings, lighting, workload and safety experience.

While simple shapes were rated as easier to recognise than text-heavy signs (64.8% agreement), respondents did not generally report relying more on shape recognition than reading during taxi (36.2% agreement). This suggests that in nominal conditions pilots prefer explicit textual information, but still value shape/colour features as supportive cues – particularly as workload rises.
4.3. Workload-related perceptions and reported hesitation/confusion
Respondents frequently endorsed that ground operations become demanding under time pressure and that low visibility affects rapid interpretation. Self-reported hesitation during taxi or runway crossing had a mean of 3.67 (59.0% agreement), and agreement that visual ambiguity contributed to ground navigation confusion was high (mean 3.99; 74.3% agreement).
Exploratory association between ‘complex visual information is missed under pressure’ and ‘visual ambiguity contributed to confusion’ (Likert 1–5).

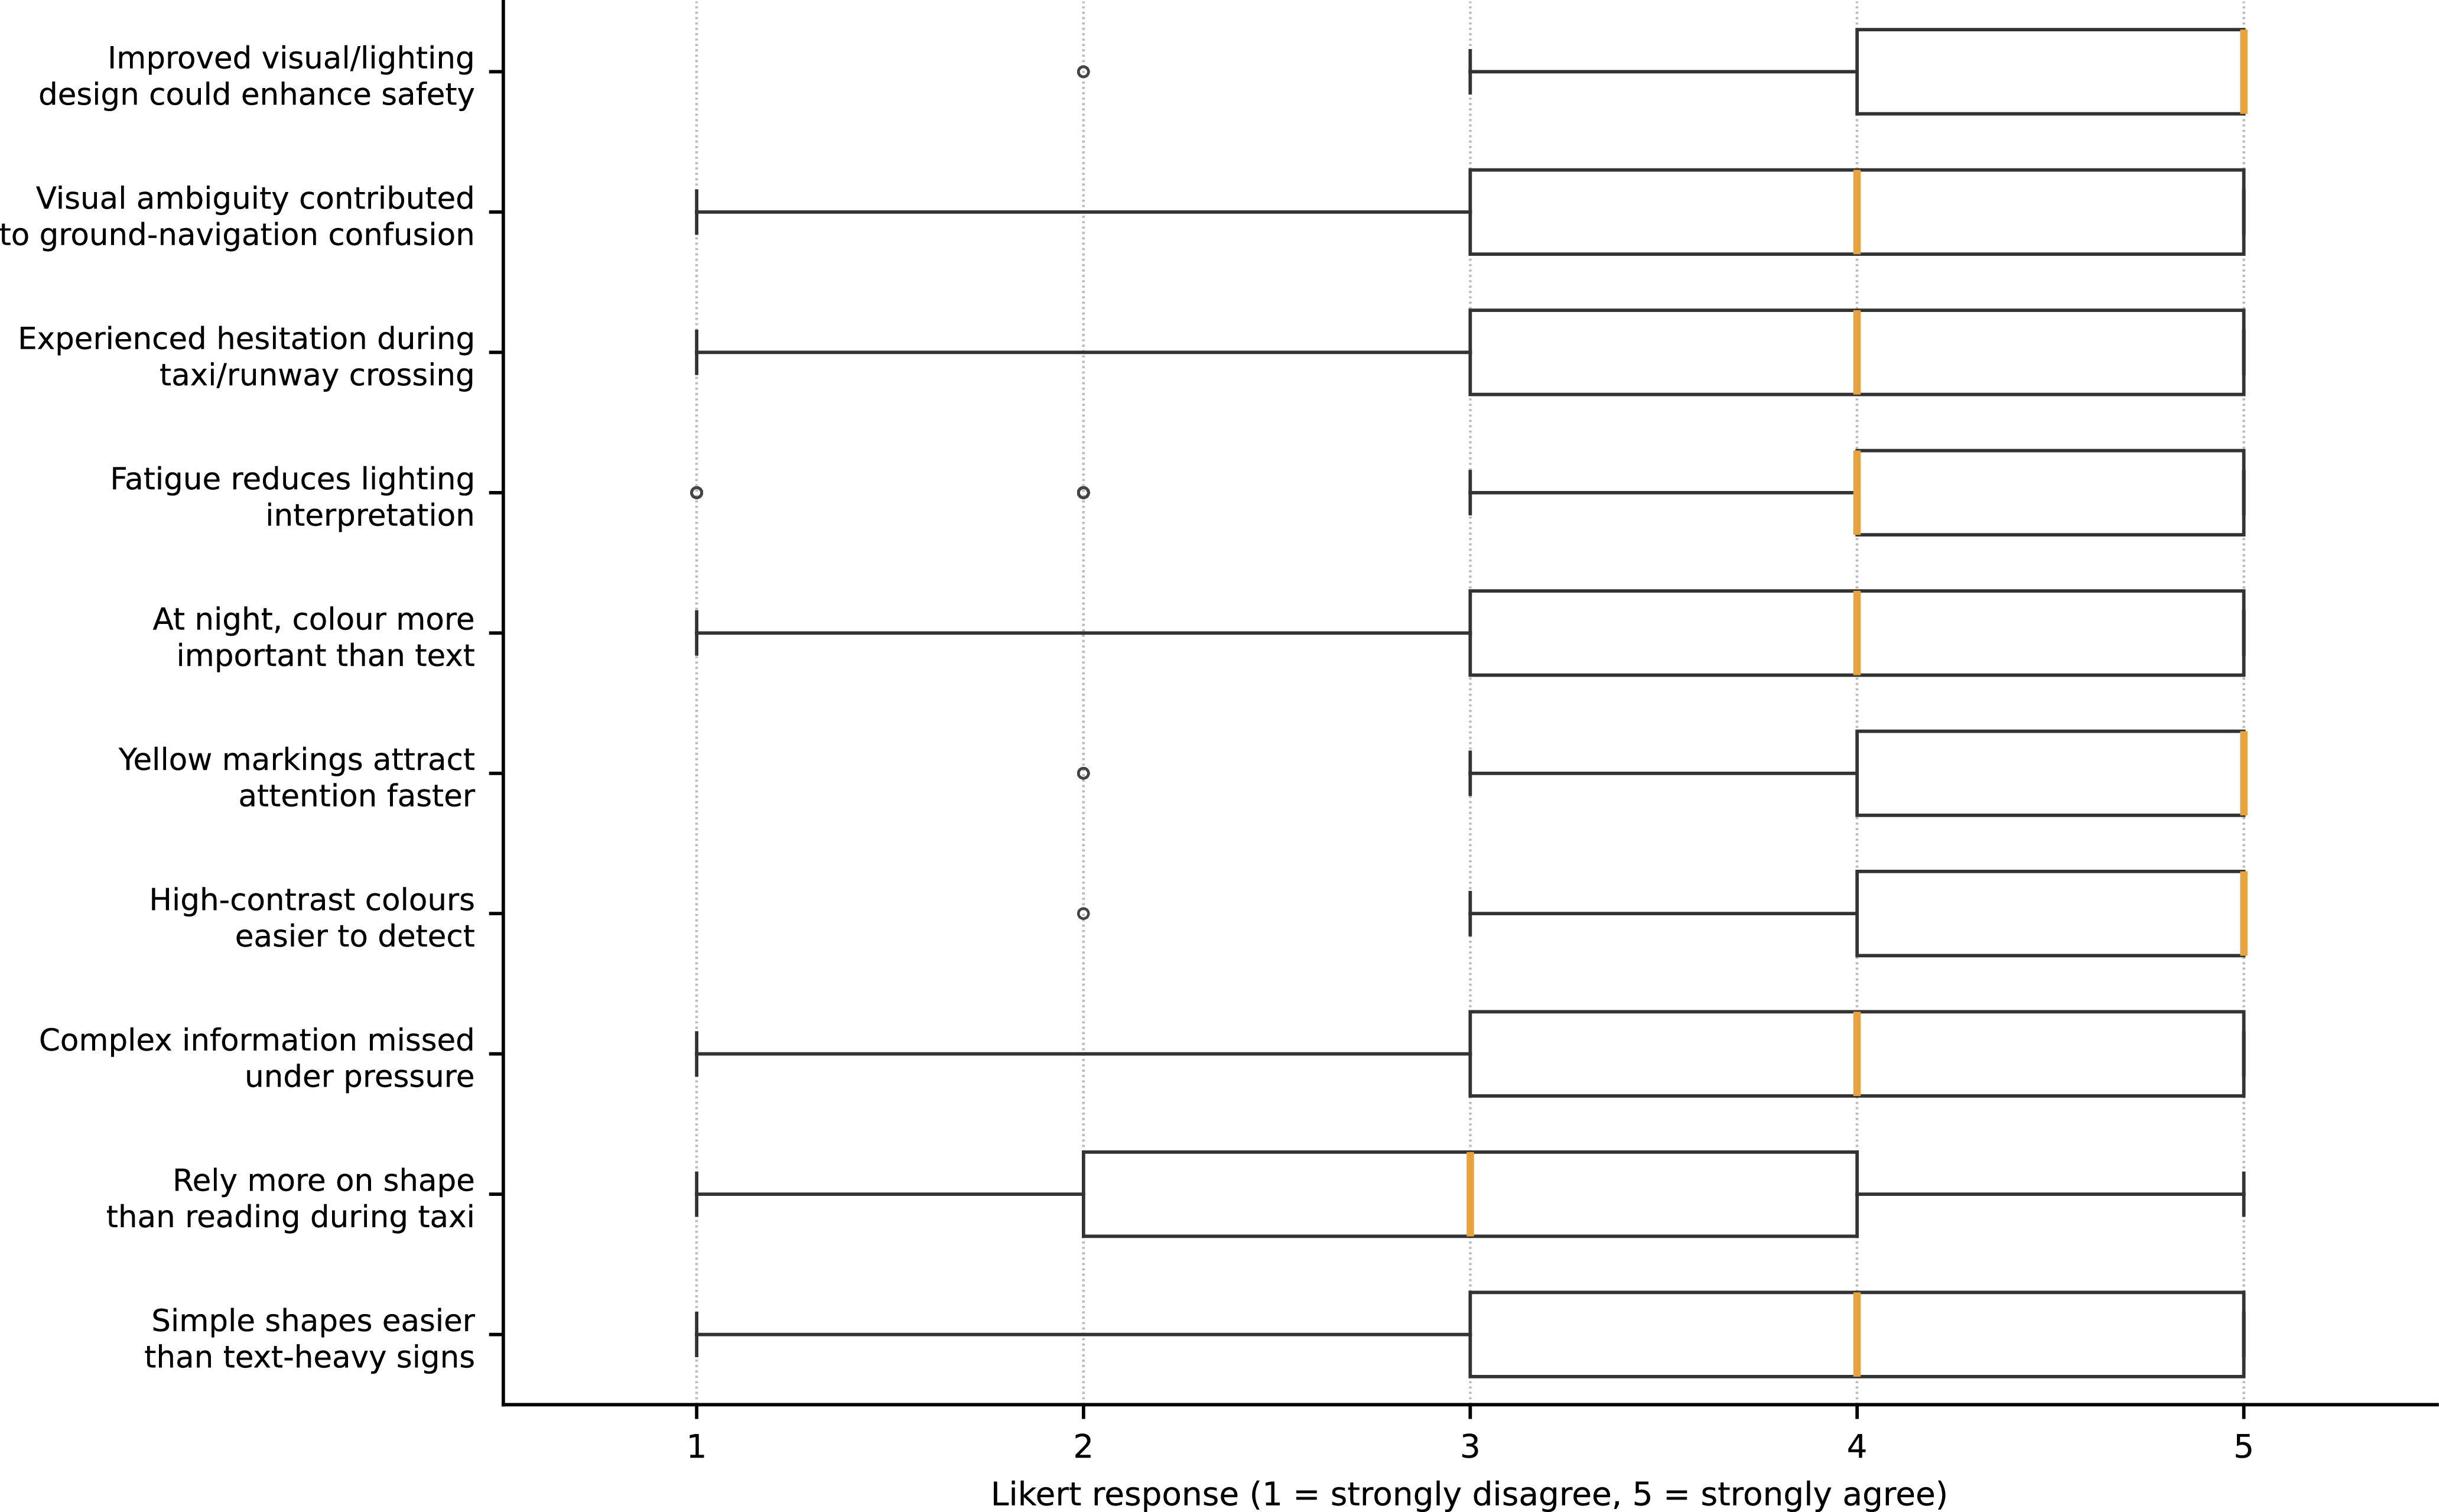
Agreement rates for selected items are given in Figure 1. A representative association is shown in Figure 2: higher agreement that complex information is missed under pressure corresponds to higher agreement that visual ambiguity has contributed to confusion. Box plots for selected Likert-scale items are given in Figure 3, showing median, interquartile range, response spread and possible outliers.
4.4. Exploratory correlations
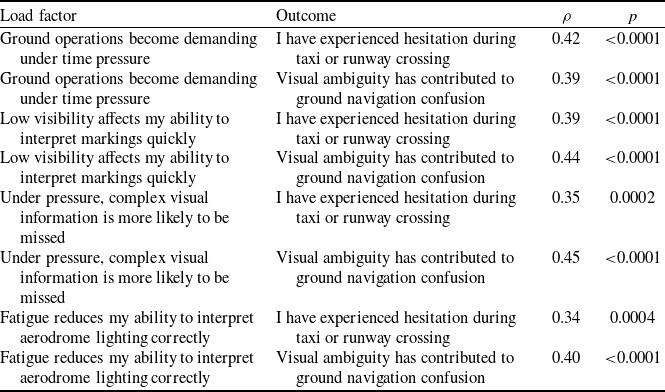
To address RQ3, we examined correlations between workload-related items (time pressure, low visibility, fatigue and complex information missed under pressure) and two outcome items (hesitation; confusion due to ambiguity). All tested associations were positive and moderate (Spearman
 $\rho {\approx}$
0.34–0.45), with
 $p\lt 0.001$
(Table 3). This pattern is consistent with a workload-resilience interpretation: as perceived cognitive load rises, the likelihood of hesitation/confusion rises.
Spearman correlations between workload-related items and self-reported hesitation/confusion (
 $N=105$
)

Table 3. Long description
A table with six rows and four columns. The columns are labeled ‘Load factor’, ‘Outcome’, ‘ρ’, and ‘P’. The rows list different load factors and their corresponding outcomes, along with Spearman rank-order correlation coefficients and p-values. Row 1: Ground operations become demanding under time pressure, I have experienced hesitation during taxi or runway crossing, 0.42, 0.0001. Row 2: Ground operations become demanding under time pressure, Visual ambiguity has contributed to ground navigation confusion, 0.39, 0.0001. Row 3: Low visibility affects my ability to interpret markings quickly, I have experienced hesitation during taxi or runway crossing, 0.39, 0.0001. Row 4: Low visibility affects my ability to interpret markings quickly, Visual ambiguity has contributed to ground navigation confusion, 0.44, 0.0001. Row 5: Under pressure, complex visual information is more likely to be missed, I have experienced hesitation during taxi or runway crossing, 0.35, 0.0002. Row 6: Under pressure, complex visual information is more likely to be missed, Visual ambiguity has contributed to ground navigation confusion, 0.45, 0.0001. Row 7: Fatigue reduces my ability to interpret aerodrome lighting correctly, I have experienced hesitation during taxi or runway crossing, 0.34, 0.0004. Row 8: Fatigue reduces my ability to interpret aerodrome lighting correctly, Visual ambiguity has contributed to ground navigation confusion, 0.40, 0.0001.
 $\rho$
= Spearman rank-order correlation coefficient.
Box plots of selected Likert-scale responses for aerodrome signage, marking, lighting and workload-related perception items. Boxes represent the interquartile range, centre lines represent medians, whiskers represent the response spread and points indicate possible outliers.

5.0 Discussion
5.1. Interpretation in a human–System frame
The results support RQ1: pilots report that high-contrast colour cues and standard lighting cues are salient and useful during surface operations. The results also support RQ2–RQ3: perceived operational load (time pressure, low visibility and fatigue) is associated with self-reported hesitation and confusion.
These findings align with established attention and working-memory models: as task demand rises, attention narrows and information requiring serial processing (e.g. reading, multi-element interpretation) becomes more vulnerable to omission [Reference Wickens12, Reference Baddeley13]. In this frame, late or missed recognition of a sign/marking is not simply ‘pilot error’, but an expected interaction between cue design, environment and cognitive constraints – precisely the interaction runway-safety programmes aim to manage [1, 2].
5.2. Implications for aerodrome design, standards and operations
This study does not claim that modifying a sign or marking will prove a reduction in RIs. However, it suggests three practical directions consistent with standards and runway-safety guidance:
-
1. Workload-resilient conspicuity: prioritise high-contrast, luminance-supported cues for hold/stop information, especially where visibility is variable (e.g. stop bars, runway guard lights, reflective enhancements) [4, 5,17].
-
2. Redundancy across modalities: combine markings, signs and lighting so that a single missed cue does not remove the constraint (consistent with layered-defence logic in runway-safety guidance) [1, 2].
-
3. Human-centred validation during change: when layout or signage is altered (e.g. construction works), validate recognisability under realistic workload and lighting conditions using runway-safety team processes [18].
5.3. Relation to existing RI and surface-operations literature
Prior work has reported that pilots frequently cite aerodrome signs and surface complexity as contributors in RI contexts [6, Reference Lewis7, Reference Chang and Wong19]. The present survey extends that literature by quantifying how pilots link cue attributes (colour/contrast, shape/text) to workload-related vulnerability and to hesitation/confusion, providing a bridge between standards and cognitive mechanisms.
6.0 Limitations
This study is based on self-reports and a convenience sample; therefore, it is subject to recall bias, selection bias and common-method variance. The Likert items capture perceived experience rather than objective detection performance. We did not manipulate luminance, taxi complexity or air traffic control (ATC) loading experimentally, and the correlations reported do not establish causation. These limitations are typical of exploratory survey research and motivate the future work outlined below.
7.0 Future research agenda
To avoid non-actionable recommendations, a staged research programme is proposed, moving from basic science to operational validation:
-
1. Controlled perception studies: laboratory and simulator experiments varying luminance/contrast, sign density and time pressure, with eye-tracking to measure detection latency and missed cues.
-
2. Scenario-based simulator validation: high-fidelity taxi/runway-crossing scenarios (including construction, reroutes and mixed ATC load) comparing baseline versus modified cue designs, measuring navigation errors, stop-bar compliance and time-to-detect hold points.
-
3. Field evaluation and safety cases: operational trials at selected aerodromes with safety risk management (SRM) and runway-safety team oversight, using occurrence reports and (where available) surface surveillance or flight data monitoring (FDM) measures.
-
4. Standards feedback: translate validated findings into implementation guidance for Annex 14/Doc 9157 and national sign standards, focusing on workload-resilient conspicuity rather than increased information density.
8.0 Conclusion
Aerodrome signs, markings and lighting are a safety interface that must remain effective under cognitive load. In an exploratory survey of 105 aviation professionals, respondents strongly endorsed the salience of high-contrast colour cues and standard lighting cues, and strongly agreed that improved visual and lighting design could enhance safety. Workload-related perceptions (time pressure, low visibility, fatigue) showed moderate positive associations with self-reported hesitation and confusion during taxi/runway crossing. These findings are presented as empirical, test-generating insights that support human-centred validation of aerodrome visual aids under realistic operational demand.
Acknowledgements
The author thanks all survey participants for contributing operational insights to safety research.
Disclaimer
This paper is for research and training discussion. It does not provide operational instructions and does not supersede company SOPs, aerodrome procedures or regulatory requirements.
Appendix
Survey items
The survey used 23 Likert-scale items (1 = strongly disagree; 5 = strongly agree). Items were grouped as follows.
-
Ground operations awareness: (1) confident identifying runway holding position markings; (2) taxiway signage is easy to interpret at usual airports; (3) ground operations become demanding under time pressure; (4) low visibility affects ability to interpret markings quickly.
-
Shape-based visual perception: (5) simple shapes are easier to recognise than text-heavy signs; (6) rounded shapes are detected faster than complex rectangular markings; (7) rely more on shape recognition than reading during taxi; (8) under pressure, complex visual information is more likely to be missed.
-
Colour-based visual perception: (9) high-contrast colours are easier to detect on the ground; (10) yellow markings attract attention faster than other colours; (11) colour helps distinguish runway from taxiway; (12) at night, colour is more important than text clarity.
-
Aerodrome lighting colours: (13) blue taxiway edge lights are immediately recognisable; (14) green taxiway centreline lights are easy to follow; (15) white runway lights are clearly distinguishable from taxiway lights; (16) red stop-bar lights clearly communicate STOP; (17) red stop-bar lights immediately attract attention; (18) lighting colour reduces cognitive workload during taxi; (19) fatigue reduces ability to interpret aerodrome lighting correctly.
-
Safety experience: (20) experienced hesitation during taxi or runway crossing; (21) visual ambiguity contributed to ground navigation confusion; (22) visual perception plays a significant role in runway incursion risk; (23) improved visual and lighting design could enhance safety.
 N=105

 N=105