In February 1929 the New York Stock Exchange decided to increase its membership, fixed at 1,100 since 1879, by 25 percent. This expansion occurred when business was booming and the real price of a seat on the exchange was the highest it has ever been. In this exuberant era, the NYSE was under extraordinary pressure. Members found it increasingly difficult to handle the rising flow of orders. At peak times, there was a scramble on the floor to find counterparties and process trades; and some observers claimed that bid-ask spreads widened. These problems contributed to the slow erosion of the NYSE's share of the national equity market. Although the membership had rejected previous recommendations by the NYSE's leadership to increase seats, this time they listened and voted to accept a quarter-seat dividend to expand capacity and shore up the exchange's dominant position.
Drawing upon newspaper accounts and archival materials from the NYSE, we chronicle the NYSE's internal struggle over how to meet the soaring demand for its services. The management's proposed solution of a quarter-seat dividend to each member convinced a majority of brokers that it was the best way to expand the exchange's capacity. These dividends were then traded to create whole new seats that raised the total membership from 1,100 to 1,375. We conduct event studies of the failed effort to expand the exchange in 1925 and the successful one in 1928/29. When the news of a possible seat dividend reached the membership in late 1928, seat prices rose. We estimate that there was approximately a 20 percent abnormal return, implying that the increased number of seats was anticipated to make the exchange more competitive, thereby augmenting its aggregate value (the number of seats times the price of a seat), rather than leaving it constant.
The effects of order surges on NYSE-listed stocks' bid-ask spreads are examined using a panel of individual stocks drawn from high and low volume days both before and after the increase in the number of seats. In 1928, when volume climbed and the exchange was at capacity, the bid-ask spread became very sensitive to the total number of shares traded on the floor and the dispersion of orders at the posts across the floor. After the increase in the number of seats, these effects were muted and customers' costs did not jump. The brokers thus correctly anticipated that the increased attractiveness to customers of the exchange from the seat-dividend would help to maintain the NYSE's dominant position.
This increased capacity permitted the NYSE to absorb more easily orders on the high volume days that punctuated every year. However, these additional seats did not provide enough reserve capacity for the exchange to manage the volume on the truly rare days of a panic, such as occurred in October 1929. Panic driven surges in orders have persistently swamped exchanges throughout the twentieth century, leading the ticker to run late, delaying the delivery, execution, and settlement of orders, no matter the extent of technological innovations
THE NYSE FACES THE COMPETITION
The current struggle by national stock exchanges for world domination has its origins in the competition among American exchanges in the 1920s, when technology and greater public participation forced changes in the markets. While the NYSE was the dominant exchange, its position was slowly slipping away as volume and new issues moved to other venues. The dramatic expansion of the NYSE in 1928/29 was perhaps its most important structural change prior to its 2006 transformation into a publicly owned company and its merger with Archipelago. Both responses to competition led to a rapid rise in the price of a seat on the exchange, reflecting the market's favorable assessment.
Our investigation of this earlier structural transformation and its effect on the competitiveness of the exchange is facilitated by newly collected data from the archives of the New York Stock exchange for all seat prices from 1879 to 1971. Three volumes of the New York Stock Exchange's Committee on Admissions registered all transfers of membership. The recorded transfers cover the period from 28 November 1879 to 8 January 1880, followed by a gap, and then from 27 December 1883 to 28 June 1971. The exact dates of the transfers are not provided until January 1935. Until that time, all trades during a week were reported as of the end of the week. The supply of seats has been relatively constant over time. Except for the 275-seat expansion in 1929, there was only an increase of 70 seats in 1879 and a reduction of nine in 1953. Seats were traded in a market operated by the Secretary of the NYSE, who posted the current bid and ask prices.1
There were private sales of seats to business associates and relatives that were recorded by the Secretary, often at prices well below the market prices. Of the 4,344 transactions between 1883 and 1940, 775, or just under 18 percent, were private sales. These trades were roughly evenly dispersed over time. We excluded these trades from our study, as they represented transfers of property to family members or partners and not market conditions.
Nominal seat prices from 1883 to 1971 are graphed in Figure 1.2
Every new broker, taking advantage of the increased number of seats, bought a quarter seat from each of four sellers. The price paid by a new broker is equal to the prices of the four quarter seats, which were recorded when he exchanged these rights for a whole seat. The prices for private sales were excluded as these were usually far below market prices.
Although in late 1968 and early 1969 seat prices hit $525,000, their real value was considerably below the 1929 peak. A seat priced at $625,000 in 1929 had a real value of $1.3 million measured by either the CPI or the GDP deflator in 1969.

FIGURE 1 PRICE OF SEATS ON THE NEW YORK STOCK EXCHANGE, 1883–1971
Seats on an exchange are capital assets whose prices reflect stockbrokers' expected future profits from the special access offered to them by a seat on the exchange. Until the NYSE became a publicly owned company in 2006, the ownership of the exchange was vested with its members. The member-owners determined the number of seats; and before the advent of the New Deal legislation governing the securities exchanges, they set the rules of the exchange. The value of their seats, which they zealously guarded, was affected by the volume of activity on the exchange and the degree of competition among traders on the exchange and between the exchange and the rest of the market.
By the mid-1920s there were many reasons for brokers on the NYSE to be pleased. More firms were listing on the exchange and turnover was rising. The Commercial and Financial Chronicle and the Wall Street Journal gleefully reported new trading records.4
Commercial and Financial Chronicle, 31 October 1925; and the Wall Street Journal, 29 October 1925.
NYSE, Yearbook, 1930.
NYSE Statistics Archive, http://www.nyse.com.

FIGURE 2 MONTHLY NYSE STOCK SALES, 1920–1930
Behind this rising flow of orders was an increase in the social and geographic span of the market.7
Another factor contributing to the rising demand for the services of the NYSE was the demise of the Consolidated Exchange. Founded in 1885, the Consolidated traded its own list of securities and many NYSE-listed securities, commodities, and petroleum futures. Unlike the restrictive NYSE, membership was available for “a few hundred dollars, with no questions asked.” The Consolidated grew rapidly after the panic of 1907. Trading reached a peak in 1922, after which the Consolidated was wounded by a series of brokerage failures that implicated its president, William S. Silkworth. The scandal was fatal to the Consolidated, which quickly lost business to the NYSE. Its closure was announced in 1926, but it did not finally wind down its operations until two years later. See Sobel, History.
NYSE, Yearbook, 1928–1929.
Although more trading boosted brokers' profits, it placed new strains on the operation of the exchange and the ability of brokers to deliver their services to their customers in a timely fashion. When volume was high, the clerical work of entering hundreds of orders in their proper sequence could not keep up.9
New York Herald, 26 January 1929.
Settlements of these transactions have congested the machinery of the Stock Exchange and all hands have been called upon to work overtime in clearing the slates each day. All brokers and member firms have been called upon to make their deliveries as early as possible, for the purpose of speeding up the machinery, and banking institutions also have been requested to assist the Stock Clearing Corporation in every possible way.10
Commercial and Financial Chronicle, 31 October 1925.
While these problems affected the timely delivery of cash and certificates, the rising trend and peak volume days also increased the cost of transactions as individual brokers found it harder to find counterparties for their orders on the floor. With a fixed number of brokers, the market's capacity was not easily altered. When volume continued to climb in the second half of the 1920s, problems became more severe, and there were public complaints about the declining performance of the exchange. The NYSE conceded that there were difficulties because of “poor executions and the limited capacity of our market.”11
NYSE, “Memorandum on Increasing Stock Exchange Memberships,” n.d.
New York Times, 5 November 1925.
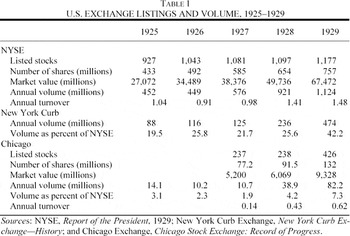
At a time when turnover was rising, the increase in new issues placed even more stress on the machinery of the NYSE. Yet, most new issues appeared on other exchanges. The exchange's relatively tough listing standards limited new listings by the “high tech” firms of the day, which were more likely to appear on the New York Curb market and the regional exchanges. Although data on other exchanges are scarce for this period, Table 1 reveals the dimensions of the challenge faced by the NYSE. Between 1927 and 1929, the NYSE's listings rose by over 12 percent, and annual turnover jumped from about 1.0 to 1.5. Nevertheless, its competitors grew faster. The New York Curb market was the NYSE's largest rival but it also complemented the NYSE by taking listings that were below the NYSE's standards. Many more new issues were listed on the Curb, and its volume rose faster than the volume on the NYSE. Chicago was the largest regional exchange, but did not participate in the boom until 1928. It had only 237 stocks listed on 1 January 1927 and 238 a year later. But Chicago reasserted itself; by 1 January 1929, it had 426 issues. Annual turnover, which had been a mere 0.14 in 1927, rose to 0.62 in 1929.

New exchanges also opened to accommodate the growing demand for new issues. On 4 June 1928 the Los Angeles exchange created its own Curb to expand capacity to handle new stocks and securities that did not meet the exchange's requirements. The parent exchange saw its total volume increase from 27.1 million in 1927 to 49.4 million in 1928. Total volume for both Los Angeles exchanges reached 67.8 million in 1928, or 7.3 percent of the NYSE's volume.13
Commercial and Financial Chronicle, 16 March 1929.
Commercial and Financial Chronicle, 23 March 1929.
Arnold, Hersch, Mulerin, and Netter, “Merging Markets.”
Although volume data for many exchanges are sketchy, the problems of the NYSE can be seen by comparing the aggregate values of American exchanges as measured by the prices of their seats. Given the forward-looking nature of asset prices, the price of seats assesses the future prospects of the exchanges. The bull market of the late 1920s led to a general rise in the value of American stock exchanges. The aggregate value of the U.S. exchanges soared from $220 million in January 1927 to $372 million a year later, climbing to a peak of $912 million in September 1929 before collapsing. Although the NYSE increased in value from $192 to $687 million from January 1927 to September 1929, it steadily lost “market share” as seen in Figure 3. Averaging 89 percent of all exchanges' value in 1927, the NYSE saw its share of aggregate value drop to an average of 76 percent in 1929. It is no surprise that many NYSE brokers were alarmed as they watched changing seat prices, which meant that the New York Curb Exchange increased its share from 7 to 13 percent and the regional exchanges from 5 to 10 percent over the same period.

FIGURE 3 THE RELATIVE SHARES OF THE AGGREGATE VALUE OF U.S. STOCK EXCHANGES, 1927–1929
While individual NYSE brokers were enjoying higher profits from the boom in volume, the erosion of the NYSE's market share represented a serious threat to their future earnings. The profitability of the NYSE derived from its dominant position. Order processing costs are a decreasing function of volume, and higher volumes will produce shorter holding periods and lower bid-ask spreads. If one market has greater volume, its cost advantage will attract more volume and lead to consolidation in a single market. Liquidity thus attracts more liquidity, and this positive trading externality should result in one trading venue.16
Madhavan, “Market Microstructure.”
Early on, the NYSE responded to the rising inflow of orders by raising commissions. On 24 October 1924 the NYSE significantly raised its minimum commission per hundred shares.17
Beginning on 8 May 1919, the minimum commission was $15 per 100 shares for stocks priced from $10 to $124 7/8 and $20 for shares over $125. After 30 October 1924, the minimum for shares priced from $10 to $99 7/8 was $12.50 plus 0.1 percent of the amount traded rounded down to the nearest $2.50. Thus, if a share cost $80 (the average price of a stock on the NYSE in 1928–1929 was approximately $80), the price of a 100 share trade would be $20. Trades of shares ranging from $100 to $199 7/8 cost $25. See Jones, “Century.”
In 1928 several odd-lot houses raised their minimum commissions. “Because of pressure on small-lot business, 75 of the larger firms yesterday advanced their minimum commissions to $5 for each transaction.” See Commercial and Financial Chronicle, 16 February 1928. These firms accounted for only a modest share of the securities markets.
THE CAPACITY CONSTRAINT ON THE FLOOR OF THE NYSE
How exactly did a higher inflow of orders, especially on peak volume days, reduce the liquidity of the NYSE and what effect did it have on bid-ask spreads? Brokers on the floor of the exchange were identified by their principal function: specialist, commission broker, odd-lot broker, two-dollar broker, and floor broker. An incoming order for the purchase or sale of a specific stock arrived in the hands of a commission broker who took the order to the post on the floor assigned to that specific stock. At the post, a specialist (trading on his own account or as an agent for another broker) had an affirmative obligation to maintain a continuous market and to post bid and ask prices for the stock. The commission broker could trade with the specialist at the posted spread or with any other broker at or within the spread. The greater the number of counterparties faced by the commission broker, the increased competition and hence liquidity would press down the bid-ask spread.
Other brokers played important roles at the post. If an order were for less than 100 shares, the commission broker would transact with an odd-lot broker who acted as an intermediary on his own account to accumulate and trade shares in round lots.19
In 1922 Meeker claimed that the odd-lot brokers accounted for 25 percent of volume and that their share declined substantially in boom markets. Meeker, Work.
Meeker, Work, p. 101.
The geography of the floor influenced the liquidity of the market. With a fixed number of brokers, if trading were concentrated in a few stocks at a few posts, there would be a large number of potential counterparties for incoming orders, squeezing the bid-ask spread. But if trading were more diffused, spread out among the posts on the floor, then even with the same volume, the market could be much thinner as potential counterparties would be spread out. Bid-ask spreads would widen as brokers would have to scramble from post to post to execute their orders and costs to customers would rise.
Not all 1,100 brokers were on the floor at a given time and, in fact, the maximum number of active brokers was estimated at somewhere between 900 and 1,000. Unfortunately, there is no record of how seats were distributed among the different types of brokers who, with the exception of the specialists, decided how to make use of the seat. The number of seats occupied by specialists (approximately 150) changed slowly.21
Meeker, Work.
Contemporary observers believed that the ability of the exchange to ensure a continuous market was compromised, in part, by the shrinkage in the number of floor traders. Meeker blamed this loss on the New York State stock transfer stamp tax of 1905 and the federal stamp tax, introduced during World War I, both of which fell disproportionately on the floor traders.22
Meeker, Work.
Goldman, Handbook.
Meeker, Work.
E. H. H. Simmons, Report of the President NYSE 1 May 1928 / 1 May 1929, p. 62; and “Memorandum on Increasing Stock Exchange Memberships,” undated, NYSE Archives.
How seriously did rising trend volume and peak surges affect the efficiency of the exchange? If there were real capacity constraints imposed by the fixed number of seats, it should have reduced liquidity and produced a rise in the bid-ask spreads. In this period, the New York Times reported daily closing bid-ask spreads for the NYSE stocks in addition to daily volume, high and low prices for the year, high and low prices for the day, opening and closing prices and the change in price from the previous day. Order-flow problems should have been most severe on peak days, when there was an exceptionally high volume and the orders were diffused among a large number of listed stocks. To capture the effects of this problem, we collected daily data on all stocks from the New York Times for selected days before and after the quarter-seat dividend.
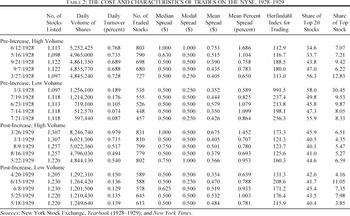
First, to select the days, every day from January to October 1928, when the seat increase was proposed, was sorted by volume. The five peak days (12 June, 16 May, 21 September, 7 September, and 27 March) were selected to capture any congestion. To examine how the exchange handled peak volume after seats were added, every day from March 1929 to August 1929 was sorted by volume.26
The months of November 1928 to February 1929 were omitted because they followed the dividend announcement and preceded the increase in seats. The choice of days for the sample ends in August to eliminate the effects of the crash of 1929.
The key statistics for all 20 days are presented in Table 2. Relative to low volume days, high volume days, measured either by total daily volume or daily turnover, involved a larger number of stocks, although on a given day several hundred listed stocks were not traded. Higher volume for a particular stock should have lowered the spread; but there is no obvious evidence for this effect in the median or modal spread, where one-eighth was the minimum tick. Nor do volumes five times higher seem to lower the mean spread (weighted by sales) or the weighted mean spread as a percentage of the closing price. However, the spreads do seem to be influenced by the distribution of trading. The more concentrated trading was—as measured by the share of sales in the most active stock, the most active 20 stocks, or a Herfindahl index of sales—the lower the spreads. The concentration of brokers at fewer posts, which increased the number of potential counterparties at one location, appears to have reduced bid-ask spreads no matter whether it was a low or high total volume day.

To determine whether peak order flows reduced the liquidity of the NYSE by widening specialists' bid-ask spreads, we employed a standard model of the bid-ask spread.
27For surveys of the literature see Madhavan, “Market Microstructure”; and Stoll, “Friction.”

Specialists have an obligation to accept orders from other brokers and maintain a portfolio of stocks. The bid and ask prices they post are affected by the volume, the number of trades, capitalization, the price of a share, and price volatility.
28See Stoll, “Supply”; Menyak and Paudyal, “Determinants”; and Stoll, “Friction.” It is also argued that the spread serves as compensation for asymmetric information costs for the losses that specialists would have incurred from trades with well-informed traders that are recouped from less-informed traders, which the dealer could not have distinguished. See Easley and O'Hara, “Price”; and Demsetz, “Cost.”
Laux, “Trade Sizes.”
The call loan rates were obtained from the Board of Governors of the Federal Reserve System, Banking and Monetary Statistics.
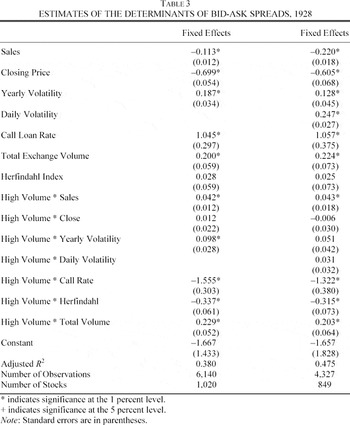
Activity on the whole of the exchange also influenced the bid-ask spread of an individual stock. If the total volume on the exchange rose with a given volume in an individual stock, it put upward pressure on the stock's spread because of the fixed capacity. However, if trading became more concentrated in fewer stocks and thus focused on a few posts, liquidity was enhanced, as brokers were not spread out across the floor of the exchange. We proxy these volume and trading concentration effects by the log of total volume of the exchange, lntotalvolumet and the log of the Herfindahl index of all individual stock sales, lnherfindahlt. We expect these variables to have positive and negative coefficients respectively. It is worth noting that the exchange-wide variables, the total volume and the Herfindahl index, are highly correlated (−0.728) because during the early days of the stock market boom increases in volume were accompanied by trading in a greater number of stocks. Added to the regression to identify the differences between high and low volume days, and thereby highlight the capacity constraint on the machinery of the exchange, were six interaction terms, which indicate how high volume days affected the coefficients on the individual explanatory variables.
For the combined ten high and low days in 1928, we estimated the model using fixed effects for individual stocks to capture some of the individual characteristics of stocks and the omitted variables, notably capitalization.31
We also estimated the equation using OLS. The results were similar and can be found in Davis, Neal and White, “Highest Price.”

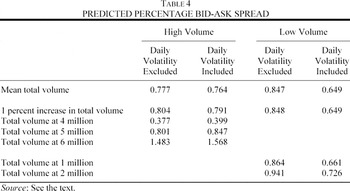
By how much would the bid-ask spread increase if volume jumped? Table 4 provides estimates of the predicted percentage bid-ask spread, where all variables except total volume have their mean values for high and low volume days. The first row shows the predicted values when the total exchange volume was set equal to the sample means.32
These predicted forecasts lie in the range of the bid-ask spread as measured by Jones for Dow-Jones stocks in the 1920s. Jones, “Century.”

The responsiveness of the bid-ask spread reflected the general problems of the exchange in processing and executing orders. The number of brokers on the floor was a hard constraint that translated into higher costs when the floor was swamped with orders. The exchange's leadership saw that higher spreads, slow processing, and rising fails would redirect order flow to other markets. At some point, the position of the NYSE as the most liquid market would begin to decline, undermining its cost advantage and giving competitors the opportunity to become the lowest cost venues. The upward trend in volume and the increased frequency of high volume days also gradually impressed many of the exchange's members with a heightened sense of urgency to expand the NYSE's capacity.
THE QUARTER SEAT DIVIDEND
The capacity of the exchange had been fixed nearly 50 years before. After the May 1869 merger of the NYSE, which had 533 members, with the 354 member Open Board of Brokers and the 173 member Government Bond Department, the number of seats was set at 1,060. The only increase occurred in 1879 when the Governing Committee proposed the sale of 40 new memberships, increasing the total seats to 1,100, to finance the purchase of additional property adjacent to the exchange to ease its physical constraint. The seats were sold to the highest bidders with a minimum price of $10,000. Although 40 more seats would seem unlikely to have had much effect on seat prices, the vote by the membership on the proposal was extremely close, 530 in favor and 510 against.33
The memberships were then sold at prices ranging from $13,500 to $15,000. W. B. Nash, “Remarks made before the Governing Committee Meeting,” 28 October 1925.
Apparently, 1,100 brokers provided sufficient liquidity for the exchange until the boom in the mid-1920s, as there is no recorded discussion of the need to expand capacity on the floor of the exchange until then. On 28 October 1925 the Governing Committee of the NYSE took up the question of how to accommodate the increased demand for services on the exchange. The chairman of the committee, Warren B. Nash, made the case for more seats, pointing to the rise in listings and volume. As membership had not increased since 1879, “a point might soon be reached when there would not be enough active members on the floor to handle adequately the constantly rising volume of orders.” Nash argued that capacity required not only “additional space and mechanical facilities but also more members to handle the market.”34
W. B. Nash, “Remarks made before the Governing Committee Meeting,” 28 October 1925.
NYSE Resolution, 28 October 1925; Simmons, “Letter to the Members of the NYSE,” 28 October 1925 and, Report of the President, 1 May 1925 / 1 May 1926.
The optimism of the Governing Committee was not shared by many members, and there was a groundswell of opposition to this surprise proposal. Opposition members felt that the Governing Committee had acted secretively and against their interests, and was engineering an increase in competition.36
Commercial and Financial Chronicle, 31 October 1925; and New York Times, 5 November 1925.
New York Times, 12 November 1925; and New York World, 3 February 1929.
New York World, 3 February 1929; and New York Herald, 26 January 1929.
After this ignominious defeat, the leadership abandoned plans to expand the exchange until the extraordinary stock market boom began to place additional pressure on the exchange. On 15 October 1928 President Simmons called a meeting of the Governing Committee to establish a Special Committee to consider again the question of whether the membership should be increased. To avoid a repeat of the 1925 failure, Simmons convoked a meeting of the members on 30 October 1928 before any recommendation was made. There he put forth the case for an increase in membership.39
Simmons, Report of the President, 1 May 1928 / 1 May 1929; NYSE archives, “Memorandum on Increasing Stock Exchange Memberships,” undated.
all this increased business must be poured into our floor through an artificially restricted membership, which has obviously reached its capacity this year for handling the volume of business offered. There is no use in continuing our other efforts to extend and expand our business unless a comparable expansion occurs in our membership.
There is no denying that in the great markets of this year, the Stock Exchange has been hampered in giving the public perfect brokerage service because of insufficient attendance on the floor. As our markets grow larger and larger in volume, there is no reason for doubting that poor execution of public orders will continually grow worse.
Simmons believed that the NYSE stood to lose the good will of the American public. He argued that laborsaving devices had been fully exploited and “no new mechanical device can in the future make up for insufficient members on the floor to handle the business.” The inability to provide high quality service would throw business to the New York Curb Market and the out-of-town exchanges, which were beginning to list issues whose sole market had been in New York. Now that Europe had returned to the gold standard, he also saw the specter of competition from the London and Berlin markets. He noted that neither of those two exchanges limited their membership and even the Paris exchange was considering adding new brokers.40
NYSE archives, “Memorandum on Increasing Stock Memberships,” undated.
Faced with even higher future orders, Simmons proposed the issue of a seat “dividend” for each member that would double the number of seats to 2,200. To provide additional revenue for a future physical enlargement of the exchange, he recommended an increase in the transfer fee on seats from $4,000 to $10,000. By increasing the number of seats and improving facilities, Simmons claimed that each exchange member would be able “to have his cake and eat it too.”
While Simmons lobbied the membership, the Special Committee sent a poll to the members of the exchange. Members were queried about how quickly—within three months, within one year, or more than one year—they would sell their rights if there were a 25, 50, or 100 percent increase in membership. In addition, the poll asked if members would try to buy up other rights and thereby be able to nominate a candidate if there were a 25 or 50 percent increase in membership.41
NYSE archives, Ballot, undated.
As in 1925 and even 1879, the brokers would have been concerned that more competition would reduce their current profits, but the value of their seats (reflecting the capitalized value of their future earnings) could also decline if the NYSE became less valuable. If business continued to slip away, other exchanges would have lower bid-ask spreads and might gain dominance in many securities. Even if there was more competition on the floor, brokers had to ensure that the exchange had the capacity to continue attracting the growing flow of orders. Thus, brokers might be willing to accept a 25 percent increase in the number of seats, as some increase in competition on the floor would be offset by maintaining the dominance of the exchange in an expanding market.
Following this sentiment, the Special Committee produced a report that recommended a 275 member increase to be achieved by the issue of a one-quarter seat right to each current member.42
One member of the committee dissented, complaining that there was not enough physical space on the floor of the exchange to accommodate 275 new members, recommending only a 10 percent dividend. Letter of Edgar Boody to the Governing Committee, 19 January 1929.
Special Committee Letter to Members of the New York Stock Exchange, NYSE archives, 7 February 1929.
Yet, increasing the number of seats was not the only possibility. The Special Committee had received other proposals for expanding the capacity of the exchange. The most important of these proposals were to: allow partners or employees of members, especially clerks, to make contracts, substituting for members in some tasks on the floor; or permit leasing of seats by inactive members to increase the number of active traders on the floor. Both of these alternatives appear to have been rejected because they only found favor with out-of-town brokerages and the larger in-town brokerages that promoted them before the committee.44
NYSE archives, C. Clothier Jones, Letter to Ashbel Green, Secretary of the NYSE, 17 December 1928.
A leading opponent of the seat dividend proposal was Edward Allen Pierce. A former member of the stock exchange, Pierce was a partner in one of the largest brokerages, a firm with 18 partners, three of whom were members of the exchange. Pierce claimed that more seats would dilute their value and would not necessarily add brokers on the floor. Instead, he proposed that out-of-town members be allowed to lease their seats for a fee to individuals approved by the Admissions Committee. As an example, he suggested that an annual fee of $50,000 might be set, with $30,000 going to the lessor, $10,000 to the Exchange, and $10,000 apportioned among the members to compensate for the increased competition. This proposal received relatively little support as most members of the exchange were neither members of large brokerages nor out-of-town houses, and they owned but one seat. Allowing the leasing of seats would expand capacity and increase competition for them. The proposed compensation from leasing even 50 or 100 seats seemed small when spread among all the members.
Similarly, allowing clerks on the floor to assist with some activities or partners to substitute for the owners of the seat seemed to offer greater benefits to the larger brokerages that might more easily hire additional staff or get a partner as a substitute. With a clerk's active assistance on the floor, a broker would be able to handle more business than an individual broker. Both of these alternatives were rejected by the committee. Clerks' roles on the floor were then narrowly defined, and the Governing Committee adopted a rule that precluded the possibility of clerks acting in any capacity as brokers on the floor.45
Commercial and Financial Chronicle, 15 December 1928.
The Special Committee also complained that leasing and permitting clerks on the floor would undermine the “individual moral and financial responsibility” of traders on the floor because they might have little or no capital in the case of losses. Advocates responded that many seats were held by individuals who had little or no capital, and whose purchase money has been provided by their firms. Thus, responsibility rested with the firm, not with the individuals. See NYSE archives, E. A. Pierce, Letter to E. H. H. Simmons, 30 January 1929; and New York World, 3 February 1929.
On 24 January 1929 the Governing Committee convened and voted 31 to 1 to adopt the recommendations of the Special Committee.47
NYSE Governing Committee Minutes, 21 January 1929, pp. 619–20; and 24 January 1929, p. 631.
New York World, 3 February 1929.
New York Herald, 26 January 1929.
NYSE Governing Committee Minutes, February 13, 1929.
DID THE DIVIDEND INCREASE THE VALUE OF THE NYSE?
The decision to augment the number of seats by 25 percent was an admission that the structure of the exchange needed to be revamped. The announcement of this increase was accompanied by a substantial contemporaneous gain in the value of a seat and of the exchange. Before any discussion of a seat dividend, the price of an individual seat in October 1928 was $450,000, implying that the aggregate pre-announcement value of the exchange would have been $495 million. The postannouncement prices, which fluctuated between $560,000 and $625,000, yield aggregate values for the exchange of $616 to $688 million. For the postdividend distribution prices, which ranged between $420,000 and $500,000, the exchange was valued between $578 and $688 million.
However, the great bull market was in full swing, and prices of seats may also have been climbing because of ordinary fundamentals. To separate the rise in prices due to anticipated gains in the competitiveness of the exchange from that of basic fundamentals, an event study is useful.51
Campbell, Lo, and Mackinlay, Econometrics.
Seat prices provide insight into the efficiency of the exchange under different technology, rules, and regulations. Schwert, “Stock Exchange Seats,” examined the efficiency of the market for seats, using end-of-month seat prices for 1926–1972. In similar studies, Jarrell, “Change”; and Golbe, “Negotiated Commissions” and “Has Deregulation,” used end-of-month postwar data to examine the effects of deregulation on the exchanges. More recently, Keim and Madhavan, “Information,” employed all bids, offers, and sale prices of NYSE seats for 1973–1994 to study the determinants of pricing and the ability of seat prices to predict future activity on the exchange; and Keim and Madhavan, “Relation,” used additional annual data to look at the predictive power of seat prices for future stock market returns.
Owing to the fact that seat sales for the whole week were only recorded on the last day of the week, we restrict our analysis to weekly changes in the prices of seats, taking the last observed sale as the end of week price. The fundamentals that govern commissions and profits for brokers, and hence, seat prices on the exchange are the level of stock prices and the volume of shares traded. In the simplest model where microstructure, technology, and regulation are held constant, profits to brokers should be a function of the stock prices on the NYSE and the volume of shares traded. Assuming that the discount rate and commission rate are constant, seat prices will change only if there has been a change in volume or share prices. The two measures of fundamentals we use are the innovations in the Dow Jones Industrials average and in the volume of shares traded on the NYSE. We employ both the change in the daily volume from week to week and the change in the volume over the last thirty days. Seat price returns and innovations in the explanatory variables were all stationary. Using Dickey-Fuller tests we easily rejected the hypothesis that there were unit roots in the time series.
We estimated the following CAPM regression53
See Keim and Madhavan, “Relation.”

where Rt is the return on a seat on the New York Stock exchange over time t, rf, t is the risk free rate, measured by the three- to six-month rate on U.S. Treasury notes and certificates.54
The seat return is the weekly percentage change in the price of a seat. The data on interest rates were obtained from the Board of Governors of the Federal Reserve System, Banking and Monetary Statistics.
New York Stock Exchange, Yearbooks.
To conduct our event studies, we need to define the time of the event.56
Binder, “Event Study Methodology.”

FIGURE 4 NYSE SEAT PRICES, JUNE 1925–JANUARY 1926
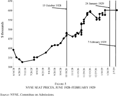
The event window for the 1928–1929 quarter seat dividend is shown in Figure 5. Members' expectations about the proposed increase in the number of seats probably evolved over time. There was no simple announcement that would have influenced prices; and given the failure in 1925, members might well have been skeptical about new efforts by the leaders of the exchange. The first indication that an increase in the number of seats was possible appeared on 15 October 1928 when President Simmons called a special meeting of the Governing Committee to discuss whether to increase membership. This body decided to convene a Special Committee. Seat prices were already rising before 15 October, although this increase may have been driven by other fundamentals. There might also have been some private conversations that leaked out in advance of this meeting, which could have raised seat prices. Consequently, selecting this date as the beginning of the event window may underestimate the abnormal return. As he did not want to be accused of being secretive, as he had been in 1925, President Simmons pressed the case for increasing membership in a meeting with members on 30 October 1928. At this point, the potential increase in the number of seats could have ranged from 25 to 100 percent. Members were then polled on how fast new seats could be formed. The official proposal for the quarter-seat dividend came in a report by the Special Committee that was submitted to the Governing Committee on 21 January 1929. Three days later on 24 January, the Governing Committee reconvened and voted to accept the report's recommendations, a key moment marked on Figure 5. This action was followed by the members' favorable vote on 7 February 1929 that permitted transfers to begin on 18 February 1929. Thus, the second window covers the period from 15 October to 7 February and encompasses a rise in the value of a seat from $425,000 to $600,000.

FIGURE 5 NYSE SEAT PRICES, JUNE 1928–FEBRUARY 1929
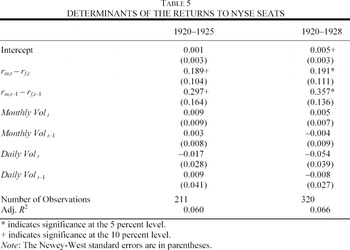
The estimates of equation two for both events are presented in Table 5.57
A more complete test of the announcement effects would include a test of the effects on the returns to seats on regional exchanges to determine if there were negative excess returns from the expansion of the NYSE. Unfortunately, such tests are not feasible, as data for these exchanges is only monthly and they were thin markets with fewer seats and fewer trades. The Curb Exchange in New York was bigger than the regionals, but even it had a relatively thin market in seats compared to the NYSE. Furthermore, the Curb had a long-term cooperative relationship with the NYSE. See White, “Anticipating the Stock Market Crash.”
See, Campbell, Lo, and MacKinlay, Econometrics; and Poon and Granger, “Forecasting Volatility.”
See Keim and Madhavan, “Relation.”

The difference between the observed returns on NYSE seats and the fitted values gives the abnormal returns. Figures 6 and 7 plot the cumulative abnormal returns, beginning several months before the event windows for 1925 and 1929.60
Typical of event studies, the cumulative abnormal returns exhibit considerable, apparently unexplained movement.

FIGURE 6 CUMULATIVE ABNORMAL RETURNS, JUNE 1925–MARCH 1926

FIGURE 7 CUMULATIVE ABNORMAL RETURNS, JUNE 1928–FEBRUARY 1929
In Figure 7, large cumulative abnormal returns begin at the opening of the event window in 1929 and reach about 20 percent. This increase suggests that the price of seats may have increased by 15 or perhaps 20 percent (if news leaked out early) because of the quarter-seat dividend. We conclude that the potentially greater liquidity of the exchange made the seats more valuable. The brokers expected the expansion to ease the NYSE's capacity constraint and enhance its competitiveness. This increase in abnormal returns does not appear to be related to the stock market boom because the timing of these returns does not match the movements in the boom well. The first run up in the market began in March 1928, well in advance of the seat dividend. The market again experienced high monthly returns in October and November of 1928 when discussions of the seat dividend were at an early stage, but the extraordinary returns in summer of 1929 have no effect on seat prices, which are roughly flat. In fact, in a subsequent study, it appears that NYSE brokers became very pessimistic during the summer and the model of seat prices forecasts much higher prices than were observed, suggesting that brokers may have expected a collapse in the market.61
White, “Anticipating the Stock Market Crash.”
SOLUTION OR FALSE HOPE?
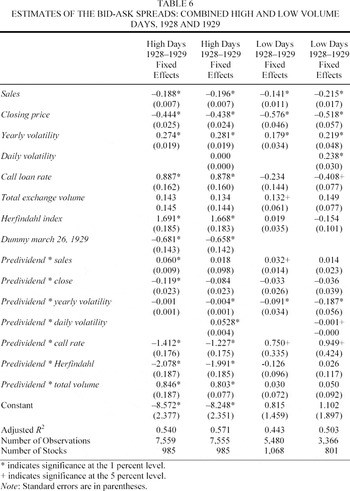
Were the members of the exchange too sanguine, expecting that they could prevent further erosion of the NYSE's première position by the quarter-seat dividend? Whether or not the exchange improved the liquidity and the competitiveness of the exchange should be visible in the behavior of the post-seat-dividend bid-ask spreads. Separate regressions of equation one that combine the high volume days for 1928 and 1929 and low days for 1928 and 1929 reveal the extent of the changes. A dummy variable for the extraordinarily high day of 26 March 1929, when volume climbed above 8 million shares, is included to test for any higher-level capacity constraint. The interaction terms are now set equal to one for the predividend period to provide a means of comparing the effects of the seat increase for both high and low volume days. If the NYSE had been capacity constrained before the seat dividend but not afterwards, we would expect the coefficients on the interaction terms for the exchange-wide variables, total volume and the Herfindahl index, to be significant in the combined high volume regressions but not in the combined low volume regressions.
Table 6 presents fixed effects regressions for the combined high and low volume days. The estimates for the stock-specific variables are again stable and similar to previous estimates. On low volume days, higher volume of trading or greater concentration appears to have no effect. On high volume days, all the exchange-wide variables are highly correlated, as is the dummy for 26 March 1929, making it difficult to estimate the coefficients precisely. The flood of orders on the 8 million share day drove bid-ask spreads down further. The only unexpected result is that the Herfindahl index has a positive and significant sign. More importantly, the interaction terms for the exchange-wide variables confirm the presence of capacity effects on high volume days before the increase in the number of seats. Before the seat dividend, higher total volume on the exchange significantly increased individual stocks' bid-ask spreads, mitigated by more concentrated trading as indicated by the coefficient on the Herfindahl index. These effects are absent in the combined low volume regressions, as conjectured. Thus, the increase in the number of seats appears to have dampened the effects of volume surges on bid-ask spreads.

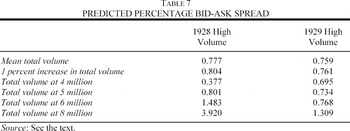
Table 7 presents the predicted spreads for high volume days in 1928 and 1929 using the mean values of the variables. In contrast to the results for 1928, the response of bid-ask spreads to high volume days was drastically reduced in 1929. A 1 percent increase in total volume had an imperceptible effect, and the increases from five to six million remain modest, under one tick. Although the coefficient on the high volume day, 26 March 1929, is negative, these estimates suggest that there may have been a new higher capacity constraint even with 1,375 seats. At eight million shares, the bid-ask spread would have jumped to 1.309 percent, but it still would have been far below a predicted 3.92 percent when there were 1,100 seats. Thus, there was still a substantial weakening of the effects of volume surges on bid-ask spreads after the quarter-seat dividend. The expansion of the exchange had enhanced its liquidity and competitiveness.

The expansion of the exchange created more competition on the floor of the exchange for existing brokers. Did they lose out or did business on the exchange rise enough to compensate them for potentially lower bid-ask spreads? Unfortunately, there are no records of brokerage houses available to test this possibility. However, a naïve calculation suggests that the increased volume following the expansion outweighed the decline in bid-ask spreads. At the mean volume prior to the expansion, the mean percentage bid-ask spread was 0.777 percent; afterwards it was 0.759 percent. Trading was consistently higher month-by-month in 1929 compared to 1928. In July 1928 the market value of shares traded on the NYSE was $52,903 million and in July 1929 it was $77,264 million.62
NYSE, Yearbook 1928–1929.
CONCLUSION
After World War I the flow of orders to American stock exchanges was rapidly increasing, and the NYSE reached a capacity constraint that was determined by the fixed number of seats. Given the state of technology and the rules of the exchange, higher order flows produced delays and reduced the quality of service to customers. Concern over the potential loss of business to competing exchanges forced the NYSE to consider its options. Although some members were unhappy, the overwhelming majority found that the creation of a quarter-seat dividend provided them with a means to personally capture the gains from increasing the efficiency of the exchange. The rise in the number of seats eased the pressure on the bid-ask spread from surges in volume. As anticipated, the increase in seats greased the order processing machine on the floor of the exchange and delivered benefits to customers, even as competition from other exchanges continued to grow. The 275 new seats moved, but apparently did not eliminate, the constraint, as critics who pushed for an even greater increase had warned. However, this boundary would not be tested until long after the Great Depression. Volume had exceeded 5 million shares on 24 days in 1928 and 36 days in 1929. Afterwards, it was a rare occurrence: one day each in 1937, 1939, 1946, 1959; two days in 1957, 1958, and 1960; and three days in 1955. Only when the go-go years began in 1961 and the exchange experienced 5 million plus shares on 41 days would the capacity of the exchange be tested again.
We thank seminar participants at the Columbia Macro Lunch, the NBER Summer Institute, the New York Stock Exchange, and Universidad Carlos III. We owe particular thanks to Marc Weidenmier, Kim Oosterlinck, and three anonymous referees for their extensive comments. We especially appreciate the time and guidance of Steven Wheeler, Director of Corporate Giving, Archives and Education, NYSE Euronext. We gratefully acknowledge support from the National Science Foundation (34-3262-00-0-79-151) and the Rutgers University Research Council.