I. INTRODUCTION
In the last few decades, the number of applications like radar, wireless, mobile communication, satellite television, heating systems etc. in the microwave frequency range have exponentially increased. This has resulted in a serious issue of electromagnetic interference (EMI). Reference Narang and Hudiara1 EMI refers to the unwanted, conducting, or radiating signals that generate false images and cause unacceptable deterioration of the system output. Reference Meena, Bhattachrya and Chatterjee2 To provide effective shielding from harmful effects of EM waves on biological tissues as well as to absorb radar signals, there is an increase in the demand of preparing microwave absorbing materials with high absorption (≥99%). Among various types of absorbers, ferrites have proven their potential for this due to presence of substantial losses in the vicinity of ferromagnetic resonance (FMR) and dielectric relaxation peaks. Ferrites exist in various structures like spinel ferrites, hexaferrites, garnets, and ortho-ferrites. Reference Meena, Bhattachrya and Chatterjee2 Garnet ferrites have low value of saturation magnetization and anisotropy field. So their applications are restricted maximum upto 1–2 GHz. Reference Harris, Geiler, Chen, Yoon, Wu, Yang, Chen, He, Parimi, Zuo, Patton, Abe, Acher and Vittoria3 Spinel ferrites also are not useful in microwave frequency range due to intrinsic restrictions imposed by the occurrence of their natural FMR below 1 GHz Reference Ahmed, Grössinger, Kriegisch, Kubel and Rana4 . In gigahertz frequency range, ferrites having substantially higher magnetic anisotropy are required. For this purpose, we need to switch to hexaferrites, having the magnetoplumbite structure. Hexaferrites exist in various stable phases like M, Y, W, Z, X, U. Among these, M-type hexaferrites are well recognized as absorbing materials due to their large saturation magnetization and high natural resonance frequency. Reference Pullar5 M-type barium hexaferrites have been considerably studied due to their features like large magneto-crystalline anisotropy, high chemical stability, low cost, low density, high Curie temperature, high electrical resistivity, corrosion resistivity, and high magnetic loss. Reference Alam, Moradi, Rostami, Nikmanesh, Moayedi and Bai6–Reference Ghasemi, Liu and Morisako10 To improve their properties further, various types of impurities like Co–Ti, Reference Narang, Kaur, Bahel and Singh7 La, Reference Narang, Singh and Singh8 Co–Ru, Reference Singh, Narang, Hudiara, Sudheendran and James Raju9 Zn–Co–Zr, Reference Alam, Moradi, Rostami, Nikmanesh, Moayedi and Bai6 Mn–Cu–Zr Reference Ghasemi, Liu and Morisako10 have been doped in place of Fe3+ ions. There are different methods of preparing these doped ferrites like mechanical grinding, glass crystallization, Co-precipitation, organic resin, solid state, sol–gel, molten salt. Reference Ahmed, Grössinger, Kriegisch, Kubel and Rana4 Among these, solid state (ceramic approach) is the most widely used and extremely effective method. Reference Srivastava and Yadav11
In this research, ferrite samples BaCo x Ti x Fe(12−2x)O19 (x = 0.0–1.0 in step size of 0.2) were synthesized by conventional solid state reaction method. The effect of cobalt–titanium substitution in barium hexaferrites on structural, magnetic, dielectric, and microwave absorption characteristics was studied. The electromagnetic and absorption analysis of compositions with x = 0.1, 0.3, 0.5, 0.7, 0.9 has been reported previously. Reference Narang, Kaur, Bahel and Singh7 The objective behind synthesizing the even series of same composition is to find out the best composition for absorption applications. The findings denote that the prepared samples can not only be used as single-layer but also as double-layer microwave absorbers for wireless telecommunication systems and reduction of radar signatures i.e., in stealth technology. Reference Von Hippel12
II. EXPERIMENTAL
Ba M-type hexaferrites with composition BaCo x Ti x Fe(12−2x)O19 (x = 0.0, 0.2, 0.4, 0.6, 0.8, and 1.0) were synthesized by conventional ceramic processing method. The starting materials used were BaCO3 (SD fine-chem Limited, 99% purity), Fe2O3 (Loba Chemie, 95–98% purity), CoCO3 (CDH, Bombay), and TiO2 (SD fine-chem Limited, 99–100% purity). Stoichiometric amounts of these materials were mixed with acetone and grounded in agate pestle mortar for 12 h to get mixture. The mixture was dried and calcined at 1000 °C for 6 h. The obtained powders were re-grounded for 12 h. The powders were granulated using 5% solution of polyvinyl alcohol to reduce the brittleness. This step was followed by shaping of samples. These samples were pressed into the pellets of rectangular shape for X-band and Ku-band under uniaxial pressure of 75 kN/m2. The pellets formed were finally sintered at 1200 °C for 12 h in a linearly programmable furnace. Finally, cooling down of the pellets to room temperature was done at the rate of 2 °C/min. Phase identification of the powders was done by an x-ray diffractometer (Model D8 Focus, Bruker GmbH, Bremen, Germany) with Ni-filtered Cu Kα radiation (λ = 1.54 Å) in the range 20° ≤ 2θ ≤ 80°. Microstructure morphologies of the freshly fractured pieces, along with energy dispersive spectroscopy (EDS) spectra, were determined by scanning electron microscope (Zeiss-Supra 5S, Carl Zeiss AG, Dublin, California). The vibration sample magnetometer (VSM; MicroSense FCM-10, MicroSense, Lowell, Massachusetts) was used to investigate the magnetic properties at room temperature (external fields −17 kOe to +17 kOe). Complex scattering parameters were measured using a vector network analyzer (VNA; Agilent N5225A PNA series, Agilent, Santa Clara, California). Complex permittivity (ε′ − jε″) and complex permeability (μ′ − jμ″) were determined from the measured S-parameters using Nicolson–Ross Reference Nicolson and Ross13 and Weir Reference Weir14 method in frequency range 8.2–18 GHz. Before starting analysis on vector network analyzer, two-port calibration was done to remove the errors due to directivity, source mismatch, isolation, and load mismatch in both the forward and reverse direction.
III. RESULTS AND DISCUSSION
A. Phase identification using x-ray diffraction (XRD)
Indexed x-ray diffractograms of samples x = 0.0, 0.2, 0.4, 0.6, 0.8, and 1.0 are shown in Fig. 1. X-ray data are analyzed using computer software Powder X. No significant impurity peak is detected in XRD patterns. It confirms that the crystal planes of the prepared samples are well grown and the samples reveal a single phase. The space group for the samples is observed to be p63/mmc. XRD data for samples x = 0.4 and x = 0.6 show variation in the intensity of peaks at some angles which can be related to the occupation of crystallographic sites by Co–Ti ions instead of ferric ions. Reference Narang, Kaur, Bahel and Singh7 The slight change in the diffraction peak position is due to the presence of Co and Ti cations that results in change of lattice parameters of the ferrites. Reference Alam, Moradi, Rostami, Nikmanesh, Moayedi and Bai6
X-ray diffractograms for ferrites prepared.
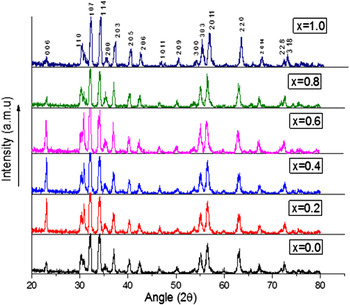
Figure 2 shows the variation of lattice parameters and unit cell volume with respect to (w.r.t.) composition. It is observed that lattice parameter ‘a’ shows very small variation with x, while parameter ‘c’ shows significant variation from 23.23 (x = 0.0) to 22.61 (x = 1.0). The observed behavior of these parameters can be attributed to different ionic radii of the substituted ion (Co2+: 0.745 Å, Ti4+: 0.6 Å) and the replaced ion (Fe3+: 0.645 Å). The greater variation in ‘c’ in comparison to parameter ‘a’ may be ascribed to an important characteristic of hexaferrites: anisotropy. Due to this feature, c-axis is easy axis in the lattice and it is easier to orient the spin directions along c-axis than any other axis. Due to this fact, there is more variation in value of ‘c’ than ‘a’. Reference Ahmed, Grössinger, Kriegisch, Kubel and Rana15 Wagner Reference Wagner16 reported that the ratio c/a can be used to quantify the formation of M-type structure. M-ferrites have this ratio c/a 3.98. Since, in the prepared samples this ratio ranges from 3.79 (x = 0.8) to 3.97 (x = 0.4), formation of M-type ferrites is confirmed. The volume of unit cell for all the doped ferrites is calculated using the relation Reference Cullity and Graham17 : V = 0.866a 2 c. The spectrum of unit cell volume varies almost in direction proportion to parameter ‘c’ as the variation in parameter ‘a’ is negligible. The lattice parameters of the prepared samples decrease with increase in dopant concentration (x) except for x = 0.4 and 1.0. The slightly different behavior for these two compositions can be attributed to the combined substitution of cobalt and titanium ions in the crystal lattice. Many researchers have observed similar variation in lattice parameters of their prepared hexaferrites by many researchers. Reference Abbas, Ahmad, Kanwal, Murtaza, Ali, Khan, Akhtar and Ahmad18–Reference Xu, Yang, Zou, Song, Gao, An and Gan20
Graphical variation of lattice parameters and volume w.r.t. composition (x).

B. Surface morphology using scanning electron micrograph (SEM)
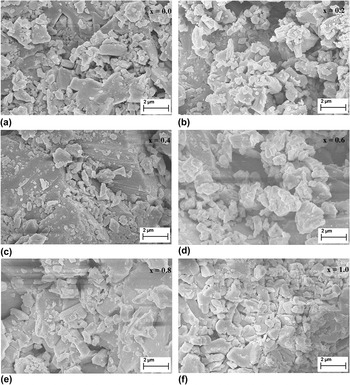
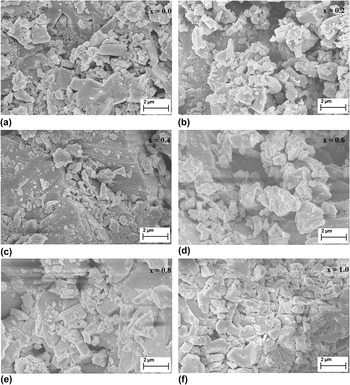
Field emission-SEM (FE-SEM) images, presented in Figs. 3(a)–3(f), show platelet-like hexagonal grains in all the ferrites. The shape of the grains is very important for deciding the application field of the ferrites. Abbas et al. Reference Abbas, Ahmad, Kanwal, Murtaza, Ali, Khan, Akhtar and Ahmad18 and Xu et al. Reference Xu, Zou, Li, Li, Gan and Hong21 reported that the platelet shaped hexaferrites can be used in microwave absorbing purposes. The average grain size, estimated using line intercept method, increases from 1.39 μm for x = 0.0 to 3.03 μm for x = 0.8 (Table I), which is quite large. Relatively higher calcination and sintering temperatures for longer period of time can be the reason of large size of grains. Reference Ahmad, Ahmad, Ali, Kanwal, Awan, Mustafa and Ahmad22 The grain size for x = 1.0 is observed to be lower as compared to the other doped compositions. This could be attributed to the fact that high concentration of doped entities may inhibit the grain growth to some extent resulting in smaller grain for this particular composition. Large grain ferrites are in more periodic arrangement and it becomes easy to align the spins in the direction of field by applying magnetic field. This results in the enhancement of the permeability. Thus, enhanced permeability is suitable for impedance matching in microwave absorption. Reference Ahmad, Ahmad, Ali, Kanwal, Awan, Mustafa and Ahmad22,Reference Goldman23
FE-SEM for prepared ferrite samples (a) x = 0.0, (b) x = 0.2, (c) x = 0.4, (d) x = 0.6, (e) x = 0.8, and (f) x = 1.0.
Normalized weight% age (atomic% age) and approximate grain size of the detected elements in BaCo x Ti x Fe(12−2x)O19 ceramics.

C. EDS analysis
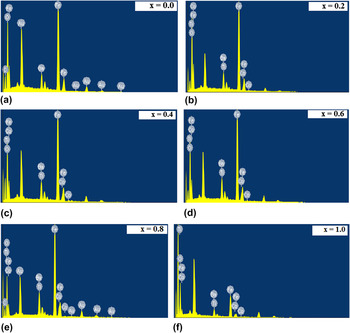
Figures 4(a)–4(f) show the elemental composition of the resulted samples after doping cobalt-titanium in different amount. Figures show the presence of Ba, Fe, Co, Ti, and O in the synthesized samples. Samples x = 0.0 and x = 0.8 show small amount of gold and carbon along with the desired elements. The presence of gold can be justified due to gold-coating of the samples before EDS, while carbon may be due to some impurity while preparation.
EDS Spectra of BaCo x Ti x Fe(12−2x)O19 (a) x = 0.0, (b) x = 0.2, (c) x = 0.4, (d) x = 0.6, (e) x = 0.8, and (f) x = 1.0.

Table I presents the normalized weight and atomic weight percentage of the detected elements that show a good similarity with the nominal compositions.
D. VSM analysis
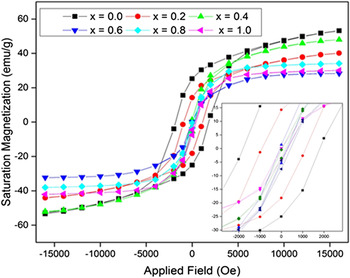
The hysteresis loops of the synthesized barium M-ferrites at room temperature are presented in Fig. 5. Table II reports the measured magnetic parameters of the synthesized ferrite samples from the hysteresis loops. Loop of the undoped sample is observed to be wide as compared to the doped samples, which indicates the higher value of coercivity (H C) in x = 0.0. This high coercivity is due to its strong uniaxial anisotropy (H a) along the c-axis. With increase in doping, iron ions at 2b bipyramidal sites are replaced by Co2+ and Ti4+ ions, Reference Ashiq, Shakoor, Najam-Ul-Haq, Warsi, Ali and Shakir19 which results in change of easy axis of magnetization from c-axis to the basal plane. Reference Gordani, Ghasemi and Saidi24 This causes reduction in magneto-crystalline anisotropy field (confirmed from calculated H a values in Table II), ultimately being observed in the decrease in H C values (1168.5 Oe for x = 0.0 to 160 Oe for x = 1.0). This decrease in value of coercivity suggests that these ferrites can be used in high density recording media. Reference Ashiq, Shakoor, Najam-Ul-Haq, Warsi, Ali and Shakir19,Reference Ahmad, Aen, Islam, Niazi and Rana25 In addition, all the samples have coercive field of the order of few hundred oersted, which shows the soft character of these ferrites. M. Ahmad et al. Reference Ahmed, Grössinger, Kriegisch, Kubel and Rana15 and I. Ahmad et al. Reference Ahmad, Ahmad, Ali, Kanwal, Awan, Mustafa and Ahmad22 reported that coercivity of this order is one of the necessary conditions for electromagnetic materials useful in EMI suppression. Value of saturation magnetization (M S) decreases with increase in doping for x = 0.2 and then takes an increasing trend for the higher substitutions. This decrease may be ascribed to the hard reversible displacement or domain wall movement in the direction of applied field. Harder the displacement, the smaller will be the value of M S. Reference Aen, Ahmad and Rana26 This decrease may be due to break of co-linearity and spin canting. Reference Bsoul and Mahmood27 The increase in value of M S for the other samples can be ascribed to the occupancy of down spin substitutional site 4f1 (tetrahedral site) by nonmagnetic titanium ion. Reference Alam, Moradi, Rostami, Nikmanesh, Moayedi and Bai6 This results in increase in number of unpaired electrons with downward spin, causing M S to increase. Reference Sharbati, Amiri and Mousarezaei28
Hysteresis loops of all the samples at room temperature.

Magnetic parameters of the synthesized ferrites.

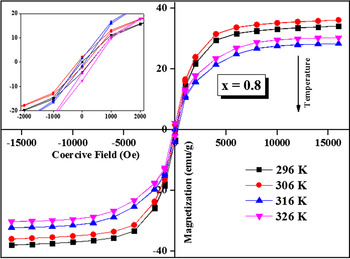
Table II also reports the value of Curie temperature (T C) for all the samples. It is inferred that Curie temperature decreases with substitution except for composition x = 0.4. The decrease of T C can be attributed to the weakening of exchange interactions as a result of substitution. As Fe3+ ions are replaced by less magnetic and nonmagnetic ions in this series, the exchange interactions (Fe3+–O2−–Fe3+) are decreased. Reference Narang, Singh and Singh8 Thus, lesser amount of energy is required to offset the effects of these interactions, leading to decrease in Curie temperature. Greater the doping level of less magnetic ions, lesser will be the Curie temperature. Increase in T C for x = 0.4 can be attributed to the high saturation magnetization observed in this sample as compared to other doped samples. The temperature dependence of magnetic M–H loop is shown at different temperatures (296 K, 306 K, 316 K, and 326 K) for a selected composition x = 0.8 in Fig. 6. It can be observed that saturation magnetization has decreased with increase in temperature which is in accordance to previously published results in hexaferrites. Reference Smit and Wijn29,Reference Hu, Chen, Su, Bennett, Burns, Uddin, Ziemer and Harris30
Variation of M–H loop for composition x = 0.8 with temperature (296 K, 306 K, 316 K, 326 K).

E. Permittivity spectra
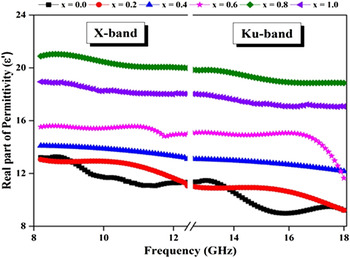
Figure 7 shows the variation of real part of permittivity (dielectric constant) w.r.t. frequency for different substitution levels of Co–Ti in X and Ku-band. This parameter describes the material's capacity to store the electrostatic charge when it is used as a capacitor dielectric. This decaying behavior of real part of permittivity w.r.t. frequency, observed in Fig. 7 is quite natural in ferrite materials and is observed in other ferromagnetic materials too. Reference Singh, Narang, Hudiara, Sudheendran and James Raju31,Reference Singh, Narang, Singh, Sharma and Pandey32 This frequency dispersion is mainly due to the Maxwell–Wagner type of interfacial polarization and is in conformity with the Koop's phenomenological theory. Reference Koops33–Reference Mosleh, Kameli, Poorbaferani, Ranjbar and Salamati35 The dielectric constant of any material is directly in relation to its polarization. Higher the polarization, higher will be the dielectric constant (ε′) of the material. Reference Chand and Singh36 There are four types of polarizations in the ferrites: dipolar polarization, electronic polarization, ionic polarization, and interfacial polarization. The large values of ε′ at lower frequencies are due to the presence of all the four types of polarizations, existence of Fe2+ ions, interfacial dislocation pile-ups, oxygen vacancies, grain boundary effects Reference Haijun, Zhichao, Chenliang, Xi, Liangying and Mingzhong37 etc. At higher frequencies, only two: electronic and ionic polarizations contribute toward it while other two: interfacial and dipolar polarization reduce to small extent. Reference Narang, Chawla, Mudsainiyan and Pubby38 This decaying trend can be justified on the basis of formula: ε = ε∞ + (ε0 − ε∞)/(1 + iωτ), where ε0 and ε∞ are the values of permittivity at angular frequency ω = 0 and ω → ∞, respectively, and τ is the relaxation time for polarization of intrinsic electric dipole polarization. Reference Singh, Babbar, Razdan, Srivastava and Puri39
Variation of real part of permittivity of ferrites w.r.t. frequency for different compositions.

It is also observed that the real part of permittivity increases from 12.7 (x = 0.0) to 20.88 (x = 0.8) and then decreases to 17.54 for x = 1.0 at 18 GHz. This enhancement in the dielectric properties with substitution is mainly due to interfacial and dipole polarization. Reference Guo, Ji, Xu, Zou, Gan and Xu40 With increase in substitution, more Fe3+ ions are converted to Fe2+ ions to balance the electric valence. With this, the chances of electron jumping between Fe3+ and Fe2+ sites are increased which result in enhanced dipole polarization. Reference Xu, Zou, Li, Li, Gan and Hong21 On the other hand, Fe3+ ↔ Fe2+ conversion results in the local displacement of the electrons in the direction of field. This results in more polarization on the surface of material giving rise to interfacial polarization. Due to this reason, all the doped ferrites have higher real permittivity than undoped ferrite in X- and Ku-band.
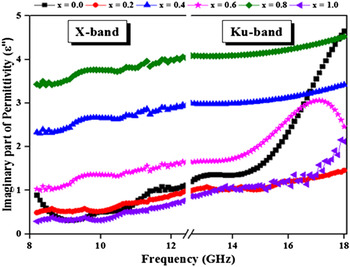
Figure 8 shows the variation of imaginary part of permittivity (dielectric loss) w.r.t. frequency. The plot shows the increase in dielectric loss with substitution as well as frequency. The dielectric loss, which represents the phase lag of dipole oscillations w.r.t. applied electric field, depends on the number and nature of ions present in the ferrite. Reference Alam, Moradi, Rostami, Nikmanesh, Moayedi and Bai6 With increase in doping, the chances of electron transfer between Fe3+ at octahedral sites and Fe2+ at tetrahedral sites are enhanced. This leads to higher value of dielectric losses as compared to undoped sample. Reference Xu, Yang, Zou, Song, Gao, An and Gan20 High values of dielectric loss at higher frequencies may be ascribed to the nature and number of ions present in the samples. It is seen that sample x = 0.8 has the highest imaginary permittivity out of all samples. Higher the imaginary permittivity, larger will be the losses in the ferrite. Folgueras et al. Reference Folgueras, Alves and Rezende41 reported that a material with high dielectric loss does not store EM energy efficiently and converts a part of energy into heat within the material. Thus, a material with high dielectric loss is a good absorber. This conclusion of Folgueras et al. Reference Folgueras, Alves and Rezende41 is justified by the present study where x = 0.8, with highest dielectric loss, has provided maximum absorption (Figs. 9 and 10).
Variation of imaginary part of permittivity of ferrites w.r.t. frequency for different compositions.

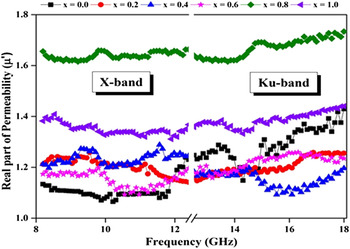
Frequency dependence of real part of permeability of prepared ferrites for different compositions.

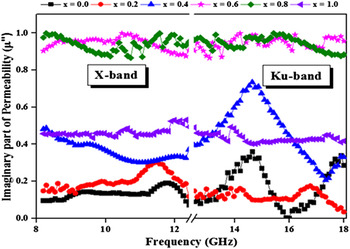
Frequency dependence of imaginary part of permeability of prepared ferrites for different compositions.

F. Permeability spectra
Figures 9 and 10 depict the permeability spectra (μ* = μ′ − jμ″) of the prepared ferrites w.r.t. frequency in X and Ku-band. The variation in the magnetic character is attributed to the mechanism of natural magnetic resonance. In the weak alternative magnetic field, the magnetization occurs due to domain wall turning. The small values of real permeability (μ′) are because of the weak alternative field. Reference Narang, Kaur, Bahel and Singh7,Reference Singh, Babbar, Razdan, Srivastava and Puri39 The decreasing trend of permeability with frequency can be attributed to the limited speed of the spin and domain wall movement (displacement/rotation) in the prepared ferrites. Reference Kaur, Chawla, Narang and Pubby42 The decreasing trend of real permittivity and permeability w.r.t. frequency is favorable for surface impedance match because wave length decreases with increase in frequency applied to the microwave absorber. Reference Ahmed, Grössinger, Kriegisch, Kubel and Rana4
Magnetic losses occurring in barium ferrites are due to their ferromagnetism, the resonance reflection loss (RL) of moving domains and spin rotation in high frequency alternating EM field. Reference Ozah and Bhattacharya43 Domain wall exists when the grain size in the sintered sample is larger than critical diameter, which is given by the formula: D C = (18μ0σw)/(M S 2), where σw is domain wall energy, μ0 is permeability of vacuum, and M S is saturation magnetization. Reference Narang, Kaur, Bahel and Singh7 Cullity et al. reported the critical diameter of Ba hexaferrite to be around 450 nm. Reference Cullity and Graham17 Since, the grain size in the reported samples is higher than 450 nm, the existence of domain wall is confirmed. Magnetic losses occur due to the displacement of this domain wall. Reference Narang, Kaur, Bahel and Singh7
Figure 10 shows the variation of imaginary permeability (magnetic loss) w.r.t. frequency for different compositions. The increase in μ″ with doping can be attributed to the internal stress generated in crystal lattice as a result of doping of Co–Ti. Reference Xu, Yang, Zou, Song, Gao, An and Gan20 The overall decreasing trend of μ″ w.r.t. frequency can be justified as follows: Fe2+ ions are present at 2a sites in the hexagonal lattice of the sample which contribute to the enhancement of magneto-crystalline anisotropy (H A). Reference Ounnunkad44 As a result of H A enhancement, the imaginary permeability reduces in accordance to formula
 $$\mu = {{{M_{\rm{S}}}} \over {2{H_{\rm{A}}}\alpha }}\;{\rm{and}}\;{f_{\rm{r}}} = {{\gamma {H_{\rm{A}}}} \over {2\pi }} \Rightarrow \mu = {{\gamma {M_{\rm{S}}}} \over {4\pi {f_{\rm{r}}}\alpha }}\;{\rm{i}}{\rm{.e}}{\rm{.}}\;\mu \propto {1 \over {{f_{\rm{r}}}}}\quad ,$$
where M S is saturation magnetization, f r is FMR frequency, α is extinction coefficient, and γ is gyromagnetic ratio.
G. Dielectric phase angle (tan δ)
Guo et al. Reference Guo, Ji, Xu, Zou, Gan and Xu40 and Xu et al. Reference Xu, Yang, Zou, Song, Gao, An and Gan20 reported that dielectric phase angle (tan δ) can be used to describe the absorption characteristic of a microwave ferrite:
 $$\tan \,\delta = \tan \,{\delta _{\rm{E}}} + \tan \,{\delta _{\rm{M}}} = {{\varepsilon ''} \over {\varepsilon '}} + {{\mu ''} \over {\mu '}}\quad .$$
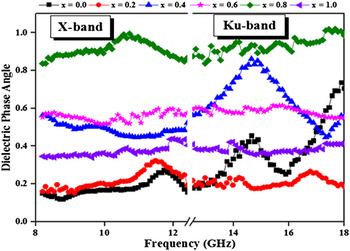
Figure 11 shows the compositional variation of the dielectric phase angle of the prepared ferrites in 8.2–18 GHz range. Highest values of tan δ (in the range 0.8–1.0) are achieved for sample with x = 0.8. This concludes that this sample has very good absorbing capability. Reference Xu, Yang, Zou, Song, Gao, An and Gan20 This conclusion is further strengthened from Fig. 12 where this composition has shown very low RL (high absorption).
Dielectric phase angle (tan δ) variation for different ferrites w.r.t. frequency.

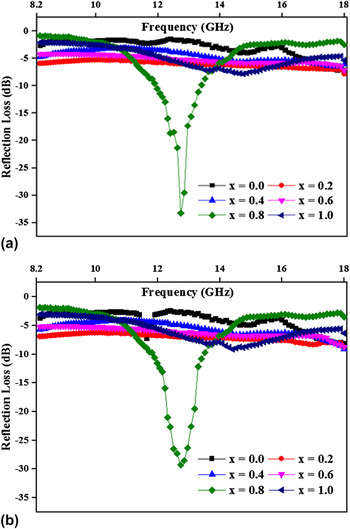
RL curves (a) simulated for ferrite compositions at 3.1 mm thickness, and (b) determined experimentally for ferrite pellets of thickness 3.1 mm in X and Ku-band.

H. Single-layer microwave absorbers
To analyze the absorbing properties of single layered ferrites, two approaches have been adopted: first is simulation from electromagnetic properties and second, experimental determination. The simulation approach is based on transmission line theory, where the normalized input impedance Z n Reference Choopani, Keyhan, Ghasemi, Sharbati and Alam45 and RL Reference Tang, Yang and Hu46 of a metal backed ferrite material are obtained according to the formulae:
 $${Z_{\rm{n}}} = \sqrt {{{{\mu _{\rm{r}}}} \over {{\varepsilon _{\rm{r}}}}}} \,\tanh \left[ {{\rm{j}}{{2\pi fd\sqrt {{\mu _{\rm{r}}}{\varepsilon _{\rm{r}}}} } \over c}} \right]\;{\rm{and}}\;{\rm{RL}}\left( {{\rm{db}}} \right) = 20\,\log \left| {{{{Z_{\rm{n}}} - 1} \over {{Z_{\rm{n}}} + 1}}} \right|\quad ,$$
where f is the frequency of microwave, d is the thickness of sample, c is velocity of light in vacuum, εr is the complex permittivity, and μr is the complex permeability.
Figure 12(a) shows the variation of RL (dB) curves simulated for all samples at 3.1 mm pellet thickness. It is clearly seen that sample x = 0.8 has very low RL (−33 dB) in this frequency range. All the other samples do not show effective absorption of microwaves at any thickness between 1 mm and 5 mm. Hence, these samples can not be used as single-layer microwave absorber in 8.2–18 GHz frequency range. In the second approach, the RL values were determined from the pellets of thickness 3.1 mm using VNA. Figure 12(b) indicates the experimental results of absorption which agree fairly with the simulation results. Composition with x = 0.8 has proven its absorption potential in this approach too with reflection peak of around −30 dB at 12.7 GHz. Rest of the five compositions have not shown any significant variation from simulation results. Absence of reflection peaks in the spectra of these samples may be attributed to the high anisotropy fields (H A) of these samples. Due to high H A, resonance frequency does not fall in this frequency range. Reference Ghasemi, Liu and Morisako47 The previous reporting of odd series of same composition has concluded that x = 0.7 is the best absorber. Reference Narang, Kaur, Bahel and Singh7 The objective of the present research was to find out whether there is any composition in between the odd series that would provide even better absorption than x = 0.7 sample. The objective of this research seems to be fulfilled as x = 0.8 has evolved as even better absorber than x = 0.7.
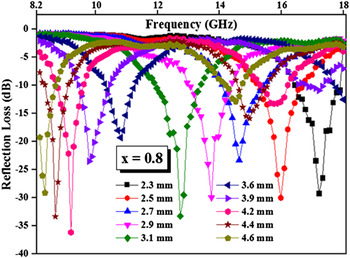
To optimize the sample thickness of x = 0.8 composition w.r.t. absorption of energy, the variation of RL curves w.r.t. frequency at different thicknesses is presented in Fig. 13. This analysis shows how the thickness affects the ability of ferrite to absorb the energy. It is seen that this sample provides very high absorption (≥99%) at a wide range of thicknesses (2.3–4.6 mm). The lowest RL of around −37 dB is achieved at a thickness of 4.2 mm. Another interesting result obtained is the shifting of RL peaks toward the lower side of frequency with increase in sample thickness. Similar shifting has been previously reported by other researchers too. Reference Meena, Bhattachrya and Chatterjee2,Reference Folgueras, Alves and Rezende48
Variation of RL spectrum with thickness for ferrite with Co–Ti = 0.8.

I. Double-layer microwave absorbers
As suggested from single-layer analysis, the compositions with x = 0.2, 0.4, 0.6, and 1.0 are not useful as single-layer absorbers in 8.2–18 GHz frequency range. So, a quite new approach in absorbers: double layer absorber has been analyzed to find out the utility of these compositions. Similar to single-layer, two approaches have been adopted. The simulation results are obtained using the experimental permittivity and permeability values. The RL of EM energy by two-layer absorber is calculated using the equation Reference Balanis49 :
 $$\!\!\!\!{\rm{RL}}\left( {{\rm{dB}}} \right) = 20\,{\log _{10}}\,\left| {{{\left[ {{{\sqrt {{\mu _1}{\varepsilon _1}} \tanh \left( {{\gamma _1}{d_1}} \right) \,+\, \sqrt {{\mu _2}{\varepsilon _2}} \tanh \left( {{\gamma _2}{d_2}} \right)} \over {\sqrt {{{{\mu _1}{\varepsilon _2}} \mathord{\left/ {\vphantom {{{\mu _1}{\varepsilon _2}} {{\mu _2}{\varepsilon _1}}}} \right. \kern-\nulldelimiterspace} {{\mu _2}{\varepsilon _1}}}} \tanh \left( {{\gamma _1}{d_1}} \right)\tanh \left( {{\gamma _2}{d_2}} \right)}}} \right] - 1} \over {\left[ {{{\sqrt {{\mu _1}{\varepsilon _1}} \tanh \left( {{\gamma _1}{d_1}} \right) \,+\, \sqrt {{\mu _2}{\varepsilon _2}} \tanh \left( {{\gamma _2}{d_2}} \right)} \over {\sqrt {{{{\mu _1}{\varepsilon _2}} \mathord{\left/ {\vphantom {{{\mu _1}{\varepsilon _2}} {{\mu _2}{\varepsilon _1}}}} \right. \kern-\nulldelimiterspace} {{\mu _2}{\varepsilon _1}}}} \tanh \left( {{\gamma _1}{d_1}} \right)\tanh \left( {{\gamma _2}{d_2}} \right)}}} \right] + 1}}} \right|;\;{\gamma _i} = i{{2\pi f} \over c}\sqrt {{\mu _i}{\varepsilon _i}} \quad ,$$
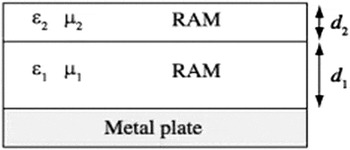
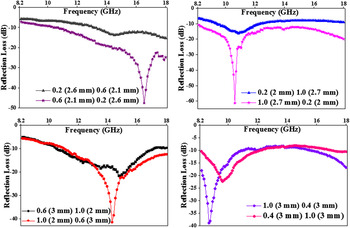
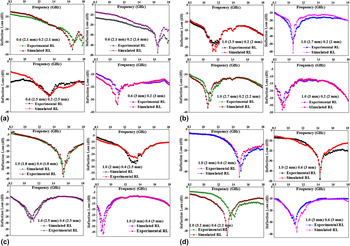
where 1 stands for the sample facing the electromagnetic waves first and 2 stands for the material facing EM wave later on (Fig. 14). Figure 15 shows the RL curves simulated using different combinations of compositions x = 0.2, 0.4, 0.6, and 1.0. It must be noted that better absorption properties are obtained at the cost of compromising the thickness of sample. Also, the stacking order of the ferrites plays a significant role in determining the amplitude and position of resonance peak as well as the bandwidth. It can be seen that placing composition x = 1.0 on upper side of stack results in much higher absorption in comparison to the reverse sequence. Figures 16(a)–16(d) is presented to compare the simulated results with the experimental results of different combinations. It can be seen that the experimental results are very close to the simulated ones. All the four composition pairs at all the four thickness combinations are effectively absorbing the EM energy. Combining 2.7 mm thick x = 1.0 sample and 2.2 mm thick x = 0.2 sample has achieved reflection peak of −61 dB in simulation and −50 dB in experimental approach at 10.8 GHz. Evaluating these absorbers on −10 dB reflection scale, it is concluded that almost all 16 combinations have provided 90% absorption throughout X and Ku-band. It is interesting to note that these absorption results are obtained from the compositions which are useless as single-layer absorber.
Two-layer microwave absorber synthesized by combining two materials with different electromagnetic properties and different thicknesses.

Absorption characteristics for double layer absorber simulated from x = 0.2, 0.4, 0.6, and 1.0 compositions with different thicknesses.

Comparison of simulated and experimentally determined absorption properties of double layer absorber prepared using (a) x = 0.2 and x = 0.6, (b) x = 0.2 and x = 1.0, (c) x = 0.6 and x = 1.0, and (d) x = 1.0 and x = 0.4 with different thicknesses.

IV. CONCLUSIONS
A series of M-type hexaferrites with composition BaCo x Ti x Fe(12−2x)O19 (x = 0.0, 0.2, 0.4, 0.6, 0.8, and 1.0) has been synthesized successfully by solid state reaction method. The structural and magnetic analysis indicates that the dopant ions have greatly influenced the crystalline parameters, saturation magnetization, and coercivity of the samples. XRD results confirm the formation of single phase while SEM images show the platelet shaped grains. Increase in the values of dielectric and magnetic losses has been observed with increase in substitution. The absorption spectrum concludes that the ferrite with x = 0.8 is the best single-layer microwave absorber out of all the doped ferrites in this series with −37 dB RL at 4.2 mm thickness. The compositions x = 0.2, 0.4, 0.6, and 1.0 can be combined to form double-layer absorber to provide very high absorption (≥99%) in X and Ku-band. Stacking order as well as the thicknesses of layers are deciding factors of absorptive behavior of double-layer absorbers. Thus, these materials are a potential candidate for use as single-layer and double-layer microwave absorbers in stealth defense system, microwave interference protection, and microwave darkroom.