


INTRODUCTION
Rapidly increasing anthropogenic greenhouse gas (GHG) emissions are making significant contribution to global climate change. As reported by IPCC (Reference Pachauri and Reisinger2007), the global mean temperature increased by 0·74 °C from 1906 to 2005; specifically, the linear warming trend over the 50 years was 0·13 °C per decade, which is nearly twice the rate for the last 100 years. Thus, concerns about reducing GHG emissions to mitigate climate change have recently inspired the assessment of carbon footprint (CF) for various activities and products. Carbon footprint, defined as a measure of the total amount of carbon dioxide (CO2) emissions caused directly and indirectly by an activity or emitted over the life-cycle of a product, is analysed to measure the climate change impact of products and activities in terms of the amount of GHGs emitted in a whole life-cycle. To identify the climate change impact of a production sector and to develop climate-friendly policies in consumption, CF analysis and assessment has increasingly been concerned with, and widely applied in, agriculture (Ponsioen & Blonk Reference Ponsioen and Blonk2012), industrial production (Virtanen et al. Reference Virtanen, Kurppa, Saarinen, Katajajuuri, Usva, Mäenpää, Mäkelä, Grönroos and Nissinen2011), food consumption (Shirley et al. Reference Shirley, Jones and Kammen2012) and international trading (Hertwich & Peters Reference Hertwich and Peters2009; Peters Reference Peters2010; Peters et al. Reference Peters, Minx, Weber and Edenhofer2011).
In 2009, Hertwich & Peters found that global food production and consumption accounted for 0·20 of total anthropogenic GHG emissions (Hertwich & Peters Reference Hertwich and Peters2009). As a primary food producer, GHG emissions from agriculture contribute 0·12–0·17 to global GHG emissions: this figure is increasing (Smith et al. Reference Smith, Martino, Cai, Gwary, Janzen, Kumar, McCarl, Ogle, O'Mara, Rice, Scholes, Sirotenko, Metz, Davidson, Bosch, Dave and Meyer2007) and is likely to increase further in the coming decades (Smith & Gregory Reference Smith and Gregory2013). Growing interest in GHG mitigation in agriculture has provided a strong enticement to assess the CF for production of different crops. The CF of crop production could be quantified by taking into account the overall GHGs emissions from agricultural inputs used for crop production and protection and farm machinery in a single whole cycle of crop production (Adler et al. Reference Adler, Del Grosso and Parton2007). Carbon footprints have been evaluated for staple crops (Hillier et al. Reference Hillier, Hawes, Squire, Hilton, Wale and Smith2009), under different tillage practices (West & Marland Reference West and Marland2002) and farming systems (Dubey & Lal Reference Dubey and Lal2009) as well as for a bulk sector of crop production in China (Cheng et al. Reference Cheng, Pan, Smith, Luo, Li, Zheng, Zhang, Han and Yan2011). The mean CF of major crops from the UK was reported as 351·7 kg carbon equivalent (CE)/ha/year, 0·75 of which was contributed by nitrogen (N) fertilizer use (Hillier et al. Reference Hillier, Hawes, Squire, Hilton, Wale and Smith2009). Dubey & Lal (Reference Dubey and Lal2009) reported a higher CF for agricultural productions in Punjab, India (22·86 g CE/kg biomass) than that of Ohio in the USA (9·52 g CE/kg biomass). For agricultural practice, the study by West & Marland (Reference West and Marland2002) showed a lower CF in crop production under no-tillage than under conventional tillage in the USA.
China has committed to reduce the emissions per unit of gross domestic production by 25% and implemented a national climate change policy, which demands GHG emission reductions in all sectors. Greenhouse gas emissions from China's agriculture industry have been estimated at 819·97 megatonne (Mt) CO2 equivalents (CO2-eq), accounting for 0·11 of the nation's total emissions in 2005 (NDRC 2012). Characterizing the CF of crop production and the contribution by individual agricultural inputs is fundamental for identifying the key measures and their potentials to mitigate climate change in China's agriculture. In a previous study, a bulk CF of China's crop production sector was estimated at 0·78 t CE/ha/year, with N fertilizer-induced GHG emissions contributing an average proportion of 0·65 (Cheng et al. Reference Cheng, Pan, Smith, Luo, Li, Zheng, Zhang, Han and Yan2011). However, estimating crop and regional-specific CFs would be important for understanding the crop and regional variation and identifying crop and regional-specific mitigation options. The CF information will be critical for policy decisions about how to develop climate-friendly incentives for food consumption and domestic trading between regions as well as to improve management practices.
Paddy rice, wheat, maize and soybean are the major staple crops in China, accounting for almost 0·86 of total arable land area (FAO 2012). In order to meet the food demand by the large and ever-increasing population, production of these crops has been achieved with maximum available input of resources to reach a maximum yield, although the total cropland area has been decreasing since the end of the 20th century (Huang Reference Huang2013). Given that determining a CF of a certain crop is useful for identifying how a low-carbon economy could be implemented to abate climate change, the current study aimed to quantify the CFs of the four staple crops of China. Special attention has been given to the differences in both total CF and contribution by individual inputs between the crops and the regions. In addition, the current study also evaluates GHG mitigation potentials and key measures based on CF reductions.
MATERIALS AND METHODS
Carbon footprint quantification protocol
There have been various versions of the CF concept in the literature (Wiedema et al. Reference Wiedema, Thrane, Christensen, Schmidt and Løkke2008; Dubey & Lal Reference Dubey and Lal2009), although there is no one single definition widely accepted in the CF analysis (Peters Reference Peters2010). However, CF of crop production was generally assessed by taking into account all the GHG emissions caused by or associated with material used, farm machinery operated, and irrigation and drainage power expended for crop production in a crop's life-cycle (Lal Reference Lal2004; Hillier et al. Reference Hillier, Hawes, Squire, Hilton, Wale and Smith2009; Cheng et al. Reference Cheng, Pan, Smith, Luo, Li, Zheng, Zhang, Han and Yan2011). Greenhouse gas emissions from manufacturing of agricultural inputs such as fertilizer, pesticides, herbicides and irrigation, as well as farm machinery used for spraying and tillage, harvesting, packing and transportation were considered for CF calculation of a single crop season, i.e. up to harvest in the current study. In addition, direct nitrous oxide (N2O) emissions from soil induced by chemical fertilizer-N application and methane (CH4) emissions from rice paddy were also taken into account. While there has been increasing concern regarding CO2 emissions due to land use change in CF assessment (Cederberg et al. Reference Cederberg, Persson, Neovius, Molander and Clift2011; Schmidinger & Stehfest Reference Schmidinger and Stehfest2012), potential soil carbon stock changes were not quantified in the current study due to a lack of available data relevant to a specific crop production. Carbon footprints calculated in the current study were expressed in CEs.
Sources of emissions and calculation
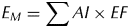
The first GHG emissions calculated were those induced by manufacturing (E M , kg CE/ha) of individual inputs used for crop production, protection and management including fertilizer, pesticides, plastic film and diesel oil for machinery operation, using Eqn (1):
 $$E_M = \sum {AI \times EF} $$
where AI denotes the amount of an agricultural input (kg/ha) and EF is emission factor of manufacturing a unit of the input material (kg CE/kg), which have been reported in previous studies (Cheng et al. Reference Cheng, Pan, Smith, Luo, Li, Zheng, Zhang, Han and Yan2011).
Secondly, the direct N2O emissions (
 $E_{N_2 O} $
, kg CE/ha) induced by chemical fertilizer-N was estimated using Eqn (2):
 $$E_{N_2 O} = N \times EF_{N_2 O} \times \displaystyle{{44} \over {28}} \times 298 \times \displaystyle{{12} \over {44}}$$
where N represents the chemical fertilizer-N application rate (kg N/ha);
 $EF_{N_2 O} $
is the emission factor of N2O emission induced by N fertilizer application (kg N2O–N/kg N fertilizer); 44/28 is the molecular weight of N2 in relation to N2O; 298 is net global warming potential (GWP) of N2O in a 100-year horizon and 12/44 is the molecular weight of CO2 in relation to CE. According to IPCC (Reference Eggleston, Buendia, Miwa, Ngara and Tanabe2006),
 $EF_{N_2 O} $
is estimated as 0·01 for dry cropland and 0·003 for submerged rice paddy.
Thirdly, the annual CH4 emissions from rice paddies were determined for the rice CF calculation. Here the region-specific emission factors (
 $E_{CH_4}\!\!\! $
, kg CE/ha) reported by Yan et al. (Reference Yan, Cai, Ohara and Akimoto2003) were adopted.
The fourth consideration was the energy used for irrigation, which would be one of the main GHG emission sources in farm operations. The main components of energy use associated with irrigation are related to pumping water to the fields, generally using either diesel or electricity (Wang et al. Reference Wang, Rothausen, Conway, Zhang, Xiong, Holman and Li2012). In general, GHG emissions induced by irrigation (E IRRI , kg CE/ha) could be calculated using the approach developed by Wang et al. (Reference Wang, Rothausen, Conway, Zhang, Xiong, Holman and Li2012):
 $$E_{IRRI} = IR_{ij} \times EF_j $$
where IR ij represents the amount of water irrigated for crop i in region j (m3/ha) and EF j is the emission factor of irrigation for region j (kg CO2-eq/m3). The GHG emission factor for irrigation in each province of China has been calculated: the details of this calculation were presented in the study of Wang et al. (Reference Wang, Rothausen, Conway, Zhang, Xiong, Holman and Li2012).
Overall, total CF of the crop in a single cropping season in terms of land used (CF A , kg CE/ha) was assessed by summarizing all of the individual GHG emissions mentioned above:
 $$CF_A = E_M + E_{N_2 O} + E_{CH_4} + E_{IRRI} $$
With the estimated CF A , CF in terms of crop production (CF Y , kg CE/kg product) (carbon intensity in other words) was evaluated using Eqn (4):
 $$CF_Y = \displaystyle{{CF_A} \over Y}$$
where Y denotes the yield of a given crop (kg/ha).
Data sources
Input data for crop production were collected from the national yearbook, which reported crop yields and cropland area, as well as the amounts of various agricultural inputs including fertilizer, pesticides, agricultural plastic film, irrigated water and diesel of the four crop production systems (rice, wheat, maize and soybean) in mainland China and each province of China in 2011. The original data are available from the archives (DP-NDRC 2011; SBS-DRSES 2011; WC-YCWR 2011).
RESULTS
Carbon footprint of the crop production
The CFs both in terms of land used and yield produced for the four major staple crops of China were calculated using Eqns (4) and (5), respectively (Table 1). The highest annual CF was observed for rice production (2472 kg CE/ha cropland and 0·37 kg CE/kg grain), and the lowest for soybean (222 kg CE/ha and 0·1 kg CE/kg product). Wheat has CFs of 794 kg CE/ha cropland and 0·14 kg CE/kg grain, which is higher than maize (781 kg CE/ha and 0·12 kg CE/kg grain).
Comparison of carbon footprint between different crops in China

CF: carbon footprint; CE: carbon equivalent; GHG: greenhouse gas.
Contributions of individual inputs
The proportions of different inputs into CF were calculated to assess the contribution of each input to total CF (Fig. 1). For rice, most (0·69) of the CF was derived from CH4 emissions followed by N fertilizer use (0·16) and irrigation (0·07), whereas a minor contribution (0·08) was seen by all the other inputs and farming operations in rice production.
Contributions of agricultural inputs to total carbon footprint of four crops.

For wheat, maize and soybean, however, N fertilizer contributed 0·80, 0·81 and 0·74, respectively, to the total CF, despite the N fertilizer application rate for soybean being about 0·25 of that for maize and wheat. Irrigation was the second biggest contributor (0·12 and 0·11 in wheat and maize, respectively). A minor contribution (0·03) was derived from pesticide use for wheat and maize production. The contribution of pesticide and irrigation was 0·11 and 0·09, respectively, to total CF.
As shown in Table 2, the regions surveyed were representative of 0·96–0·99 of total cropland, which showed them to be representative of China's crop production. If use of N fertilizers was reduced by 30%, the corresponding reduction in CF could be 6·53, 24·34 and 25·52% for rice, wheat and maize production, respectively.
Reduction in carbon footprint and greenhouse gas (GHG) emissions in surveyed regions when nitrogen application is reduced by 30%

CFY, carbon footprint in production.
Regional variations of carbon footprints of the four crops
Carbon footprints of four crops were calculated in different provinces of China (Fig. 2). The calculated province CF ranged from 0·14 to 0·48, 0·06 to 0·26, 0·07 to 0·18 and 0·02 to 0·18 kg CE/kg product for rice, wheat, maize and soybean, respectively. The highest CFs of rice, wheat and maize were observed in Yunnan province, with values of 0·48, 0·26 and 0·18 kg CE/kg grain; however, Heilongjiang province had the lowest CF for wheat and maize production (0·06 and 0·07 kg CE/kg grain), and the lowest CF for rice production (0·14 kg CE/kg grain) was found in Jilin province. The highest and lowest CFs in soybean production were observed in the provinces of Shaanxi and Chongqing (0·18 and 0·02 kg CE/kg product, respectively).
Regional variation in carbon footprint of crops (a) rice; (b) wheat; (c) maize; (d) soybean (unit of carbon footprint is kg CE/kg grain).

Most of the CF in paddy rice production was derived from CH4 emissions followed by N fertilizer use. For regional variation, the contribution of CH4 emissions varied from 0·29 in Heilongjiang to 0·81 in Chongqing, and N fertilizer contributions varied from 0·10 in Guizhou to 0·37 in Ningxia. Furthermore, CH4 emissions could explain 0·69 of the variation in the CF across provinces for paddy rice production (Fig. 3).
Correlation of total carbon footprint (CF) with methane (CH4) emissions and nitrogen (N) applications in (a) rice; (b) wheat; (c) maize; (d) soybean production.

For the contributions of various agricultural inputs to total CF of wheat, the contribution of N fertilizer varied from 0·67 in Shanxi to 0·92 in Heilongjiang. Meanwhile, 0·86 to 0·93 of the variation in the CF across provinces for dry crop production could be explained by N fertilizer application (Fig. 3). In addition, the partial factor productivity from applied N (PFPN) varied from 14·16 to 51·87 kg/kg N in different regions of China (Fig. 4). Irrigation also made significant contributions, varying from 0·00 in Heilongjiang to 0·27 in Hebei. For maize, N fertilizer made the largest contribution, from 0·67 in Gansu to 0·96 in Guangxi, and the contribution of irrigation varied from 0·00 in Hubei, Guangxi, Chongqing and Guizhou to 0·22 in Shanxi. For soybean, the largest contribution was found for N fertilizer in each province, which varied from 0·60 in Henan to 0·95 in Shaanxi. Irrigation also made a significant contribution, varying from 0·00 in Chongqing to 0·30 in Hebei.
Partial factor productivity from applied nitrogen (PFPN) of (a) rice; (b) wheat; (c) maize production in different provinces of China.

DISCUSSION
Greenhouse gas emission cost of crop production in China
According to the Second National Climate Change Assessment Report, GHG emissions in China have been estimated at 7467 Mt CO2-eq in 2005, which accounted for 0·11 of the total national GHG emissions (NDRC 2012). Total annual GHG emissions due to production of the four crops were estimated at 441·42 Mt CO2-eq, which accounted for almost 0·06 of the nation's total emissions in 2005. This indicated that crop production played a significant role in China's GHG emissions. An area-weighted mean CF of dry crops (i.e. wheat, maize and soybean) was calculated as 713 kg CE/ha according to the current results, which showed a higher CF crop production in China than in the UK, without paddy rice (estimated at 351·7 kg CE/ha by Hillier et al. Reference Hillier, Hawes, Squire, Hilton, Wale and Smith2009). Specifically, CF of wheat in China was estimated in the current study at 794 kg CE/ha and 0·14 kg CE/kg grain, which seemed much higher than for the UK at 388 kg CE/ha (Hillier et al. Reference Hillier, Hawes, Squire, Hilton, Wale and Smith2009) and Canada at 0·09 kg CE/kg grain (Gan et al. Reference Gan, Liang, Campbell, Zentner, Lemke, Wang and Yang2012). Due to the N-fixing ability of legume crops, the N fertilizer application rate for soybean production was 54·42 kg N/ha: much lower than that for wheat and maize production (being 210·92 and 209·26 kg N/ha in China). The low N application rate resulted in a much lower CF for soybean production (222 kg CE/ha) compared to wheat (794 kg CE/ha) and maize (781 kg CE/ha). Hillier et al. (Reference Hillier, Hawes, Squire, Hilton, Wale and Smith2009) also indicated a low CF in leguminous crop production compared to other crops; however, the CF of soybean in China was still much higher than the CF of legumes in the UK at 125 kg CE/ha (Hillier et al. Reference Hillier, Hawes, Squire, Hilton, Wale and Smith2009). Rice production in China had a CF of 0·37 kg CE/kg grain, close to the value estimated by Pathak et al. (Reference Pathak, Jain, Bhatia, Patel and Aggarwal2010) who reported a CF of 0·333 (rice) and 0·413 kg CE/kg grain (basmati rice) in India. The estimated crop-specific CF in the current study shows that China has a higher CF for dry crop production than the developed countries, which implies an opportunity to understand and formulate GHG mitigation strategies for farming management practices in China.
According to the results, 0·69 of rice CF was derived from CH4 emissions, and a correlation of CH4 emissions v. CF in different provinces had an R 2 of 0·85, demonstrating the sensitivity of CF to CH4 emissions in rice production. Methane has been ranked as the second highest radiative force among the long-lived GHGs after CO2, and rice paddies account for c. 0·32 of agricultural CH4 emissions in China (Schimel Reference Schimel2000; Smith et al. Reference Smith, Martino, Cai, Gwary, Janzen, Kumar, McCarl, Ogle, O'Mara, Rice, Scholes, Sirotenko, Metz, Davidson, Bosch, Dave and Meyer2007; NDRC 2012). The results of simulations by Zhang et al. (Reference Zhang, Bian, Pan, Cui, Hussain, Li, Zheng, Zheng, Zhang, Han and Yu2012) showed that CH4 emissions from irrigated rice cultivation in China will increase by 14% by 2040 compared with that in 2009, due to global warming and high crop residue retention, which is indicative of the important role of CH4 emissions in the GHG mitigation of rice agriculture. As indicated in the current results, a reduction of 10% in CH4 emissions could reduce the total CF by nearly 9·8%. To address this issue, proper field management, e.g. promoting water use efficiency and selecting rice varieties, should be developed for rice paddies in the future.
In 2012 it was reported by Xinhua net (2013) that the cultivation areas of rice, wheat and maize were increased but that of soybean decreased, especially in Heilongjiang. However, the total cropland area would expand in Northeast China due to warming. Maize cultivation has been forecast to extend in this area, which could result in soil organic carbon loss due to wetter soil becoming dry cropland. This must be accounted for in future assessments (Cederberg et al. Reference Cederberg, Persson, Neovius, Molander and Clift2011; Schmidinger & Stehfest Reference Schmidinger and Stehfest2012), particularly for Heilongjiang province. Hence, the changes of crop production structure will affect the GHG emissions induced by crop production in China in the future.
Nitrogen fertilizer induced emissions and the reduction potential
Averaging the contributions of N fertilizer to the total CF in the three dry crops, the relative mean proportion of 0·78 was close to the mean proportion of 0·75 in UK cropland (Hillier et al. Reference Hillier, Hawes, Squire, Hilton, Wale and Smith2009). China is currently the largest consumer of N fertilizers in the world. In the last 20 years (1992–2011), annual N fertilizer application increased from 17·56 to 23·81 Mt (a 36% increase) (SBS-DRSES 2011). Kahrl et al. (Reference Kahrl, Li, Su, Tennigkeit, Wilkes and Xu2010) calculated a specific emission factor range of 15–31 t CO2-eq/t N for China's N fertilizer manufacturing and application, and implied that synthesized N fertilizer application could lead to total emissions of 400–840 Mt CO2-e, equivalent to 0·08–0·16 of China's energy-related CO2 emissions in 2005. In the current study, synthesized N fertilizer application in four crop production systems showed the total emissions of 181 Mt CO2-e, equivalent to 0·20–0·50 of GHG emissions from China's N fertilizer manufacturing and application. Meanwhile, environmental problems related to overuse of N fertilizers have become more serious. For example, excess N entering water bodies can negatively affect the quality of drinking water and may cause eutrophication (Ju et al. Reference Ju, Xing, Chen, Zhang, Zhang, Liu, Cui, Yin, Christie, Zhu and Zhang2009). Large inputs of synthetic N fertilizer could also lead to acid rain and soil acidification (Guo et al. Reference Guo, Liu, Zhang, Shen, Han, Zhang, Christie, Goulding, Vitousek and Zhang2010). Therefore, improving N use efficiency and avoiding overuse of synthetic N fertilizer would be a key issue for China's agriculture, not only for the sake of mitigation but also for the environmental quality of China.
The rapid increase of synthetic N fertilizer application resulted in a decrease of the PFPN from 55 to 20 kg yield/kg N fertilizer from 1977 to 2005 (Ju et al. Reference Ju, Xing, Chen, Zhang, Zhang, Liu, Cui, Yin, Christie, Zhu and Zhang2009). Dobermann (Reference Dobermann2005) stated that PFPN with 40–70 kg/kg N is appropriate for N use in crop production; however, PFPN of many provinces were much lower than the appropriate range suggested by Dobermann (Reference Dobermann2005). In addition, it has been suggested that China's agriculture has considerable potential to reduce existing synthetic N fertilizer applications by 30–50% without reducing crop production (Ju et al. Reference Ju, Xing, Chen, Zhang, Zhang, Liu, Cui, Yin, Christie, Zhu and Zhang2009; Cheng et al. Reference Cheng, Shi and Wen2010). Given this option, CF reductions for four crops in different provinces were calculated on the basis of reducing N application rate by 30%. The reduction of CF under a 30% reduction in N fertilizers could total 57·46 Mt CO2-eq in the surveyed regions of China. As indicated by Cheng et al. (Reference Cheng, Ogle, Parton and Pan2014) who simulated the GHG mitigation potentials for Chinese cropland by the DAYCENT ecosystem model, N saving could be a key option for cutting down crop-production-induced emissions. Thus, improving N use efficiency in crop production would be a key option for both saving farmers’ cost for unit crop production and mitigating climate change. Some techniques and strategies have been developed recently to improve N use efficiency and reduce N fertilizer application. For example, recommended fertilization has been initiated with a national project to greatly reduce N use and to balance nutrients, mainly with combined organic/inorganic fertilization in China (MOA 2011). Biochar amendments in agricultural soils have been shown to reduce N loss through reducing N2O emissions and nitrate leaching (Sohi et al. Reference Sohi, Krull, Lopez-Capel and Bol2010; Zhang et al. Reference Zhang, Bian, Pan, Cui, Hussain, Li, Zheng, Zheng, Zhang, Han and Yu2012), which is beneficial for reducing N losses from agriculture.
Overall, the production of rice, wheat, maize and soybean in China shows carbon footprints of 0·37, 0·14, 0·12 and 0·10 kg CE/kg product, respectively, mainly due to N fertilizer inputs, and in particular CH4 emissions from flooded paddy rice. There was a large regional variation for crop CF, mainly in N input rates in dry crop production and CH4 emissions in rice production. Quantification of soil carbon change due to land used would be required to characterize the impact of crop cultivation structure change on overall CF of a crop in the future. Nevertheless, the present study highlights opportunities for GHG mitigation by improving N fertilizer use and reducing paddy rice CH4 emissions of crop production in China. Finally, the current work may be relevant for policy with governmental incentives to achieve low CF in crop production and food consumption as well as regional trading in China's future economy.
This study was partially supported by the National Natural Science Foundation of China under a grant numbers 40830528 and 41371300, Science and Technology of China under a grant number 2013BAD11B01, CDM center, Ministry of Finance under a subcontract grant number 0810010, and the Ministry of Agriculture China under the UK–China Sustainable Agriculture Innovation Network (SAIN). PS is a Royal Society-Wolfson Research Merit Award and a UK BBSRC China Partnership Award holder.



