


1. Introduction
The arctic has been the focus of many climate-change Studies because change Signals are expected to be amplified in the ice-covered region primarily through the ice–atmosphere albedo feedback (Reference Holland and BitzHolland and bitz, 2003). Satellite data have been used to Show declines in the extent and area of the hemispherical Sea-ice cover, but the rate had been quite modest at about 2–3% decade–1 (Reference Parkinson, Cavalieri, Gloersen, Zwally and ComisoParkinson and others, 1999). also, analysis of available (though Sparse) Submarine upward-looking Sonar data from the 1950s to the present has revealed Substantial reductions in average ice thickness in the central arctic (Reference Rothrock, Yu and MaykutRothrock and others, 1999; Reference Wadhams and DavisWadhams and davis, 2000). however, the most intriguing Signal in the region So far is the relatively rapid decline in the area of the arctic perennial Sea ice, now estimated at 9.8% decade–1 from 1978 to 2005 (Reference ComisoComiso, 2006). a good understanding of this phenomenon is very important Since the perennial Sea ice consists mainly of thick multi-year ice floes that are the mainstay of the arctic Sea-ice cover.
The characteristics of the perennial Sea-ice cover can be Studied quantitatively with reasonably good accuracy using Satellite passive microwave data. the extent and area of the perennial ice are estimated quantitatively from microwave data at the end of the Summer melt in mid-september (i.e. during the ice-cover minimum) when the ice Surface has largely dried up and its microwave emissivity is relatively Stable (Reference ComisoComiso, 2002). this circumvents difficulties associated with the highly variable Signature of ice during the midsummer period due to the extensive presence of melt ponds and wet ice and Snow. during the ensuing winter, the Spatial extent and distribution of perennial ice undergo changes associated with environmental factors Such as Storm activity, wind circulation, ocean current and tides. it is important to monitor Such changes, as they provide a key to a better understanding of the processes that lead to the distribution of perennial ice in the Subsequent Summer. in this paper, we take advantage of known differences in the microwave Signatures of first-year (FY) ice and the older ice types to gain insight into the changing arctic ice cover. we exploit the multichannel capability of Satellite passive microwave Sensors to examine possible discrimination of different ice types with a view to retrieving proxy ice-thickness information in order to understand why the perennial ice is declining So rapidly. this would also enable improved interpretation of ice-thickness information derived from Submarines and other Satellites (e.g. icesat and a possible cryosat follow-on).
2. Multichannel Microwave Signature of Arctic Ice Types
Indigenous arctic inhabitants (e.g. inuits) have been using multi-year ice as a Source of drinking water for millennia, also knowing that Seasonal ice is too Salty to be used for the Same purpose. the decrease in ice Salinity with ice age is also responsible for the Significant contrast in the passive microwave Signatures of arctic FY and multi-year ice (Reference Vant, Gray, Ramseier and MakiosVant and others, 1974). because of the relatively high Salinity content of FY ice, the imaginary part of its dielectric constant is relatively high, causing the material to be opaque or lossy. as a result, the microwave Signal largely comes from the upper Surface layer of the ice (<1 cm) and is Subject to little or no volume Scattering. this in turn causes the effective emissivity of FY ice to be relatively high. on the other hand, Since arctic multi-year ice is fresh ice, its absorption coefficient is low and it is relatively transparent to microwave radiation. the observed microwave Signal thus emanates from a depth of Several tens of centimeters from the ice Surface (under cold/dry Snow conditions), and a large fraction of this Signal is Scattered primarily by air pockets and other inhomogeneities within the ice. the effective emissivity of multi-year ice is therefore low compared to that of FY ice. in essence, this explains why the brightness temperature of multi-year ice can be So much lower than that of FY ice. Since the efficiency of Scattering depends on the wavelength of the radiation and the Size (and number) of Scatterers, the emissivity of multi-year ice is also relatively low at frequencies in which the wavelength of the radiation is comparable to the Size of the Scatterers. while the emissivity of FY ice is relatively well defined, however, that of multi-year ice is much more variable because the Size and number of Scatterers within the ice exhibits wide Spatial variability depending on the ice history (Reference GrenfellGrenfell, 1992).
Fy ice that Survives the Summer becomes Second-year ice. during the Summer, the desalination process is accelerated, but the efficiency of the process depends on temperature and porosity which may vary from region to region and from one year to another. the Salt content of Second-year ice may thus be different from that of the older ice types and it is reasonable to expect that the Signature of Second-year ice is also different from that of the older ice types. Such a phenomenon has actually been observed previously (Reference Tooma, Mennella, Hollinger and KetchumTooma and others, 1975).
2.1. Time-series Studies of ice Signatures
Although arctic perennial Sea ice has been declining rapidly Since 1978, the interannual variability has been large, as indicated in figure 1a. the plots Show a Slowly declining perennial ice cover in the 1980s, a Sudden drop from 1989 to 1990, a large interannual variability from 1991 to 1997 and a more monotonic decline from 1998 to the present. regarding the interannual variability observed in the 1990s, an increase in perennial-ice area from one year to another can only happen if the production of Second-year ice exceeds the loss of multi-year ice through melt and advection out of the central arctic basin (e.g. through fram Strait). on the other hand, a decrease in perennial ice cover implies decreases in both Second-year ice and older ice types. repetition of this process as observed from 1991 to 1997 would lead to increases in the fraction of Second-year ice floes which are generally thinner than the older ice types. it is intuitive to postulate that the decreases in the extent and area of the perennial ice Since 1997 are in part due to the presence of a larger percentage of Second-year ice which is more vulnerable to Summer melt than the older and thicker ice types. we use passive microwave data to gain insights into this phenomenon.
(a) Extent and area of the perennial ice cover from 1979 to 2005, and results from trend analysis; (b) ice concentration map during ice minimum in 1995; (c) ice concentration map during ice minimum in 1996; and (d) difference of the ice concentration maps of 1996 and 1995.
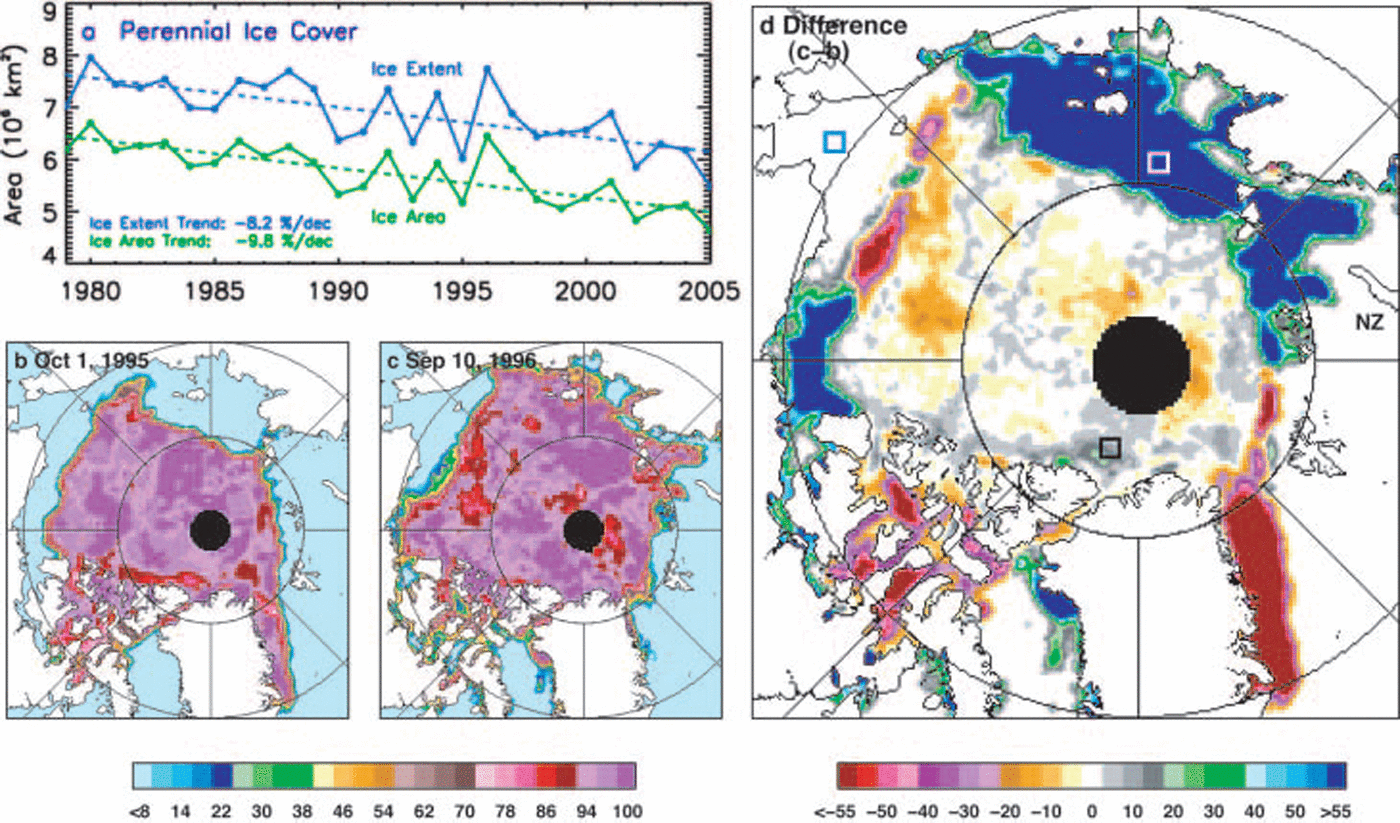
A key factor in resolving these issues is the unambiguous discrimination and monitoring of Second-year ice. this is a difficult task given the morphological Similarity between Second-year and multi-year ice. in this Satellite-based Study, we examine time periods when the production of Second-year ice appeared to be high. we refer to the big increase in the perennial ice area from 1995 to 1996 as Shown in figure 1a. ice-concentration maps during minimum (summer) ice extents in 1995 and 1996 are Shown in figure 1b and c, respectively, while a color-coded map of the difference is presented in figure 1d. the difference map clearly indicates regions where the ice cover has advanced considerably (i.e. blues and greens) from the previous year. using Satellite infrared data, it was also observed that the Same general areas underwent anomalously cold temperatures during the winter period from late 1995 to early 1996 (Reference Comiso, Yang, Honjo and KrishfieldComiso and others, 2003). Such cold temperatures may have facilitated ice growth and allowed ice in the region to grow thick enough to be able to Survive the Summer melt. although the blue area may also have multi-year ice floes advected to the region, the wind circulation during this period was generally towards the east Several months before September 1996.
The average brightness temperatures (T B) within a 5 by 5 pixel Study area (white box in fig. 1d) located in the blue region (which we will assume to represent Second-year ice) as well as those in the Seasonal and traditionally multi-year ice regions (see green and black boxes) were calculated on a daily basis from September 1996 through march 1997. the results are plotted in figure 2a–c, for 37 ghz(v), 37 GHZ(h) and 19 GHZ(v), respectively, with v and h indicating that the channels are either vertically or horizontally polarized. the plots in blue lines, which represent the Seasonal region, have open-water Signatures in September, but during freeze-up the Signatures at all three frequencies quickly increased to the typical FY ice Signature in early december. the plots for multi-year ice (black line) Show that from September through march the Signatures are considerably lower than those of FY ice and appear almost constant during the entire period, indicating the Stability of the Signature in the region. the Signatures of Second-year ice (red line) are Shown to be higher than those of multi-year ice and lower than those of FY ice during autumn–winter, after a Slight increase at both 37 GHZ(v) and 37 GHZ(h) in mid-november. the values for the 19 GHZ(v) channel also went up, but earlier than those of the other frequency. Some fluctuations in the T B for ice-covered Surfaces at all channels are evident and may be caused by lead formation due to tides, wind and Storms, and/or by Sudden changes in Surface temperature. because the ice cover is dynamic, variations in T B may also be caused by the advection of ice floes into and out of the Study region. given that the typical ice-drift velocity is about 8 kmd–1 (Reference KwokKwok, 2004), with directional variability, and that the Size of the Study areas is 125 by 125 km, the effect of dynamics has to be gradual Since it would take a few weeks for an ice floe to be advected in and out of the Study box.
Plots of daily brightness temperatures in three Study areas (see boxes in Fig. 1d) for the period 1996–97 for (a) 37 GHZ(V); (b) 37 GHZ(H); and (c) 19 GHz(V). The Study areas are in the Seasonal Sea-ice region (blue curve), probable Second-year ice region (red curve) and multi-year ice region (black curve).
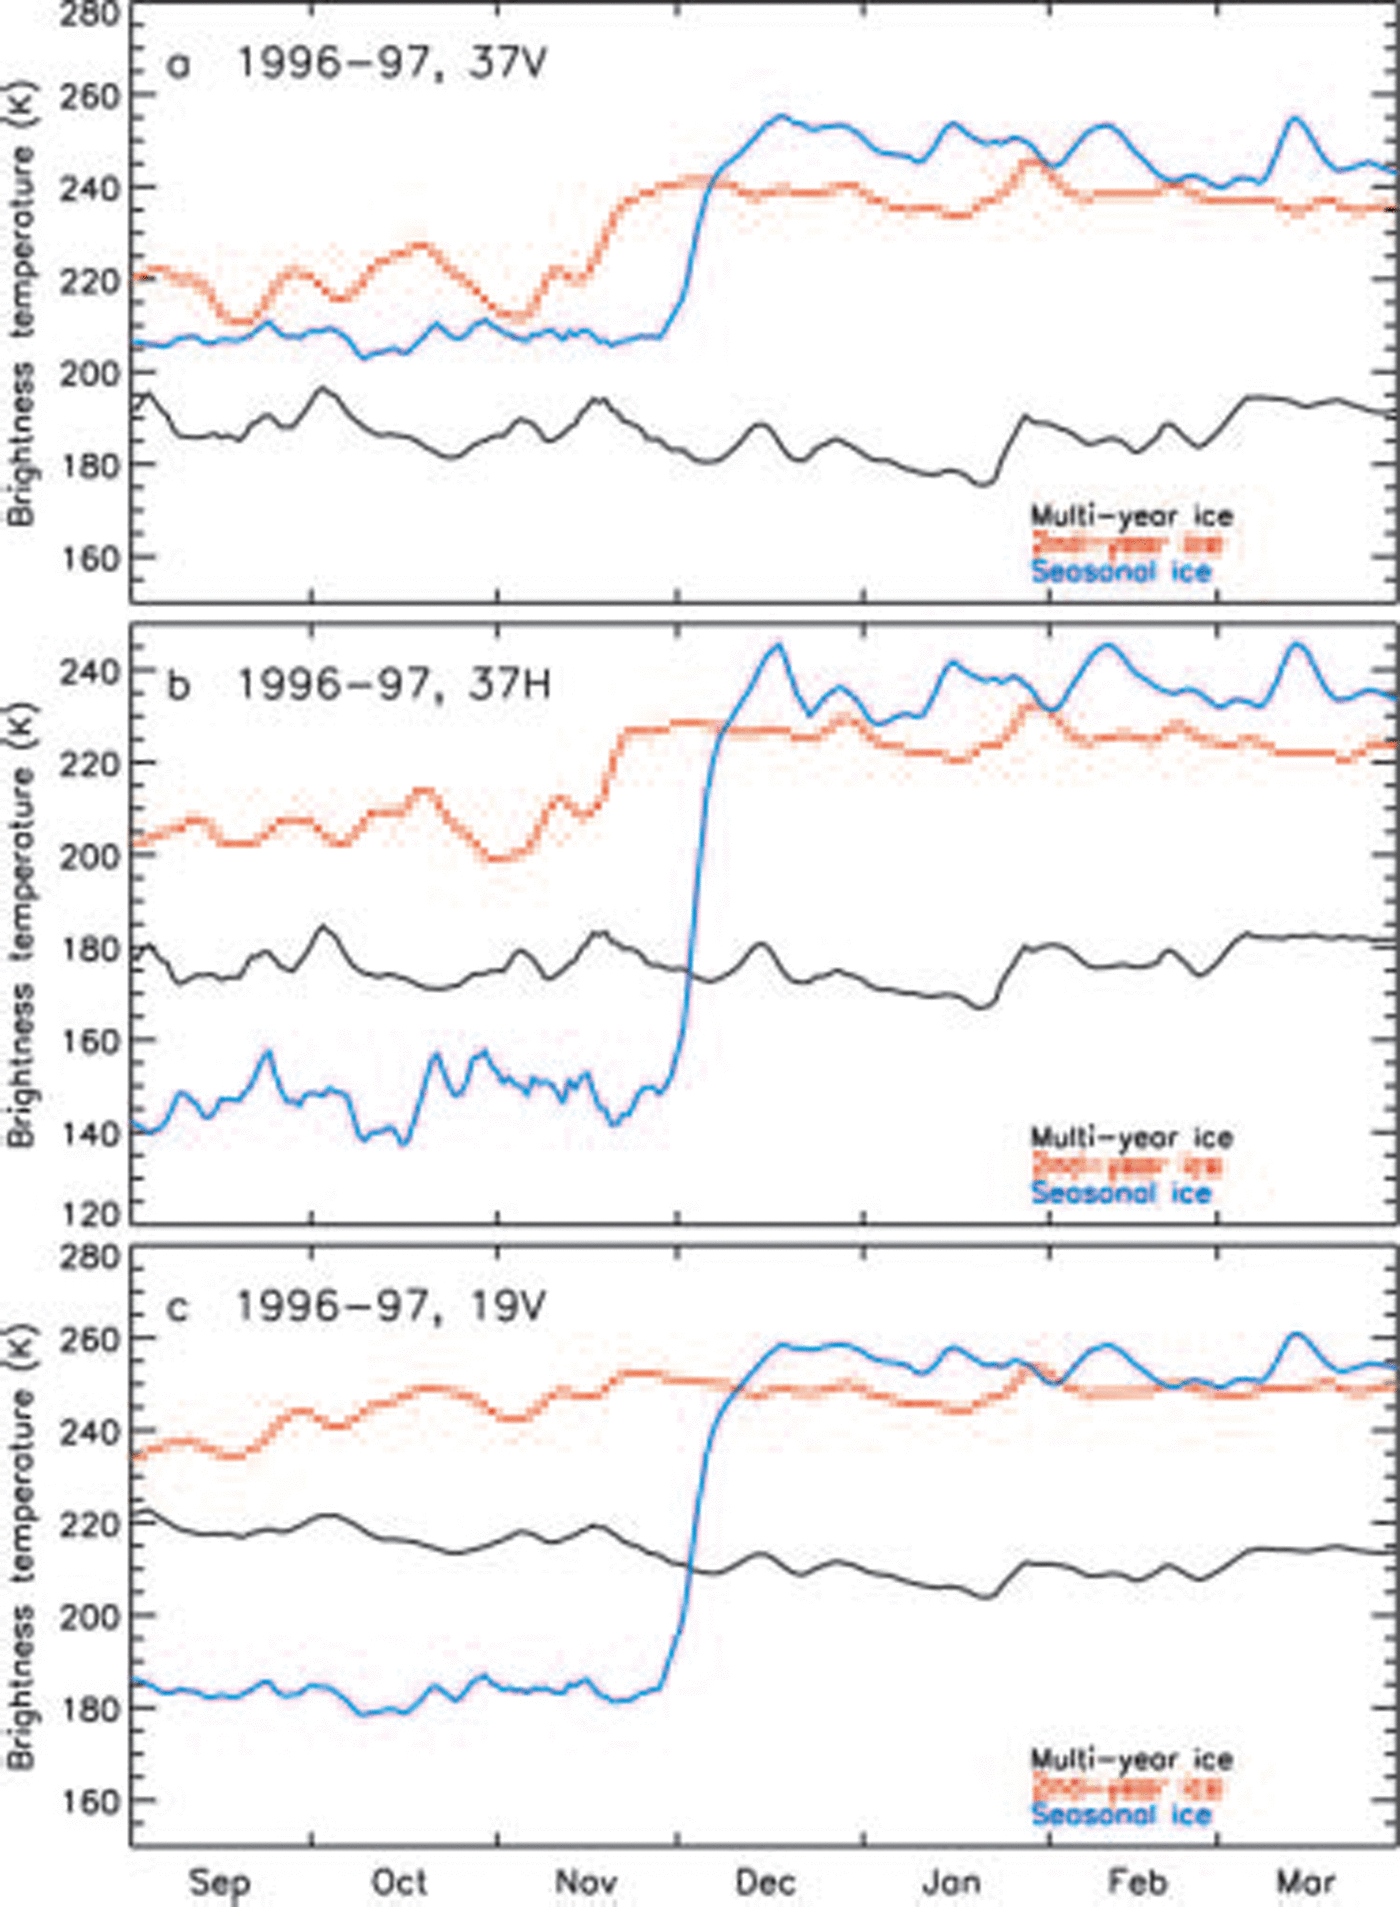
That the Signature of Second-year ice remains considerably higher than that of the older multi-year ice, yet resembles that of FY ice during the winter months, agrees with previous observations (Reference Tooma, Mennella, Hollinger and KetchumTooma and others, 1975) and is an indication that the desalination process takes more than one Summer. this may also explain observed discrepancies in the areal extents of the perennial ice cover and the derived multi-year ice cover in Subsequent winters (Reference KwokKwok, 2004). the Slight increase in the T B for Second-year ice (red line) during the winter period may be attributed to warmer ice Surface temperature if the ice Surface becomes warmer as it acquires a Snow cover. however, a Similar increase is not observed for multi-year ice (black line), in part because the latter is thicker and the effect of warmer temperatures in the underside of the ice is less. an alternative explanation is the introduction of new and young ice during the freeze-up period. being near the ice edge in the Summer, the Study region undergoes cyclical divergence, leading to the formation of large leads, the refreezing of which will cause an increase in the concentration of FY ice. associated Strong winds could also directly impact the Signature of Second-year ice by causing flooding through the Snow–ice interface as the floes are tilted by the wind. Since Second-year ice floes are generally thinner and have Smaller freeboards than multi-year ice floes, they are more Susceptible to flooding than the older ice types. the intrusion of Sea water onto the Snow–ice interface would increase Surface Salinity and therefore the brightness temperature of the Surface, following the above discussion.
It is also interesting to note that in each Study area the time variation in Signatures at the various frequencies and polarizations is highly correlated, although the magnitude of change is not the Same. it is apparent that the increase in the T B of Second-year ice at 19 GHZ(v) is more gradual and Started earlier that those of the 37 ghz channels. the overall increase in T B may thus be a combination of Separate events that Started early but was not Sensitive enough to the 37 ghz radiation until mid-november.
For comparison, an example Showing a more modest increase in the perennial ice cover Such as that from 2002 to 2003 was also analyzed. the ice concentration during the ice minimum extent in 2002 is Shown in figure 3a, while the brightness temperatures at 18GHZ in a Subsequent winter month (march 2003) are Shown in figure 3b. in this case, 18 ghz advanced microwave Scanning radiometer (AMSR) data are used to take advantage of the higher resolution compared with Special Sensor microwave/imager (SSM/I) data. the outline of the multi-year ice pack is apparent in figure 3b as a reduction in brightness temperature, which decreases towards the north. it is also apparent that the effect of ice drift in this case is relatively minor Since the location of the multi-year ice pack in march is generally Similar to that of the perennial ice as detected in the previous Summer (fig. 3a). the ice concentration during the ice minimum in 2003 is Shown in figure 3c and indicates the presence of Significantly more ice towards novaya zemlya (marked nz in fig. 3d) than in 2002. the difference map Shown in figure 3d again provides a quantification of the extent of the ice ‘advance’ (in blue) towards the region. the time Series of T B images provides a means to monitor large-scale changes in the location (and/or movement) of the multi-year ice cover. the march image in figure 3b and Subsequent images indicate that it is unlikely that multi-year ice had been advected into the Second-year ice (blue) region. the general region was again the Site of anomalously cold temperatures during the winter months as indicated by us national oceanic and atmospheric administration (noaa) Satellite advanced very high resolution radiometer (AVHRR) thermal infrared data in figure 3e and f. the region, which is usually a Seasonal ice region, is therefore a likely candidate for FY ice to become thick enough to Survive the Summer melt. it is thus plausible that the area of ice advance (in blue) in figure 3d is mainly covered by Second-year ice floes in 2003. the average brightness temperatures of a 5 by 5 pixel area in the middle of the blue region from September to march are presented in figure 4, together with those from the Seasonal and multi-year ice regions identified in figure 1. in this case, the Signature of the Second-year ice is even closer to that of the FY ice Signature and overlaps with that of the latter in mid-winter. this makes the Second-year ice Signature identical to that of FY ice, assuming that contamination of the Signal in the former is negligible. we have no additional information to confirm that the latter is true.
(a) Ice concentration map during ice minima on 11 September 2002; (b) brightness temperature map at 18 GHz(V) for 1–7 March 2003; (c) ice concentration map during ice minima on 18 September 2003; (d) difference map of the ice minima in 2003 and 2002; (e) monthly map of Arctic Surface temperature from AVHRR thermal-infrared (TIR) data in January 2003; and (f) monthly map of Surface temperature from AVHRR TIR data in March 2003.

Plots of daily brightness temperatures in three Study areas for the period 2003–04 for (a) 37 GHZ(V); (b) 37 GHz(H); and (c) 19 GHz(V). The Study areas are in the Seasonal region (blue curve), probable Second-year ice region (red curve) and multi-year ice region (black curve). (a) and T B(18V) vs T B(37V) vs T B(37H) in April 1994 (b). The clusters identified are in different colors and correspond to what are likely Seasonal ice (pink), predominantly Second-year ice (blue), multi-year ice of type C (gold) and multi-year ice of type D (green).

2.2. Cluster analysis
The time-series Study presented in Section 2.1 indicates that although the Signature of Second-year ice is intermediate between that of multi-year and FY ice, it may not be distinct enough to enable unambiguous discrimination of this ice type during the winter period. it is, however, encouraging to note that the Signature of the older multi-year ice appears to be Stable throughout the winter period. we next exploit the multichannel nature of the Satellite data to resolve different multi-year ice types within the consolidated ice region of the arctic in winter. figure 5a Shows a three-dimensional (3-d) Scatter plot of T B data in march 2003 using the 19 GHZ(v), 37 GHZ(v) and 89 GHZ(v) channels. the respective two-dimensional (2-d) projections of the main 3-d plot are also Shown. the data points that represent consolidated ice regions are the relatively compact clusters labeled a–d and colored pink, blue, gold and green, respectively. Similar clustering patterns in the arctic region during winter have been noted previously by Reference Comiso and KwokComiso (1995). the unique clustering of the data points and their reappearance in the Same general locations in the 3-d plots every winter period is a Strong indication that they represent Surface (not the atmospheric) properties and that data from the Same cluster are likely associated with Similar types of Surfaces. we already know that data points in cluster a represent FY ice types or ice located in the Seasonal Sea-ice region. because of proximity to the FY ice cluster and following Reference Tooma, Mennella, Hollinger and KetchumTooma and others (1975) and the aforementioned discussion, we postulate that data points in cluster b correspond to areas dominated by Second-year ice floes. clusters c and d are also postulated to represent the older multi-year ice types.
Scatter plots of T B(18V) vs T B(37V) vs T B(89V) in March 2003
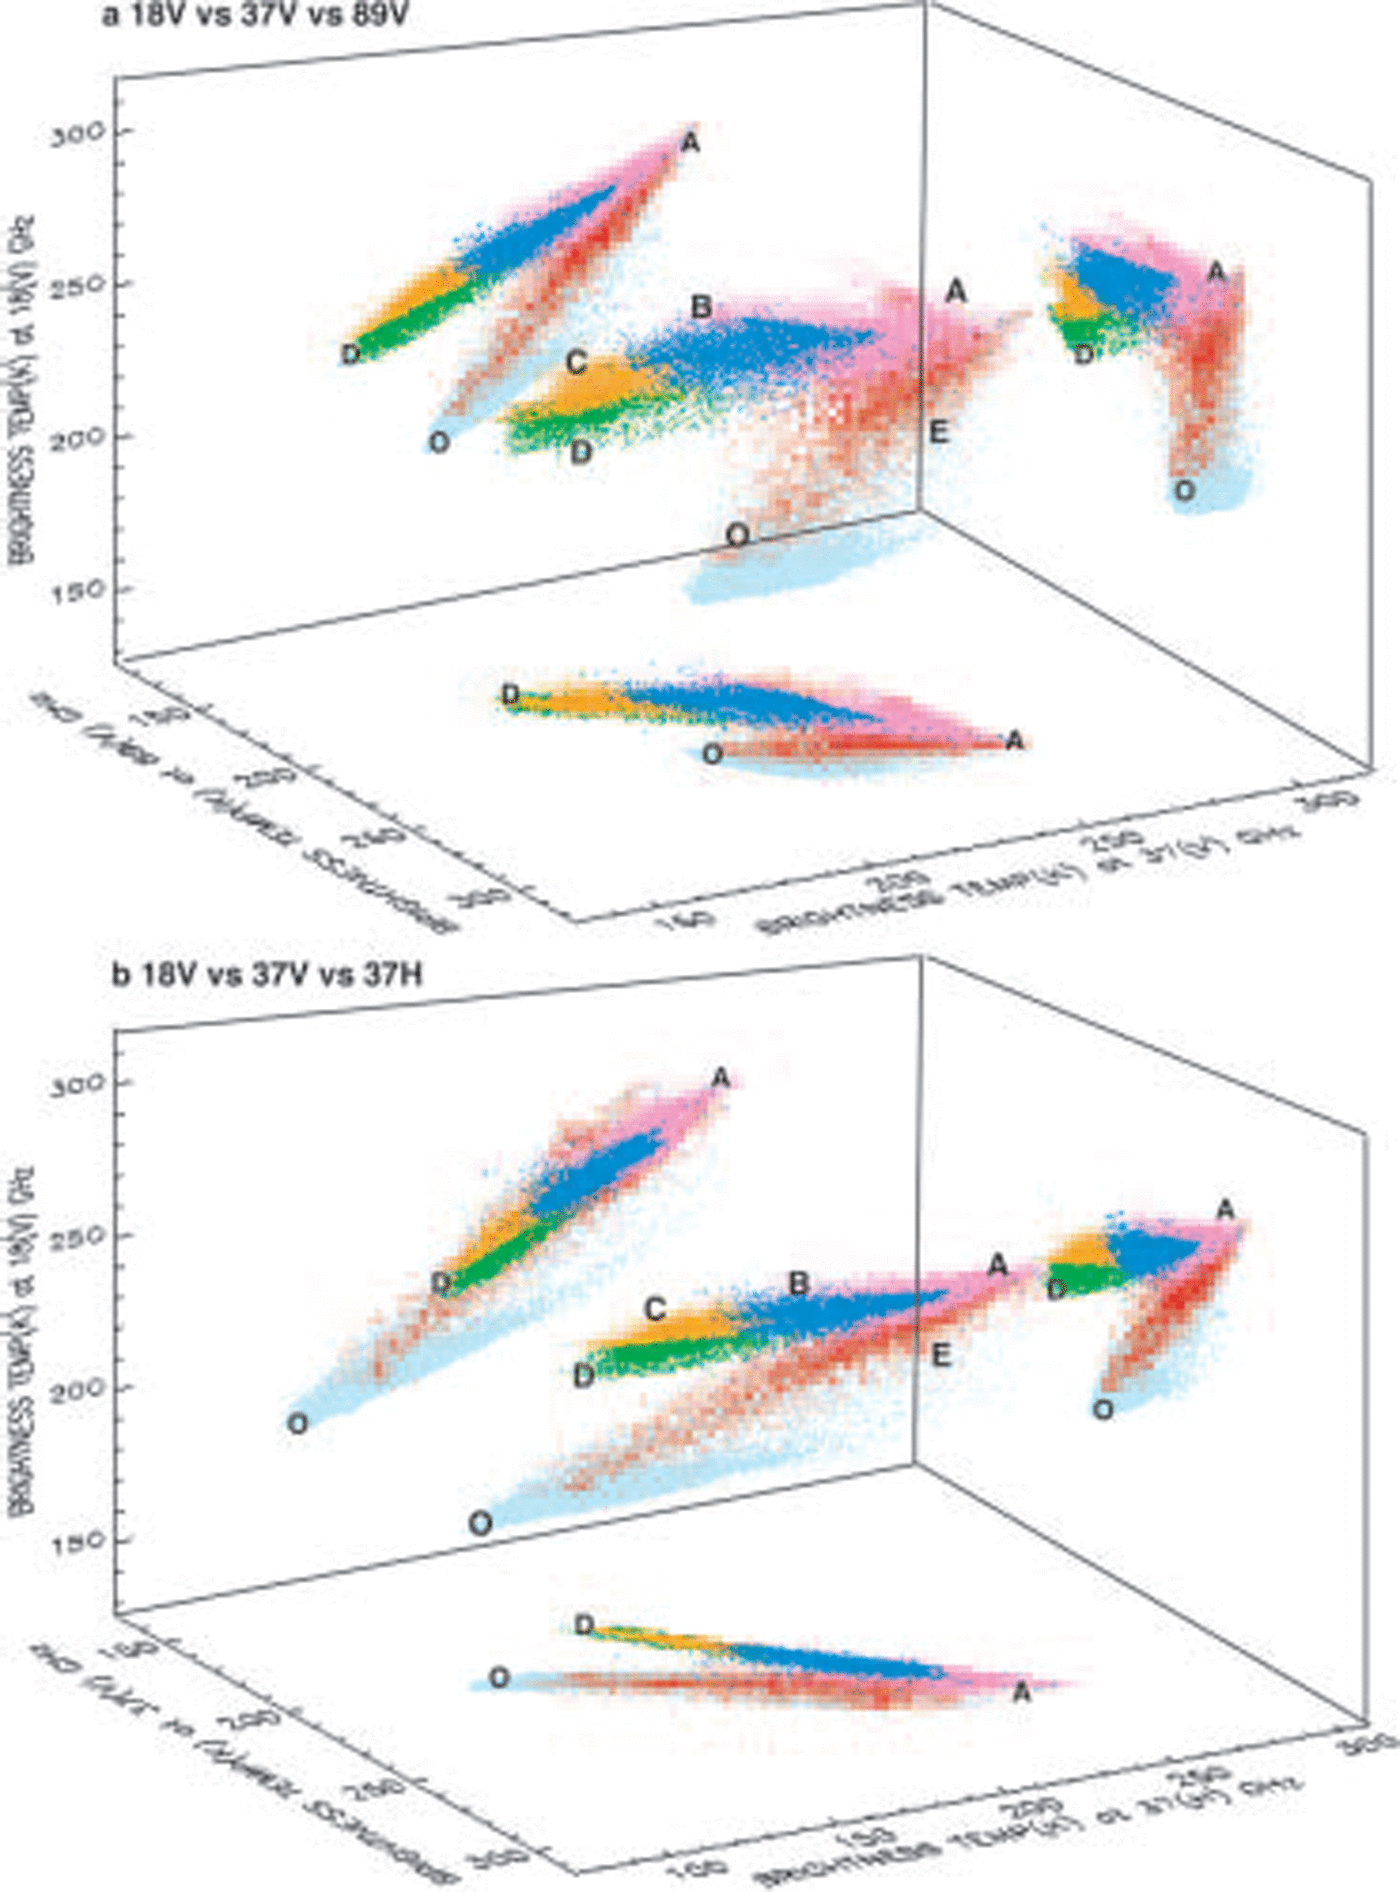
By virtue of their location, we also postulate that the data points in c are relatively younger than those in cluster d. data points corresponding to the d cluster are actually located in the area north of greenland and the canadian arctic archipelago and where the oldest ice types (6 years and older) are expected to be found (Reference Colony and ThorndikeColony and thorndike, 1985). if Scattering is the primary mechanism for the different Signatures, it makes Sense that the emissivity of data points in cluster b is lower than those in cluster a while those of c and d are lower than those of b. the ageing process usually leads to alterations in the Size and number of air pockets, which are the primary Scatterers within the ice. for completeness, the other data points have been labeled e (red), representing new ice and/or mixtures of thick ice and open water, and o (light blue), representing open water. also, for comparison, the Same data are plotted in figure 5b, but using a combination of a different Set of channels. in this case, 37(h)ghz data are used instead of 89(v)ghz data. the Same four clusters identified in figure 5a are also revealed in these data, although the cluster Separation is less distinct. this provides the potential of extending the analyses to Scanning multichannel microwave radiometer (SMMR) data.
In 3-d Space, the clusters resemble ellipsoids, with the x, y, z axes representing the variability in each of the channels. it appears that the axis with the highest variability corresponds to the channel with the highest frequency to confirm that the main cause of variability is Scattering. the Size and variability of clusters representing each ice type are no more compact than those Shown because of Spatial variability in the characteristics of the ice cover including its Snow cover and temperature. it is apparent, however, that the right Set of channels must be used for optimal Separation of the clusters.
To illustrate how the passive microwave multichannel data can be utilized for ice-type mapping of the arctic region, figure 6a is a color-coded map (which we call a cluster map) representing radiometrically different ice types based on the different clusters identified in figure 5. the four distinct clusters for consolidated ice are represented in the expected geographical locations, with cluster a data points (in pink) being mainly located at the Seasonal ice region, cluster b data points (blue) at the periphery of the perennial ice area and clusters c (gold) and d (in green) data points in the interior of the pack where the older ice types are expected. the distribution of radiometrically distinct ice types as presented in figure 6a provides an added dimension in the Study of arctic Sea ice. having the ability to generate Such maps consistently would provide a powerful means of monitoring different types of multi-year ice cover and gaining insight into the cause of the observed variability in the perennial ice cover. this information can be used concurrently with Surface temperature and wind direction to minimize ambiguity in interpretation.
(a, b) Maps of Arctic ice types based on cluster analysis for March 2003 (a) and April 1994 (b). The colors correspond to the different clusters identified in Figure 5. (c, d) Maps of multi-year ice concentration for March 2003 (c) and April 1994 (d).
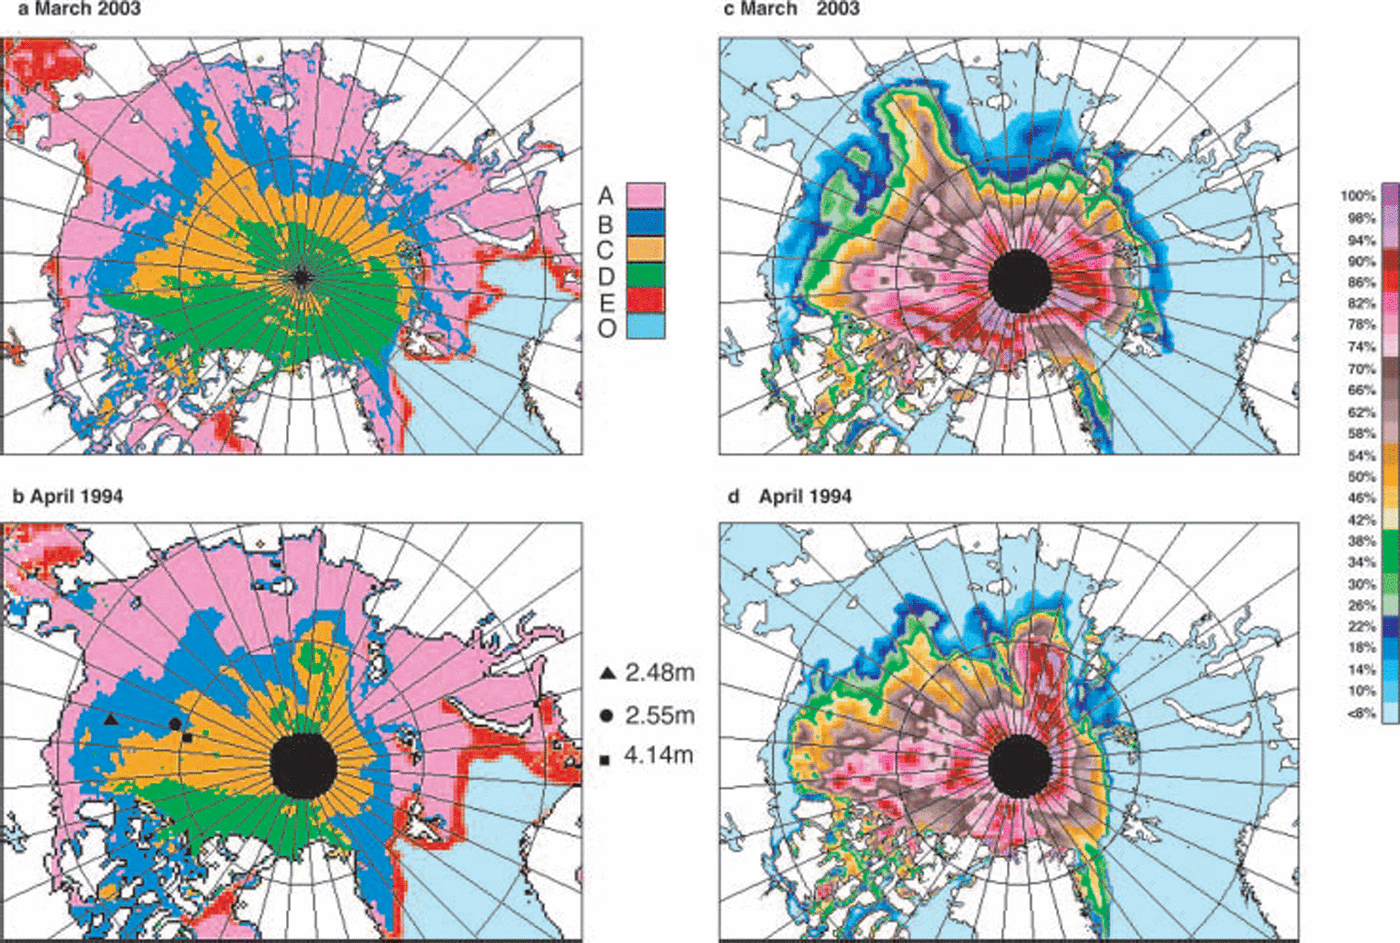
For comparison, a Similar analysis using data from april 1994 is presented in figure 6b. the data in figure 6b are especially useful because they coincide with Submarine Sonar thickness data (provided in personal communication from p. Reference Wadhams and DavisWadhams, 2004). this provided the opportunity to compare the cluster result with the average thickness of Some of the ice floes within the cluster. average ice thicknesses over 50 km Segments were estimated from Sonar data to be 2.48, 2.55 and 4.14 m, over the locations indicated in the map as Solid black triangle, circle and Square, respectively. two data points belong to cluster b, which is color-coded in orange in the map, and have average thicknesses equal to a possible thickness of Second-year ice. moreover, the average thickness of ice in the inner Section (yellow) is Significantly higher than that of the other two data points. this result Suggests that the multichannel passive microwave data contain Some proxy thickness information. having this additional information from the Same Sensor that provides ice extent and area would make the dataset considerably more useful for Studying Sea-ice mass-balance processes. further validation is, however, required and Since Submarine Sonar data are not So readily available, the use of icesat and possible cryosat follow-on data (when available) would be very important for this purpose. coincident in Situ measurements of the physical and radiative characteristics of ice from the different clusters would also be highly desirable for accurate interpretation of the data. it Should be Stressed that unambiguous discrimination of each ice type may not be possible because the ice cover is So dynamic and the presence of mixtures of different ice types within the footprint of the Sensor is likely. the different clusters may thus represent different ice regimes where one particular type is dominant in each regime and the average thickness is Significantly different from those of the other regimes.
3. Multi-Year Ice-Cover Variability
The use of a time Series of cluster maps derived from multichannel Satellite passive microwave data would be a good way of Studying the temporal and Spatial variability of radiometrically different multi-year ice Surfaces in winter. unfortunately, the technique has not matured to the point where Surfaces belonging to the Same clusters can be consistently identified through time. this partly results from the overlapping Signatures of the different Surface types and changes associated with variable environmental conditions. one parameter that can be useful for interpreting the variability of the multi-year ice cover is multi-year ice concentration. Such a parameter has been derived by Reference Gloersen, Campbell, Cavalieri, Comiso, Parkinson and ZwallyGloersen and others (1992) and Reference Johannessen, Shalina and MilesJohannessen and others (1999) by using a mixing algorithm and assuming that the Signature of multi-year ice is constant in time and Space during the winter period. although we now know that this is not the case (Reference GrenfellGrenfell, 1992), the derived multi-year ice distribution Still provides useful information about Spatial changes in the distribution of multi-year ice during winter. in this Study, Such a parameter has been generated using a modified version that makes use of a dynamic Set of tie points to account for interannual changes in the Signature during each winter period. the resulting multi-year ice-concentration maps corresponding to the Same Set of data presented in figure 6a and b are Shown in figure 6c and d, respectively. the multi-year ice-concentration maps provide the general Spatial location of the multi-year ice cover in winter. however, the accuracy is not So good, Since where the multi-year ice concentrations are low the regions may be covered primarily by Second-year ice with much higher concentrations. the mixing algorithm results also Show Some 75% multi-year ice cover in the area colored green in the cluster maps. this is in part because cluster d (green) has an elongated pattern covering a wide range of multi-year ice concentration in a mixing algorithm.
To illustrate the value of Such multi-year ice-concentration maps, plots of the extent and area of the multi-year ice cover and the difference of these with the corresponding extent and area of the perennial ice cover from 1979 to 2005 (see fig. 1a) are presented in figure 7. the plot for the difference between the extent of the retrieved multi-year ice cover and that for the perennial ice the previous Summer (red line) Shows values mainly close to zero, Showing consistency. the good agreement indicates that although there is a redistribution of the perennial ice floes through the autumn and winter period, the changes are not big enough to make the boundaries very different. what is notable is that the corresponding difference in area (pink line) is quite Substantial, i.e. as much as 2×10⁶ km2 lower. Similar midwinter discrepancies have been reported by Reference KwokKwok (2004) using quikscat and Synthetic aperture radar (sar) data. we can infer from this Study that the main reason for the difference is the use of one Set of tie points in the multi-year ice mixing algorithm. in Such an algorithm, Second-year ice is regarded as a mixture of FY and multi-year ice. in the Reference KwokKwok (2004) Study, there was no mention of the possibility that the backscatter of Second-year ice may be different from that of the older multi-year ice type. Since Such a difference in Signature appears to exist with the passive microwave data, a Similar case is likely with active microwave data. it Should also be noted that ice transport out of the region is part of the discrepancy, and for the period up to mid-winter it would be a fraction of the approximately 1×10⁶ km2 a–1 that goes through fram Strait.
Plots of multi-year ice extent (MYe; blue) and area (MYa; green), and the difference in perennial and multi-year ice extent (PIe –MYe; red) and area (PIa –MYa; pink) using perennial ice data in Figure 1a.
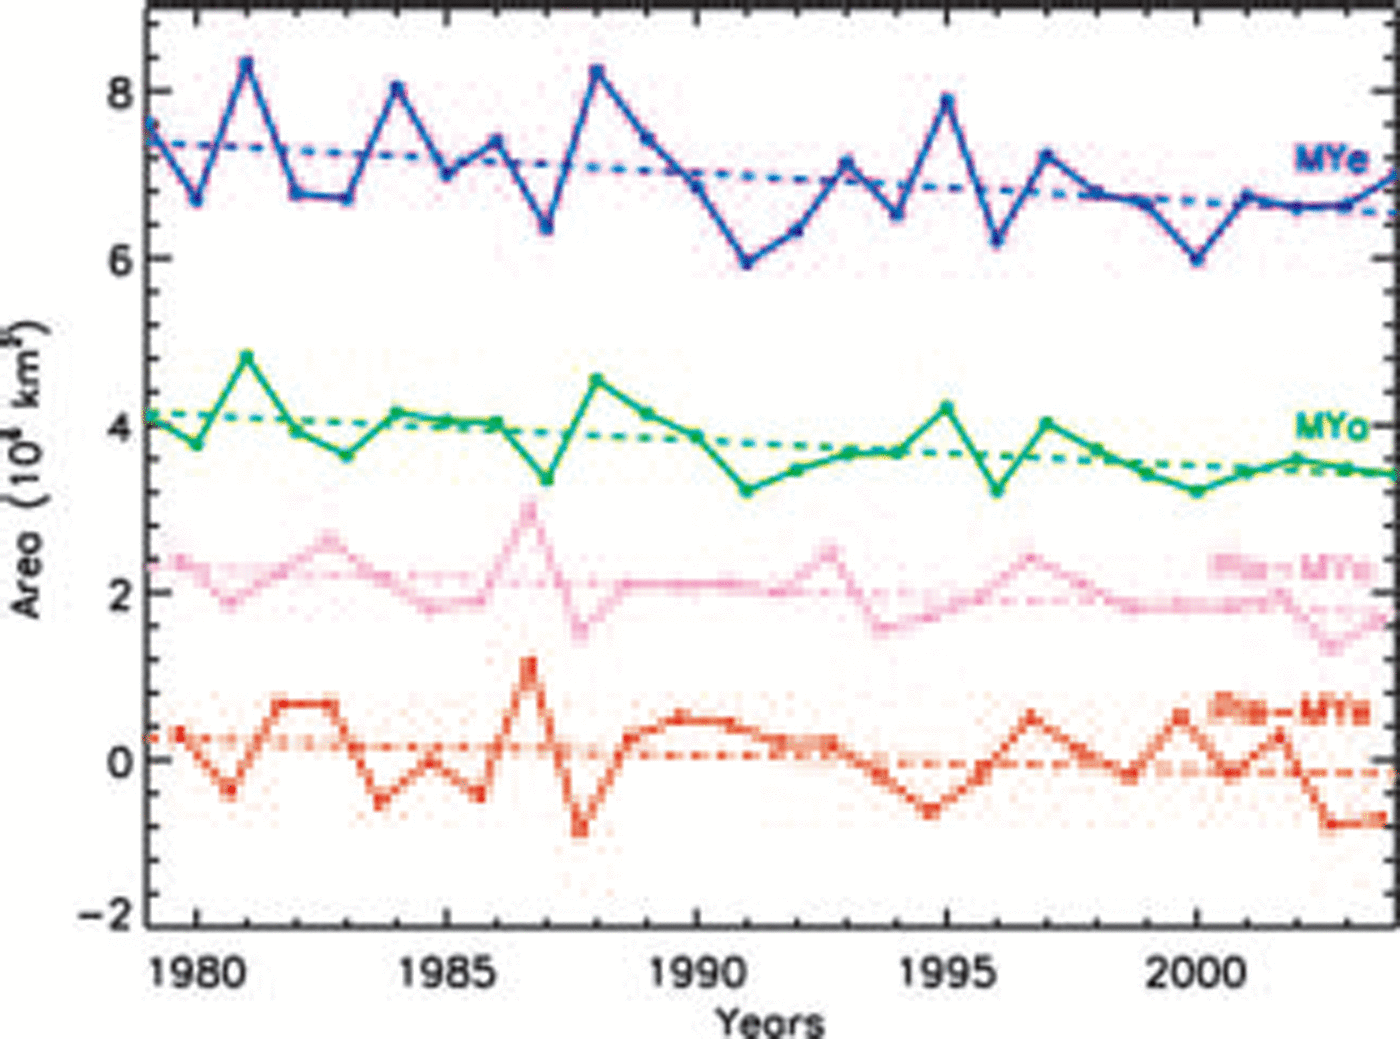
Trend analyses also Show that the trends in extent and area using multi-year ice concentration data are –5.1±2.4 and –8.3±2.5% decade–1, respectively, which are comparable to those from the perennial ice data. Similar results for the multi-year ice cover in winter were also reported by Reference Johannessen, Shalina and MilesJohannessen and others (1999). the trend in area of perennial and multi-year ice (pink line), which we assume to be the area primarily covered by Second-year ice, is negative at about the difference of –5.7±2.4% decade–1. Since the perennial ice area has been decreasing quite rapidly, the trend of the area of Second-year ice as a fraction of the perennial ice area would be more modest. while this may imply that the total area of Second-year ice is decreasing (assuming that the difference is due to Second-year ice), the percentage area of Second-year ice would Still be increasing Since the perennial ice cover is decreasing So much faster. a possible reason why the area of Second-year ice appears to be decreasing is that as the growth Season gets Shorter and the melt Season gets longer, the probability for FY ice to Survive the Summer and turn into Second-year ice becomes Smaller.
4. Discussion and Conclusions
The decline in the perennial ice cover is in part associated with thinning of the ice cover. Such thinning has been reported using limited Submarine Sonar data but over a different period. a general warming in the arctic has been observed (Reference ComisoComiso, 2003) and this leads to longer melt periods, which means a Shorter growth period as well as thinner ice. the thinning, however, may in part be caused by changes in the fractional composition of the different multi-year ice types, and in particular an increase in the fraction of the thinner Second-year ice. this Study Shows that during the last 25 years there were episodes of large interannual variability in the ice cover that could have led to higher fractions of the relatively thin Second-year ice type and therefore the observed thinning in the ice in the 1990s. a higher fraction of Second-year ice would also accelerate the decline in the perennial ice as has been observed.
The multichannel Signature of Second-year ice was also observed to be different from that of the older multi-year ice types. it appears that the Signature approaches that of FY ice in Some cases, indicating that the Second-year ice may retain a Significant brine content and Still be generally opaque. the different Signature also Suggests that Second-year ice may have a different backscatter than those of the older ice types when active microwave data are used, thereby causing biases in the estimate of multi-year ice area from the latter. this may explain the large discrepancy between the area of perennial ice and the area of multi-year ice inferred in the Subsequent winter using various techniques (e.g. Reference KwokKwok, 2004).
Results from cluster analysis using multichannel data Show a Strong potential for obtaining useful information from radiometrically different Surface types. at least four different clusters have been identified in the consolidated ice region in winter that correspond to four distinct ice types. Submarine Sonar measurements of two of these ice types have been identified as having Significantly different average ice thicknesses. although more validation Studies are needed, passive microwave data could provide useful measurements associated with ice type/ice thickness which in conjunction with other datasets would improve our ability to do mass-balance Studies.
Consistently low Summer minima have been observed Since 1998, which may have been triggered by relatively high production of Second-year ice in the previous few years. the difference between the area of the perennial ice and that of inferred multi-year ice in the Subsequent winter provides a qualitative assessment of the magnitude of the area of Second-year ice. the preliminary results using data from 1978 to 2005 Show that the area of Second-year ice may have been decreasing despite the increasing area of FY ice in the arctic basin. this Suggests that Shorter ice growth Season followed by longer melt period (as expected from a warming arctic and ice–albedo effects) does not allow FY ice to be thick enough to Survive the Summer. however, Since the perennial ice cover is decreasing So much faster than the Second-year ice cover, the percentage of Second-year ice in the perennial ice cover is also increasing. it is important to monitor this percentage Since it will undoubtedly influence the rate at which the perennial ice will change in the future.



