




Introduction
In many low-and middle-income countries, access to primary healthcare remains constrained by limited resources and persistent conflicts, contributing to a high burden of infectious diseases and undernutrition (Omam et al., Reference Omam, Jarman, O’Laughlin and Parkes-Ratansh2023). In Ethiopia, approximately 126.5 million people are affected by internal conflicts, poor living conditions, and inadequate access to essential health services (UNICEF Ethiopia, 2023; WHO and Health Cluster, 2024; VaccineWork, 2025). These challenges disproportionately affect young children, particularly during the first years of life, when adequate nutrition is essential for optimal growth and development.
Undernutrition remains a major public health concern among Ethiopian children. Inadequate complementary feeding is a leading contributor to poor child health and survival, increasing susceptibility to infections and adverse health outcomes later in life (English et al., Reference English, Obbagy, Wong, Butte, Dewey, Fox, Greer, Krebs, Scanlon and Stoody2019). Stunting affects approximately 43% of Ethiopian children aged 6–59 months (Abdilahi et al., Reference Abdilahi, Osman and Abate2024), and its consequences extend well beyond childhood. Children who experience stunting attain, on average, 1.1 fewer years of schooling than their non-stunted peers, with substantial implications for cognitive development, productivity, and human capital (Bahru et al., Reference Bahru, Bosch, Birner and Zeller2019).
Iron deficiency anaemia is another major nutritional challenge among Ethiopian children. Although iron supplementation is recommended in many settings, its implementation requires careful consideration in malaria-endemic areas because of potential interactions with malaria infection (John et al., Reference John, Mupere, Opoka, Hodges, Lund, Georgieff, John and Cusick2017). Iron deficiency remains one of the most common nutritional disorders globally, with profound public health consequences (Pivina et al., Reference Pivina, Semenova, Doşa, Dauletyarova and Bjørklund2019). In Ethiopia, childhood anaemia reached 56% in 2016 (Central Statistical Agency, 2017), while more recent estimates indicate that 34.4% of children remain anaemic (Gebrie and Alebel, Reference Gebrie and Alebel2020). Both iron deficiency and stunting adversely affect physical growth, cognitive development, educational attainment, and future economic productivity (Black et al., Reference Black, Trude and Lutter2020; UNICEF et al., 2020; Wudil et al., Reference Wudil, Usman, Rosak-Szyrocka, Pilař and Boye2022).
The burden of undernutrition is further aggravated by environmental and behavioural factors. Inadequate access to safe water, sanitation, and hygiene (WASH) increases the risk of recurrent infections, impairs nutrient absorption, and contributes substantially to childhood stunting (Sahiledengle et al., Reference Sahiledengle, Petrucka, Kumie, Mwanri, Beressa, Atlaw, Tekalegn, Zenbaba, Desta and Agho2022; Regassa et al., Reference Regassa, Duguma, Belachew and Tamiru2023). Similarly, poor dietary diversity and inappropriate complementary feeding practices are strongly associated with impaired child growth (Choudhary et al., Reference Choudhary, Schuster, Brewis and Wutich2021). Addressing these interrelated determinants requires integrated interventions that combine nutrition education with improved hygiene and feeding practices (Carai et al., Reference Carai and Weber2021).
Community-based nutrition education delivered through primary healthcare platforms has emerged as a promising strategy for improving child nutrition. Primary healthcare is fundamental to achieving universal health coverage by providing equitable access to preventive and promotive health services (Ghebreyesus et al., Reference Ghebreyesus, Fore, Birtanov and Jakab2018). Likewise, the Global Nutrition Report highlights strengthening caregivers’ knowledge and practices regarding infant and young child feeding as a key strategy for improving child nutrition and growth (Fanzo et al., Reference Fanzo, Hawkes, Udomkesmalee, Afshin, Allemandi and Assery2019). Community-based nutrition education can promote appropriate complementary feeding, improve dietary diversity, encourage hygiene practices, and increase the utilisation of locally available nutrient-rich foods.
Nevertheless, evidence from sub-Saharan Africa remains limited. A study in rural southwest Ethiopia demonstrated that community-based nutrition education interventions have primarily focused on improving maternal nutrition through behaviour change strategies (Abdisa et al., Reference Abdisa, Jaleta, Tsegaye, Jarso, Jaleta, Tolesa and Kitila2023). However, few interventions have targeted children aged 6–59 months, and high-quality community-based randomised trials evaluating their effects on children’s linear growth and iron status are scarce in sub-Saharan Africa. This evidence gap limits the ability of policymakers to identify effective community-based strategies for improving child nutritional outcomes.
To address this gap, the present study implemented a community-based DIBE intervention delivered by Health Extension Workers. The intervention aimed to improve maternal nutrition knowledge and child feeding practices, promote safe water use and hygiene behaviours, and enhance children’s linear growth and iron status. By integrating behaviour change education into Ethiopia’s primary healthcare system through active community participation, the intervention sought to strengthen preventive nutrition services and generate evidence on the effectiveness of community-based nutrition education for improving child nutritional outcomes.
The primary research question was whether a community-based DIBE intervention delivered by Health Extension Workers improves children’s linear growth and iron status compared with routine nutrition services among children aged 6–59 months in rural Ethiopia. We hypothesised that children whose mothers received the DIBE intervention would demonstrate significantly improved linear growth, reflected by higher height-for-age z-scores and a lower prevalence of stunting, together with improved iron status, reflected by higher haemoglobin concentrations and a lower prevalence of iron deficiency anaemia, compared with children receiving routine nutrition services. We further hypothesised that mothers in the intervention group would demonstrate improved infant and young child feeding practices, greater dietary diversity, better hygiene behaviours, and increased use of locally available nutrient-rich foods compared with mothers receiving routine care.
Study objectives
The objectives were organised into primary and secondary objectives to distinguish the principal research question from supporting analyses. The primary objective reflects the main outcome of the cluster-randomised controlled trial evaluating the effectiveness of the DIBE intervention – whereas the secondary objectives provide complementary evidence by describing baseline characteristics, assessing changes in behavioural outcomes, and identifying factors associated with improvements in child nutritional status.
Primary objective
To evaluate the effectiveness of the DIBE intervention in improving linear growth and iron status among children aged 6–59 months in rural central Ethiopia.
Secondary objectives
-
1. To describe the baseline nutritional, dietary, and socio-demographic characteristics of children aged 6–59 months and their mothers before implementation of the intervention.
-
2. To assess the effect of the DIBE intervention on maternal nutrition knowledge, child feeding practices, and dietary diversity.
-
3. To compare changes in child linear growth and iron status between intervention and control groups following the intervention.
-
4. To identify factors associated with changes in child linear growth and iron status after the intervention.
Materials and methods
Study area and period
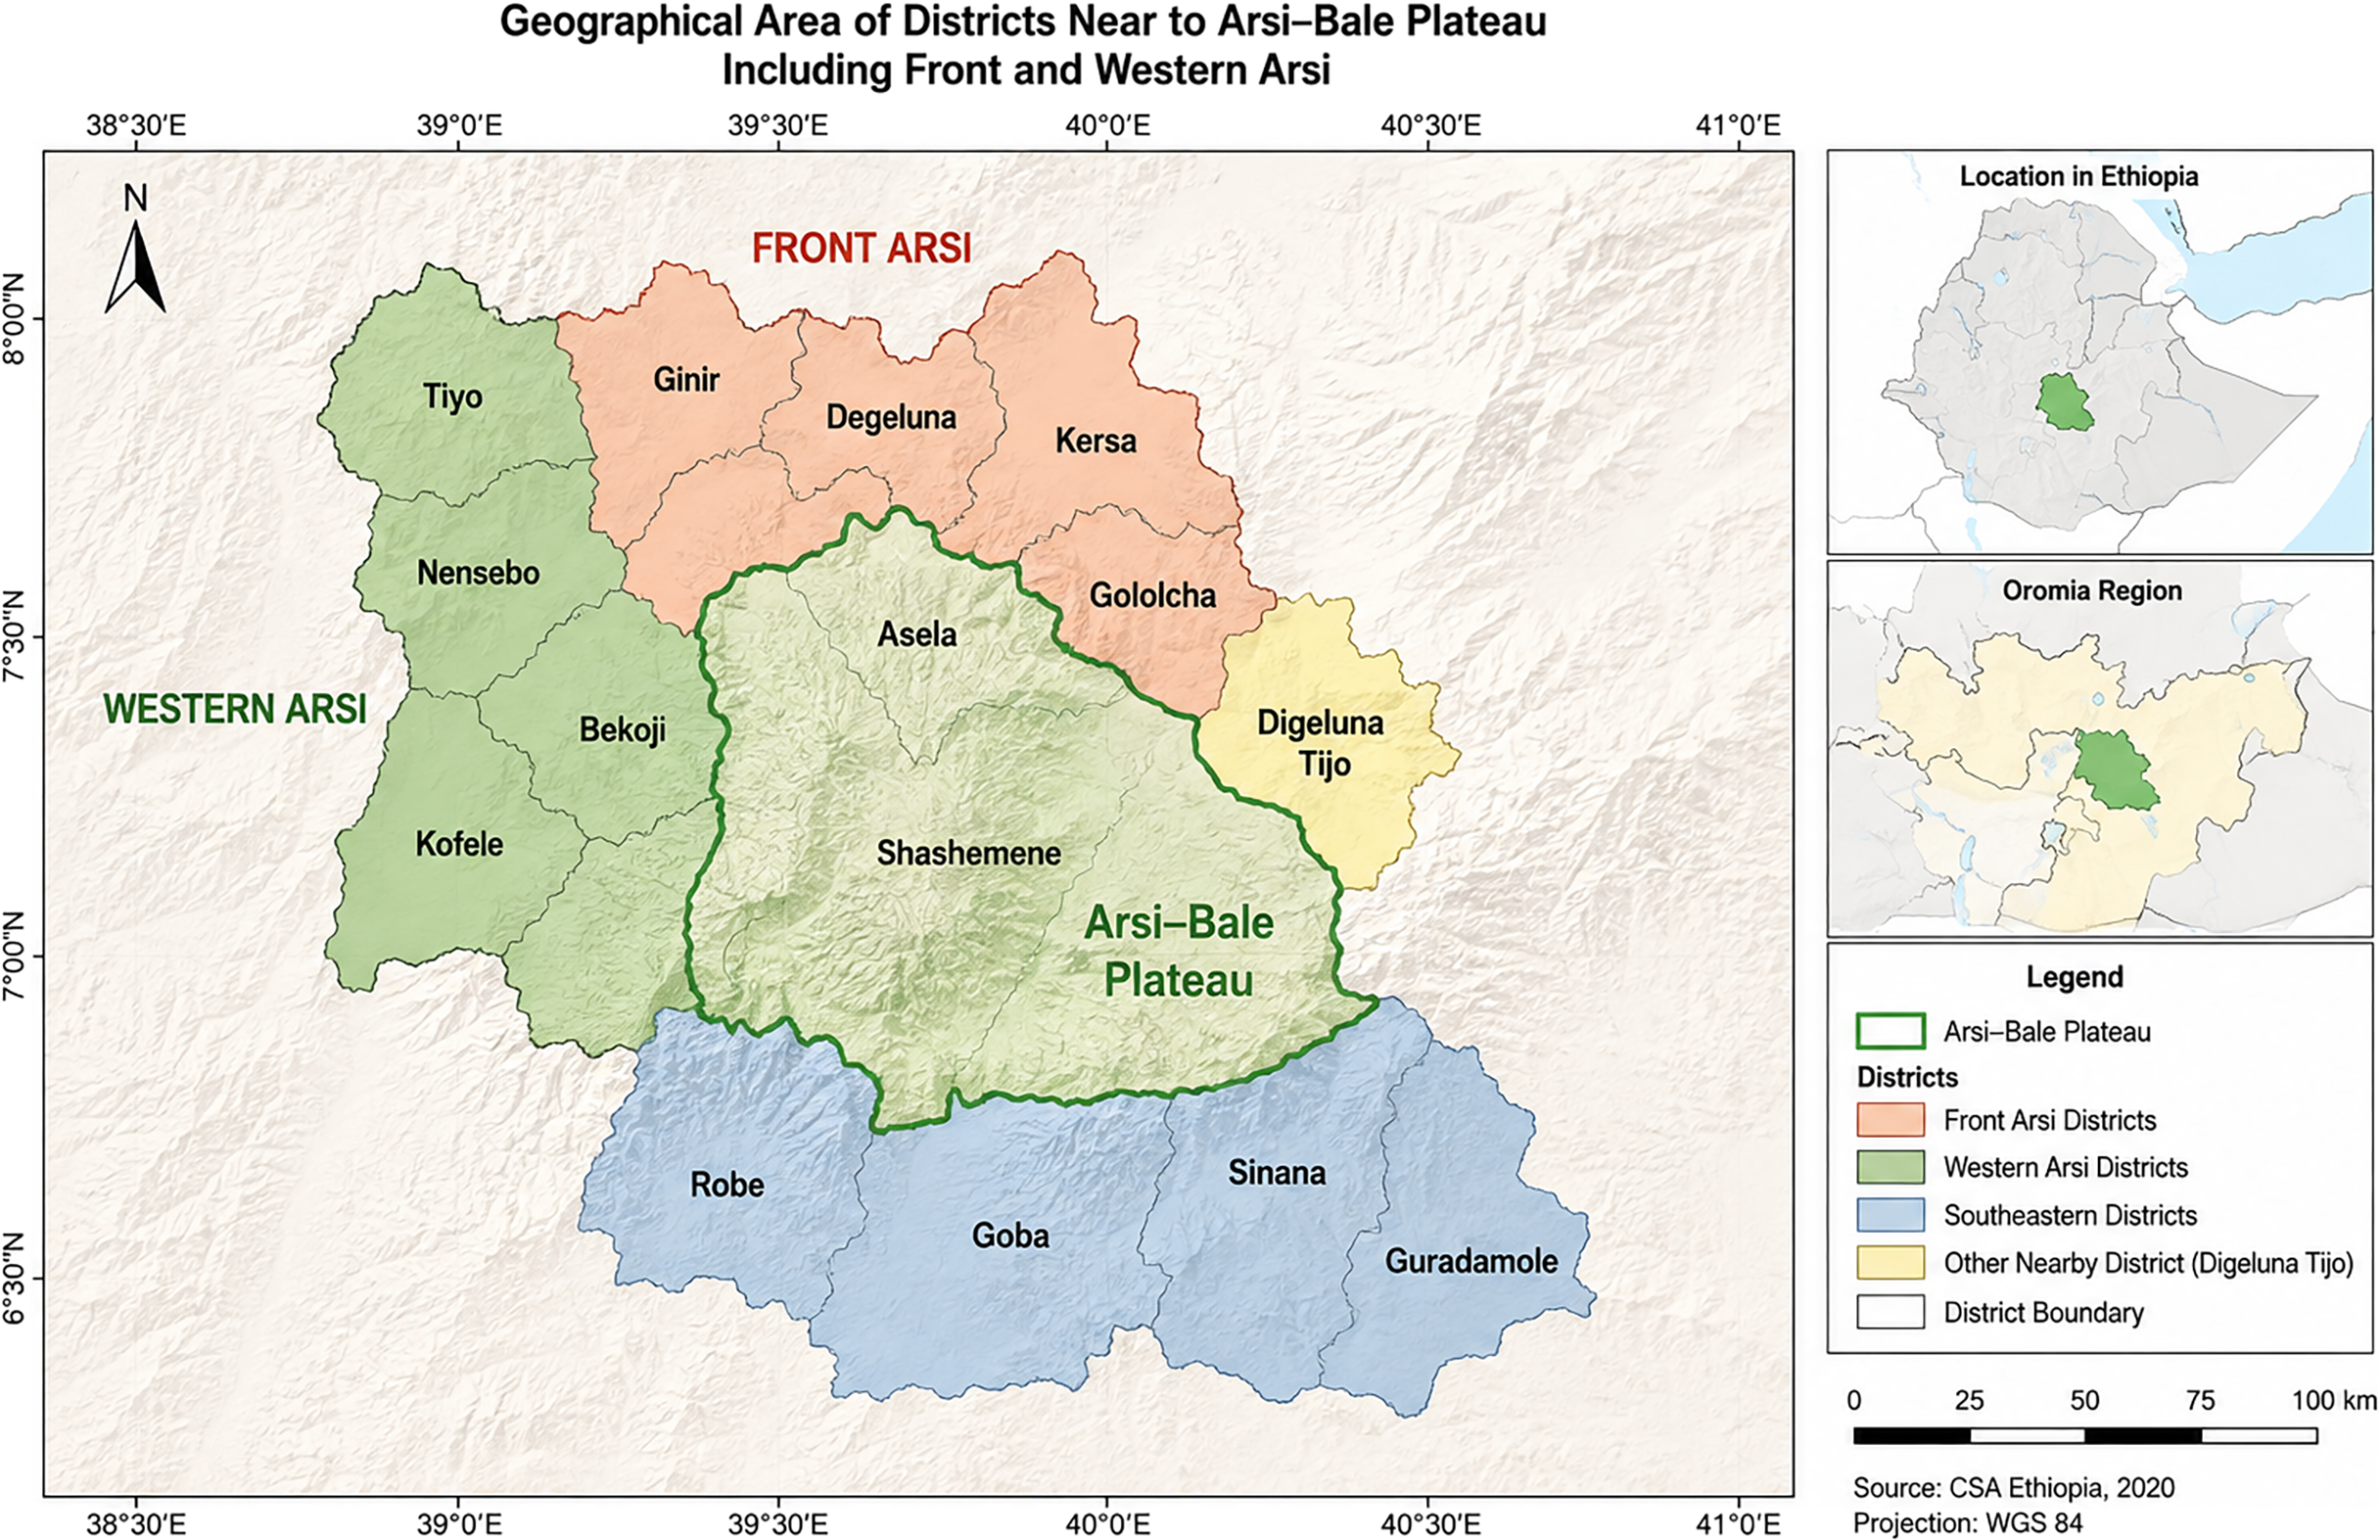
The study was conducted in the Arsi–Bale highlands of the southern-central region of Ethiopia. The study sites comprised eight rural districts: Asella, Digeluna Tijo, Shirka, Ticho, Tiyo, Kersa, Hinkollo, and Bekoji. These districts are predominantly agrarian and represent the highland agro ecological setting of the region. The study, including baseline assessment, implementation of the intervention, and endline evaluation, was conducted from 30 April 2021 to 15 January 2023 (See Figure 1 for details Study area).
Study area and selected clusters.

Figure 1. Long description
Panel A: A map of the geographical area of districts near the Arsi-Bale Plateau, including Front and Western Arsi. The map highlights the Arsi-Bale Plateau in green and surrounding districts in different colors. Key districts include Tiyo, Nensebo, Kofele, Bekoji, Asela, Shashemene, Robe, Goba, Sinana, Guradamole, Ginir, Degeluna, Kersa, Gololcha, and Digeluna Tijo. The map also shows the boundaries of these districts. Panel B: An inset map showing the location of the study area within Ethiopia. Panel C: An inset map showing the location of the study area within the Oromia Region.
Study design
This research utilised a cluster randomised controlled trial approach within a community setting. This study was designed as a parallel-group, cluster-randomised superiority trial with a 1:1 allocation ratio. The study was designed with an independent randomisation method to ensure robust and reliable results.
Sample size determination
The sample size was determined for a parallel-group superiority trial designed to detect a statistically significant difference in the primary outcome between the intervention and control groups, following the approach described by Wang et al. (Reference Wang, Wang, Tu and Feng2017). The calculation was performed using G*Power version 3.0, based on the t-test family for the difference between two independent means, using a two-sided test and the central and noncentral t distributions (Faul et al., Reference Faul, Erdfelder and Buchner2009).
To account for uncertainty regarding the magnitude of the expected intervention effect, sample-size calculations were considered across a range of small-to-moderate standardised effect sizes (Cohen’s d = 0.20–0.50). Smaller effect sizes require larger sample sizes to achieve adequate statistical power, whereas larger effect sizes require fewer participants. Therefore, an effect size of Cohen’s d = 0.23 was selected as a conservative and feasible assumption to detect a modest but potentially clinically meaningful difference between the intervention and control groups while avoiding an unnecessarily large sample.
Using a two-sided significance level of 5% (α = 0.05), 80% statistical power (1−β = 0.80), and an equal allocation ratio (1:1), the estimated required sample size was 986 participants. Because the study used a cluster-randomised design, the individually randomised sample size was subsequently adjusted for the clustering effect using the assumed intracluster correlation coefficient (ICC) and average cluster size, followed by an allowance for potential loss to follow-up, to determine the final target sample size.
To account for an anticipated 2.5% loss to follow-up, an additional 25 participants were included, resulting in an adjusted sample size of 1,011 participants. The final sample size was rounded to 1,012 participants to ensure equal allocation between the intervention and control groups, with 506 mother–child dyads assigned to each study arm.
Effect size from the intraclass correlation coefficient (ICC) calculation
The ICC was estimated from the variance components obtained from the mixed-effects model. The between-cluster variance was 30 cm2, and the within-cluster variance was 73 cm2, resulting in a total variance of 103 cm2. Accordingly, the ICC was calculated as 30/(30 + 73) = 0.291, which was rounded to 0.29 (29.1%). Thus, the estimated ICC was 0.29, indicating that approximately 29.1% of the total variability in children’s height was attributable to differences between LCUs, while approximately 70.9% was attributable to differences among children within the same LCU. This ICC was derived exclusively from the variance components of the mixed-effects model and represents the degree of similarity in children’s height within the same cluster.
As a result, the average size of each cluster was determined by dividing 1,012 by 16, which yields an average of 63 participants per cluster.
Sampling frame: The study was conducted in eight districts comprising approximately 200 LCUs, which constituted the sampling frame. Eligible mother–child dyads were recruited from households within the selected LCUs using systematic random sampling. The number of participants allocated to each selected LCU was determined using proportional allocation based on the eligible population of mother–child dyads in each LCU.
Participants
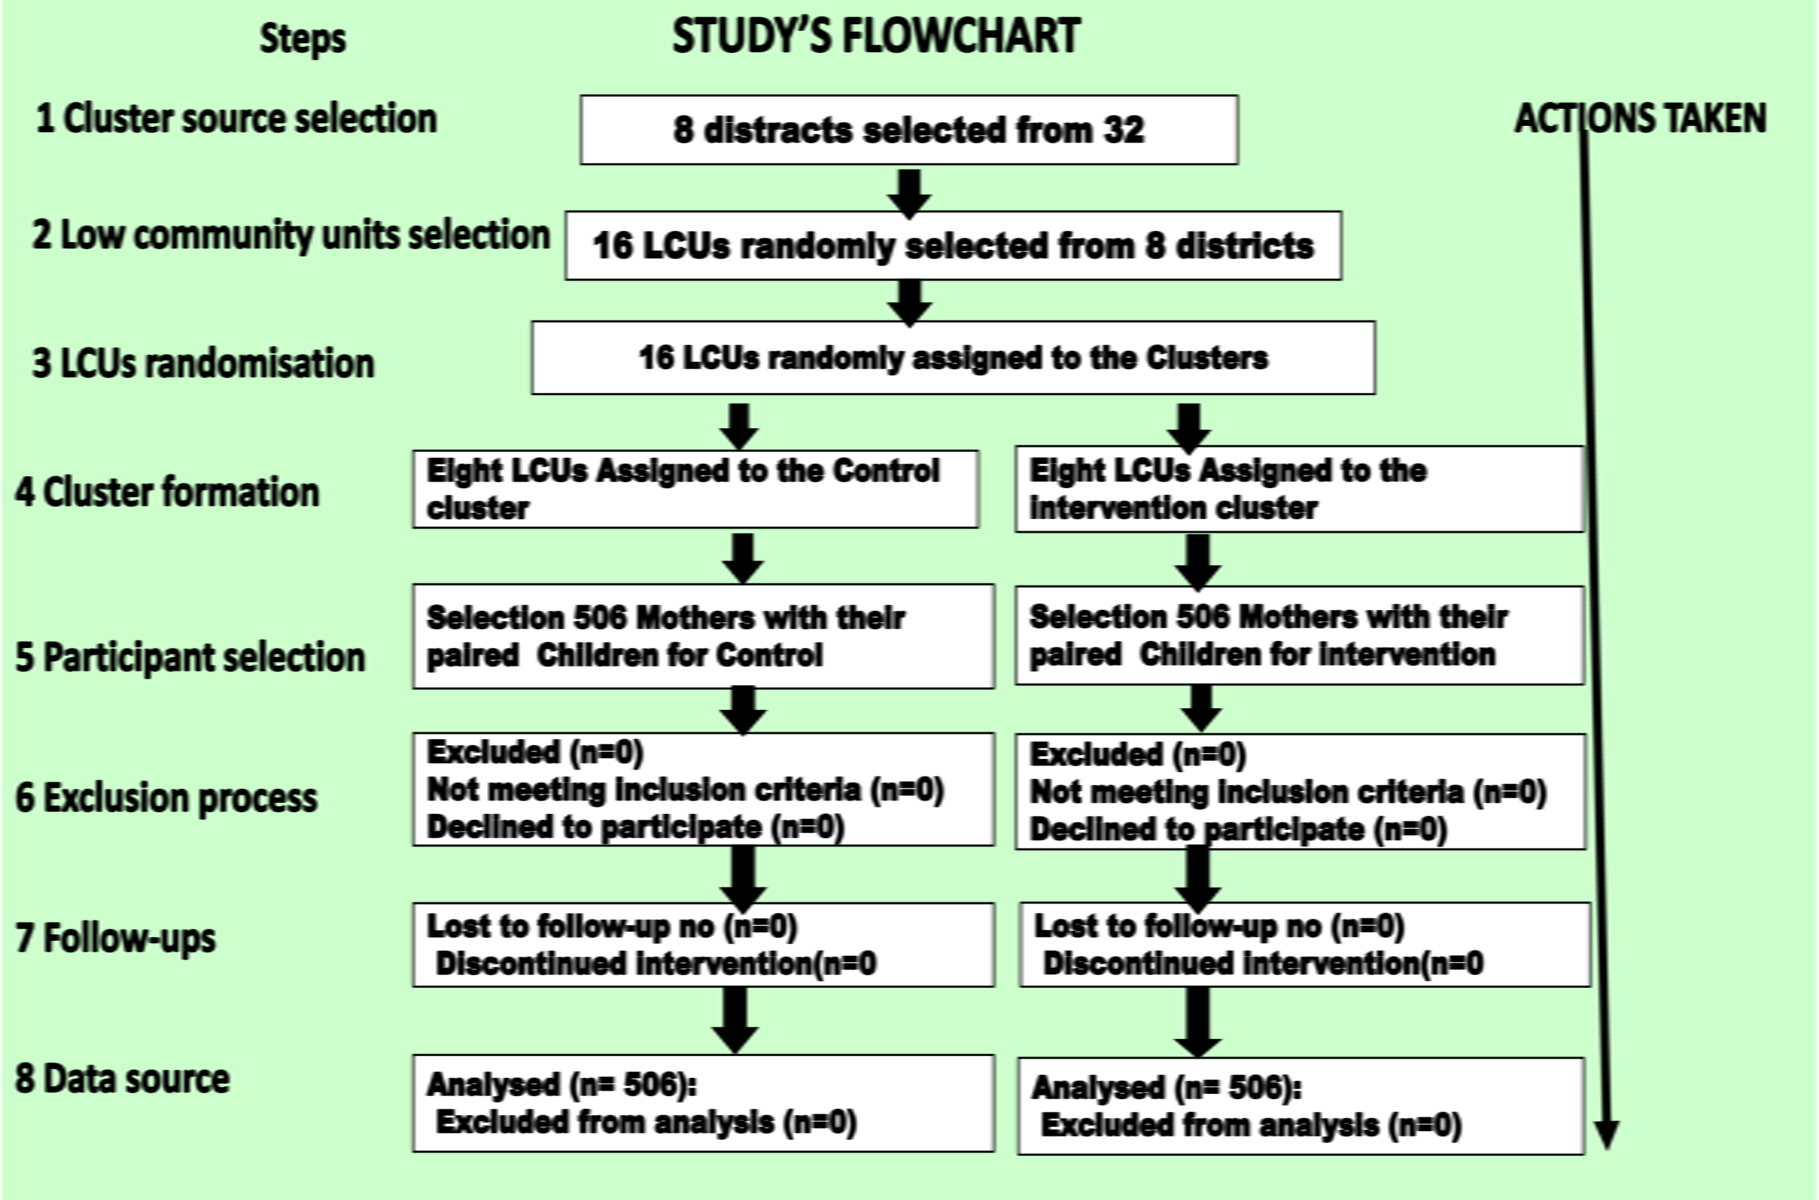
Mothers or other caregivers, paired with children aged 6–59 months, were selected from both the intervention and control groups to represent their respective groups. A total of 1,012 mothers (n = 1012) and their children (n = 1012) participated in the study. Each participant completed their follow-up within 17 months, spanning from April 30, 2021, to January 15, 2023 (Figure 2).
CONSORT flow diagram of cluster and participant recruitment, randomisation, follow-up, and analysis.

Eligibility
Children aged 6–59 months who resided permanently in the study area in the southern central region of Ethiopia were considered eligible for the study. Additionally, new children who were expected to remain in the study area for more than one year were also included. A mother had more than one eligible child within the specified age range, only the youngest child was included in the study to ensure the independence of observations
Exclusion: All children aged 6–59 months in the designated area who presented with a physical disability, such as deformity or moderate-to-severe acute or chronic illness, were ineligible for inclusion in the study. Moreover, children from outside the study area who had differ living standards and were geographically distant were also excluded.
Randomisation: Randomisation of lower community units (LCUs) were generated using the Emergency Nutritional Assessment for the SMART 2011 computer programme. Of the 30 districts in the region, eight were randomly selected for the study. These districts consisted of approximately 200 lower community units that served as the basic allocation ratio. ‘lower community units’, an administrative designation specific to the Ethiopian context’. The administrative functions, defining characteristics, and projected behaviours of a district, along with its population size and the larger context, collectively create a conceptual geographical framework for identifying and analysing districts and LCUs. From each district, two LCUs were randomly selected, resulting in a total of 16 LCUs. These 16 LCUs (clusters) were randomly assigned in a 1:1 ratio to either the intervention group (8 LCUs) or the control group (8 LCUs). The LCU was the unit of randomisation, whereas the mother–child dyad was the unit of analysis. A total of 1,012 mother–child dyads (506 per group) were recruited from the selected LCUs at baseline and followed for 17 months (Figure 1). (see Figure 1 for details).
The principal author, who served as the project’s main administrator, generated the allocation sequence and provided overall supervision of the study. Health Extension Workers (HEWs) and co-investigators shared responsibility for participant identification and enrolment according to predefined eligibility criteria and study procedures. Investigators assigned participants to the intervention or control groups based on the predetermined allocation sequence. The DIBE intervention was administered only to the intervention group (506 mothers and 506 paired children), while the control group (506 mothers and 506 paired children) received routine care. These procedures and the respective roles of the study team are described in the manuscript and illustrated in (see Figure 2 for details).
Cluster masking
This wording clearly refers to contamination control (preventing intervention exposure from spreading between clusters) rather than blinding or masking. Community-based trials require cluster masking to ensure that the intervention and control clusters remain separate (Ahmad et al., Reference Ahmad, Abdullah and Jaafar2018). To achieve this, a small number of LCUs were selected from a larger pool of LCUs, thus protecting the intervention details and minimising contamination.
Moreover, at the point of enrolment, the Health Extension Workers were responsible for identifying and enrolling eligible participants, while the allocation sequence was managed by the investigators.
Implementation
Defining nutritional problem and Planning (Sahu et al., Reference Sahu, Singh, Verma and Verma2022).
This study conducted a baseline survey to collect preliminary data for evaluating the need for education on Dietary intake behaviour education (DIBE). Following the results of the baseline survey, this study focused on the young children in the community that was most high risk group for Iron deficiency and growth defect (Andrade et al., Reference Andrade and Andrade2016). It identified the factors and behavioural patterns that the children perceive as influencing their nutritional status. Consecutively, this study developed and implemented a DIBE education programme for the community. The study specifically targeted selected participants from the intervention group. This approach was focused on providing information to prevent iron deficiencies and related growth issues in children by addressing dietary intake challenges and contextual factors associated with DIBE. Additionally, an individual-cantered and direct approach aimed at the mother or caretaker was recommended to follow information that could be provided to prevent iron deficiencies and associated growth impairments in children by addressing dietary intake obstacles and contextual factors related to DIBE.
Choosing the models and multimedia combination
Theoretical frameworks
The intervention was informed by complementary theoretical and programmatic frameworks. The Diffusion of Innovations theory model by Lee and Susan in 2015 (Lee et al., Reference Lee, Susan, Barbara, Karen and Viswanath2015), guided implementation and the gradual adoption and dissemination of recommended feeding practices through Health Extension Workers, progressing from early adopters to wider community adoption. The WHO/UNICEF Infant and Young Child Feeding model guided intervention content and implementation, with emphasis on appropriate feeding practices during the first 1,000 days and the stages of assessment, planning, implementation/monitoring, and evaluation (Michie, Reference Michie2014). The Health Belief Model informed messages addressing perceived susceptibility and severity of iron and iodine deficiencies, as well as perceived benefits and barriers to recommended practices. Social Cognitive Theory guided the use of demonstrations, modelling, and practical exercises to strengthen caregivers’ self-efficacy. The Theory of Planned Behaviour informed messages addressing caregivers’ attitudes, social norms, and perceived behavioural control. These frameworks were integrated to guide the development of intervention content, delivery approaches, and behaviour-change strategies.
Designing messages, media and support materials
The media act as vital channels for communication, facilitating the delivery of important messages (Parvanta, et al., Reference Parvanta and Bass2018). This educational initiative involved engaging in discussions with mothers of children in community administration compounds. An audio message was recorded and transmitted via a Geepas speaker designed for conveying information.
Key messages used in education
This educational intervention focused on effectively conveying essential messages to mothers of children regarding nutrition and feeding practices (Pathak et al., Reference Pathak, Cavallaro, Kathpalia, Hoon, Hw, Turos and Santhanagopalan2014). During their lessons, we prepared and shared vital information about children’s dietary needs. The key messages communicated included:
The message ‘Diversified foods are essential for children’s health’. Emphasis was placed on utilising available household foods to achieve a varied diet (Haddad et al., Reference Haddad, Hawkes, Waage, Webb, Godfray and Toulmin2016; FAO, 2016). The message ‘Children need to be fed frequently and in adequate quantities throughout the day for proper growth’. According to UNICEF, children who receive sufficient nutrition through
151 appropriately prepared foods at crucial developmental stages are more likely to survive, grow, and thrive (UNICEF, 2020).
The message ‘It is important for children to consume a daily variety of colourful fruits and vegetables’. A research identified that the most vibrantly coloured fruits and vegetables are the richest sources of essential vitamins, minerals, and antioxidants (Minich, Reference Minich2019).
The message ‘Children require easily digestible animal-based foods’ emphasises the importance of such foods for promoting healthy growth in children, as highlighted (Kaimila et al., Reference Kaimila, Divala, Agapova, Stephenson, Thakwalakwa, Trehan, Manary and Maletal2019).
The message ‘soaking, fermenting, and germinating grains can enhance their nutrient absorption’ is particularly relevant for individuals in regions where grains and legumes form the staple of their diet, as well as for those on vegan or vegetarian diets, who may be more susceptible to mineral deficiencies (FAO and IZINCG, 2018). Processes like fermentation and germination improve the nutritional value of cereals and legumes by activating natural enzymes (Nkhata et al., Reference Nkhata, Ayua, Kamau and Jean-Shingiro2018).
The message ‘the assertion that consuming fruits rich in ascorbic acid and amino acids can boost iron bioavailability’ is supported which identified ascorbic acid and various organic acids as key components that facilitate improved iron absorption (Teucher et al., Reference Teucher, Olivares and Cori2004).
The message ‘To promote your child’s health, it’s essential to ensure access to safe drinking water. This can be accomplished through various methods, including the use of chlorine solutions, Aquatabs, Water Agar, or by boiling water at home. Implementing these practices helps to eliminate contaminants and enhance the quality of water, providing a safer long-term water supply and significantly lowering the risk of waterborne diseases’. As a study highlighted on how water usage impacts children’s health (Grau-Pujol et al., Reference Grau-Pujol, Cano, Marti-Soler, Casellas, Giorgi, Nhacolo, Saute, Giné, Quintó, Sacoor and Muñoz2022).
Training of Health Extension: in implementing the intervention, two degree-qualified HEWs were permanently assigned to each lower community unit. All HEWs received standardised training and collaborated in developing local guidelines specific to the intervention approaches before the study commenced. Although HEWs involved in intervention delivery were aware of their programme responsibilities, the participants and HEWs were not informed of the specific study hypothesis or the expected direction of the intervention effect. Data collectors were blinded to participants’ intervention status to the extent feasible. These procedures were implemented to minimise performance and detection bias. We have revised the manuscript to describe these measures more transparently rather than claiming complete blinding (Reinbott et al., Reference Reinbott, Schelling, Kuchenbecker, Jeremias, Russell, Kevanna, Krawinkel and Jordan2016; Naska et al., Reference Naska, Lagiou and Lagiou2017). These competent HEWs contributed to feeding the children, conducting programme visits, and providing demonstrations. The incorporation of iron-rich foods that facilitate gastrointestinal absorption, such as fruits, vegetables, sprouted cereals, and animal products, was an essential part of the dietary adaptation for children.
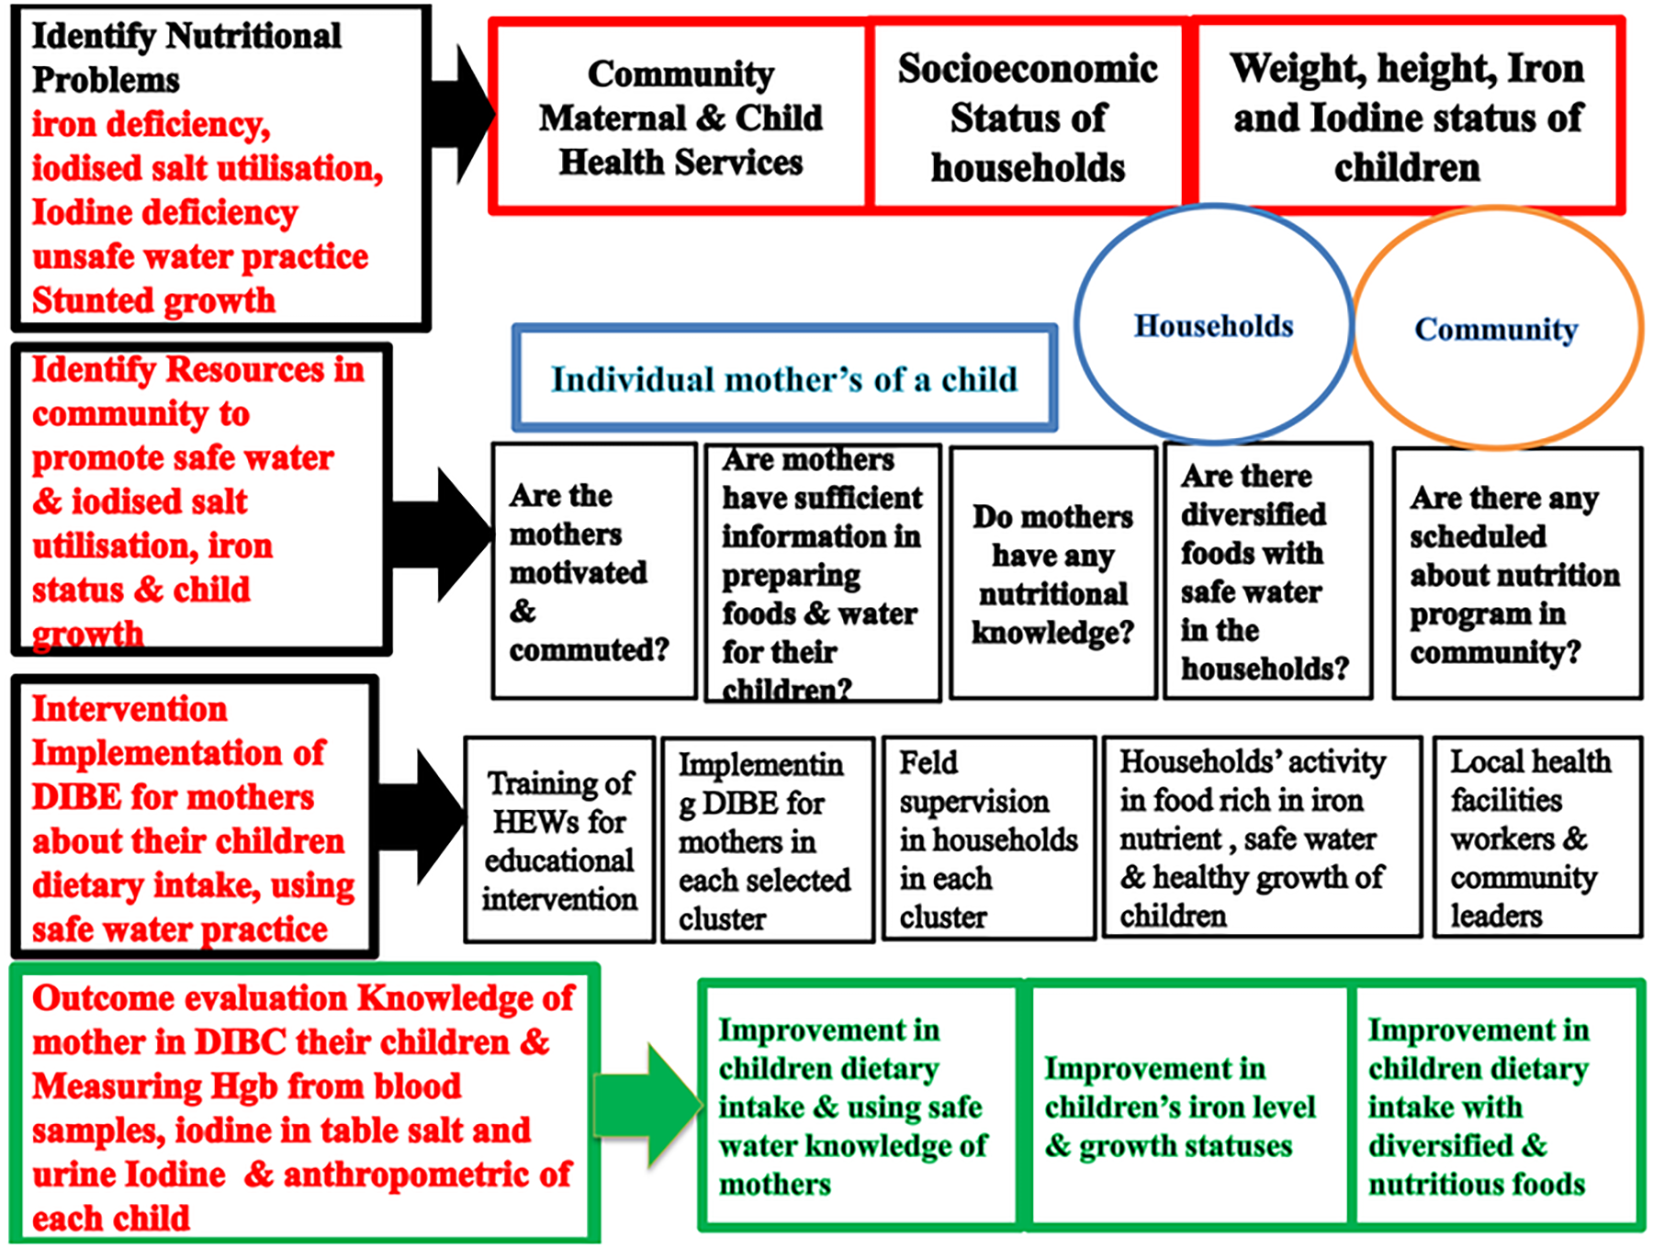
Established the educational framework and producing the materials (Naska et al., Reference Naska, Lagiou and Lagiou2017; Patel and Kassam, Reference Patel and Kassam2022). See Figure 3 for details.
Conceptual framework and delivery pathway of the DIBE intervention.

Figure 3. Long description
The diagram outlines a conceptual framework and delivery pathway for the DIBE intervention. It starts with identifying nutritional problems such as iron deficiency, iodised salt utilisation, iodine deficiency, unsafe water practices, and stunted growth. The next step involves identifying community resources to promote safe water and iodised salt utilisation, iron status, and child growth. This leads to the implementation of DIBE for mothers about their children’s dietary intake using safe water practices. The outcome evaluation includes measuring the knowledge of mothers in DIBC, their children’s Hgb from blood samples, iodine in table salt, urine iodine, and anthropometric measurements of each child. The diagram also includes questions about the motivation and knowledge of mothers, the availability of diversified foods and safe water in households, and the presence of scheduled nutrition programs in the community. The final outcomes include improvements in children’s dietary intake, safe water knowledge of mothers, children’s iron levels, growth statuses, and dietary intake with diversified and nutritious foods.
In this process, role-playing, peer-group discussions, and game based learning strategies used to guide mothers within their community. Children’s mothers educated on various nutrition topics such as food groups, food preparation, balancing a meal within a budget, and the role of gender in household nutrition.
Established education framework of the study’ intervention as follows in Figure 2.
Executing the communication intervention
The primary goal of the intervention during the introduction of solid foods was to enhance the quality of the child’s diet by emphasising commonly consumed foods rich in bioavailable iron including red meat, poultry, fish, and vitamin C-rich foods. Additionally, food preparation techniques, such as soaking or fermenting cereals, have been promoted to reduce the intake of substances that hinder iron absorption.
The 17-month intervention consisted of a baseline assessment, 15 monthly nutrition education sessions, and an endline assessment. The sessions used a structured four-hour format combining oral and visual instruction, group discussion and exercises, and practical demonstrations. Topics progressed from basic child nutrition, breastfeeding, complementary feeding, and meal frequency to dietary diversity, animal-source foods, legumes, fruits and vegetables, iron-and vitamin-rich foods, food preparation, WASH, food safety, and integrated meal planning. The final session focused on reviewing key messages, reinforcing recommended practices, and addressing challenges to sustained behaviour change. A standardised intervention curriculum and educational materials were used throughout the intervention. Intervention fidelity was monitored through supervision and review of session implementation by the research team. Attendance and implementation information were recorded during the intervention as part of the process evaluation.
Intervention evaluation
Process evaluations (Naska et al., Reference Naska, Lagiou and Lagiou2017; Sahu et al., Reference Sahu, Singh, Verma and Verma2022), were used during implementation to understand if and how the programme was implemented as it was intended. In this intervention the HEWs were visit a village once per month for four hours for seventeen consecutive months. During this visit, the HEWs use food groups, portion sizes, and meal planning.
Outcome evaluation [Scherr et al., Reference Scherr, Laugero, Graham, Cunningham, Jahns, Lora, Reicks and Mobley2017; Patel and Kassam, Reference Patel and Kassam2022; Sahu et al., Reference Sahu, Singh, Verma and Verma2022], This community based intervention potential was evident in the reduction of anaemia cases among young children, achieved through modified food preparation, appropriate dietary introduction, the application of absorption enhancers, and the avoidance of inhibitors post-meal. Furthermore, the project established a framework for continuous monitoring and evaluation, ensuring oversight of outcomes until the project’s conclusion. Local Government representatives and delegated district health officers were participate so they can see the impact of the activities they had promoted and consider further expansion of the programme.
Outcome measurements
Haemoglobin measurement and anaemia classification: Blood sample analysis for haemoglobin (Hgb): Haemoglobin concentration was measured using a HemoCue Hb 301 analyser and adjusted for the study altitude of 2,500–2,999 m above sea level. Among children aged 6–23 months, Hb ≥ 105 g/L was classified as non-anaemic, while 95–104 g/L, 70–94 g/L, and <70 g/L indicated mild, moderate, and severe anaemia, respectively, based on age-specific WHO criteria (Garcia-Casal et al., Reference Garcia-Casal, Pasricha, Sharma and Peña-Rosas2019, WHO, 2019).
Anthropometric measurements were collected using standardised procedures and calibrated equipment. Data collectors received training and practical demonstrations on measuring children’s weight, recumbent length, and standing height, followed by standardisation exercises to assess inter-observer consistency and measurement accuracy. The same measurement procedures were applied throughout the study, and equipment was regularly checked and calibrated. Raw anthropometric data were entered into and analysed using ENA for SMART software, which was used to generate WHO Child Growth Standards-based anthropometric indices, including height-for-age Z-score (HFA), weight-for-age Z-score (WFA), and weight-for-height Z-score (WFH). These Z-scores were calculated based on the WHO 2006 Child Growth Standards (Perumal et al., Reference Perumal, Bassani and Roth2018).
Data processing and analysis
To compare differences between the intervention and control groups and assess differences in other continuous variables, independent-samples t-tests were used. The distribution of continuous variables was assessed for approximate normality using histograms, Q–Q plots, and descriptive statistics before conducting the t-tests. No substantial deviations from normality were observed for the continuous variables analysed. A statistically significant difference between the intervention and control groups was observed for haemoglobin levels, with a p-value < 0.05.
All variables relevant to the nutritional status of the children were considered in the GEE models to account for the clustered nature of the data and to assess the effects of the intervention and other explanatory variables (Hanley et al., Reference Hanley, Negassa, Edwardes and Forrester2003). GEE is an appropriate approach for analysing correlated or clustered observations while accounting for within-cluster dependence. An exchangeable working correlation structure was specified, assuming that all pairs of observations within the same cluster had the same correlation.
The GEE models were assessed for potential multicollinearity among explanatory variables and the adequacy of model specification. The working correlation matrix and relevant model diagnostics were also examined. Results are presented as regression coefficients (B), corresponding 95% confidence intervals (CIs), and p-values. Statistical significance was declared at p < 0.05, and the direction and magnitude of intervention effects were considered when interpreting the findings.
As a sensitivity analysis, the GEE models were refitted using alternative working correlation structures. Intervention effect estimates, standard errors, 95% CIs, p-values, statistical significance, and the direction and magnitude of effects were compared across the correlation structures. The results remained substantively similar across the alternative structures, indicating that the study findings were robust to the choice of working correlation structure.
Results
The primary (baseline) data collection was started 30 April 2021 and completed on June 30, 2021. Following completion of the DIBE intervention, secondary data collection began on 15 January 2023. Ultimately, 1,012 (100%) mothers and their paired children actively participated at the baseline and end of the study’s surveys. The intervention group successfully completed the DIBE intervention and participated in the end-line survey (Figure 2).
Results from the sociodemographics of study participants
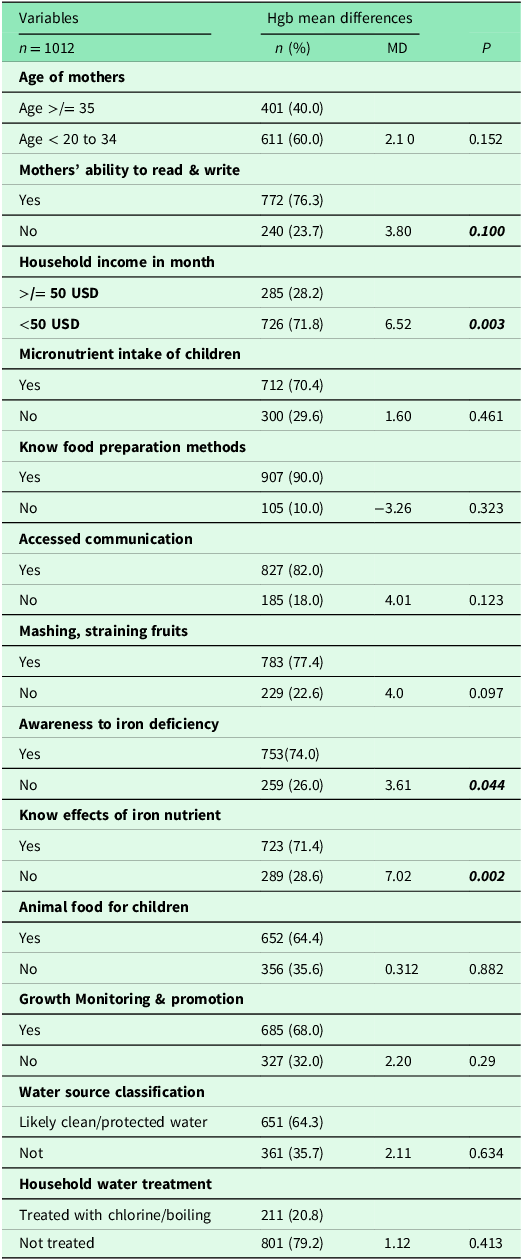
The findings of the study revealed that there were 611 (60%) maternal individuals within the age range of less than 20 to 34years and 401 (40%) were aged 20 years or older. Age differences between these groups did not show a significant difference in haemoglobin (Hgb) levels in paired children in the independent t-test analysis. Of the total number of mothers, 240 (23.7%) were illiterate, while 772 (76.3%) had pursued reading and writing skills. It is likely that the children of literate mothers had significantly different Hgb levels (MD = 3.8 g/l, p = 0.001). Additionally, 285 (28.2%) women had an estimated monthly income of at least $50 USD, and their children showed a significant difference in Hgb levels (MD = 6.52 g/l, p = 0.00). The Hgb difference also demonstrated a substantial link with mothers’ understanding of the consequences of iron deficiency on their children’s health and nutritional status (MD = 10.99, p = 0.002). Furthermore, children whose mothers were aware of iron deficiency in their children had a higher Hgb difference (MD = 3.61, p = 0.044). For further information, refer to Table 1.
Presents a comparison of mean haemoglobin differences between end-line and baseline results among independent factors

Table 1. Long description
A table with 1012 entries comparing mean haemoglobin differences across various factors. The table has 13 rows and 5 columns. Column headers are Variables, Hgb mean differences, n (%), MD, and P. Row labels include Age of mothers, Mothers’ ability to read & write, Household income in month, Micronutrient intake of children, Know food preparation methods, Accessed communication, Mashing, straining fruits, Awareness to iron deficiency, Know effects of iron nutrient, Animal food for children, Growth Monitoring & promotion, Water source classification, and Household water treatment. Each row provides data on the number of individuals, percentage, mean difference in haemoglobin levels, and p-value for statistical significance. Notable trends include significant differences in haemoglobin levels based on mothers’ ability to read & write, household income, awareness to iron deficiency, and knowledge of iron nutrient effects.
Note: No significant difference in haemoglobin level Not significant. These are cubshin caption for noting value in respective tables.
Unprotected water source Reference category.
Regarding household water-source classification, 651 households (64.3%) used likely clean/protected water sources, whereas 361 households (35.7%) used unprotected water sources. The analysis showed no statistically significant difference in haemoglobin levels between children from households using likely clean/protected water and those using unprotected water sources (MD = 2.11, p = 0.634).
Similarly, 211 households (20.8%) reported treating their drinking water using chlorine or boiling, while 801 households (79.2%) did not treat their water. No statistically significant difference in haemoglobin levels was observed between children from households that treated their water and those that did not (MD = 1.12, p = 0.413).
Findings from children’s nutritional status
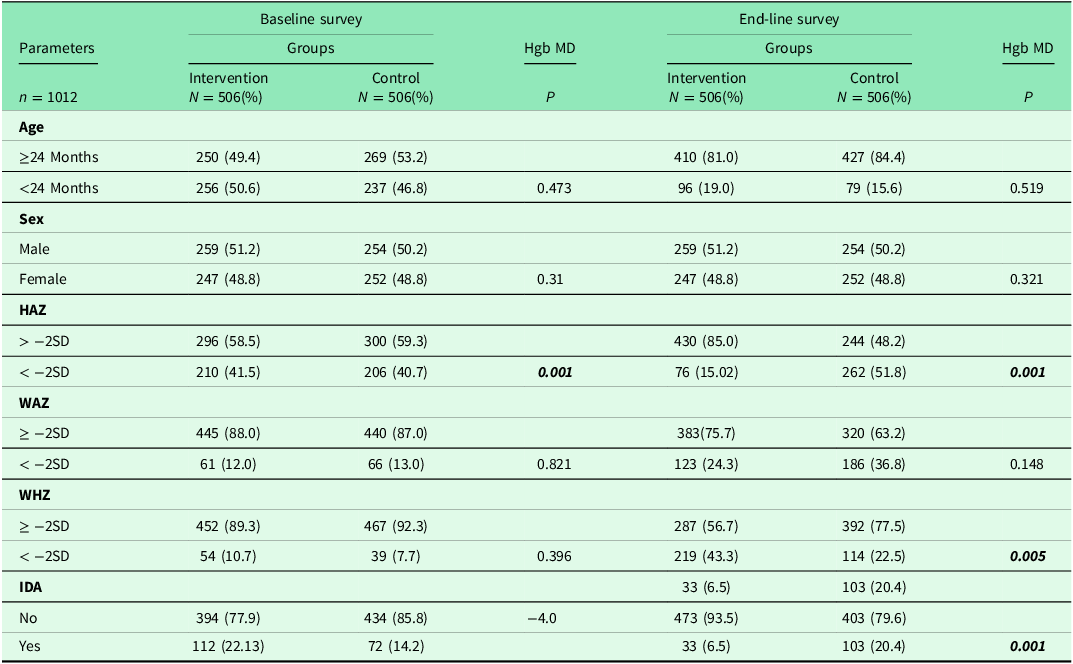
At the beginning of the study, 493 (48.7%) participants were younger than 24 months old. However, by the end of the study, only 175 (17.3%) of the children were within the age range, and the remaining 837 (82.7%) were older than 24 months, but showed no significant difference in Hgb levels. In terms of children’s growth, a significant percentage (41.1%, n = 416) exhibited stunted growth. T 331 In terms of children’s growth, a significant percentage (41.1%, n = 416) exhibited stunted growth.
There were no notable differences between the intervention group (20.8%, n = 210; within this group, the rate was 41.5%) and the control group (20.4%, n = 206; within this group, the rate was 40.7%). However, by the end of the study, the intervention group showed a marked improvement, with the prevalence of stunted growth decreasing to 15.0% (n = 76). In comparison, the control group saw an increase in stunted growth prevalence, rising to 51.8% (n = 262) (see Table 2 for details).
Presents a comparison of mean haemoglobin differences between end-line and baseline results among groups across to children growth parameters. These are cubshin caption for noting value in respective tables

Table 2. Long description
A table comparing children’s growth parameters between intervention and control groups at baseline and end-line surveys. The table has 10 rows and 8 columns. Column headers are Parameters, Baseline survey Groups Intervention, Baseline survey Groups Control, Hgb MD, End-line survey Groups Intervention, End-line survey Groups Control, and Hgb MD. Row labels include Age, Sex, HAZ, WAZ, WHZ, and IDA. Row 1: Age, >24 Months, 250 (49.4), 269 (53.2), 0.473, 410 (81.0), 427 (84.4), 0.519. Row 2: Age, <24 Months, 256 (50.6), 237 (46.8), 96 (19.0), 79 (15.6). Row 3: Sex, Male, 259 (51.2), 254 (50.2), 0.31, 259 (51.2), 254 (50.2), 0.321. Row 4: Sex, Female, 247 (48.8), 252 (48.8), 247 (48.8), 252 (48.8). Row 5: HAZ, > -2SD, 296 (58.5), 300 (59.3), 0.001, 430 (85.0), 244 (48.2), 0.001. Row 6: HAZ, < -2SD, 210 (41.5), 206 (40.7), 76 (15.02), 262 (51.8). Row 7: WAZ, > -2SD, 445 (88.0), 440 (87.0), 0.821, 383 (75.7), 320 (63.2), 0.148. Row 8: WAZ, < -2SD, 61 (12.0), 66 (13.0), 123 (24.3), 186 (36.8). Row 9: WHZ, > -2SD, 452 (89.3), 467 (92.3), 0.396, 287 (56.7), 392 (77.5), 0.005. Row 10: WHZ, < -2SD, 54 (10.7), 39 (7.7), 219 (43.3), 114 (22.5). Row 11: IDA, No, 394 (77.9), 434 (85.8), 4.0, 473 (93.5), 403 (79.6), 0.001. Row 12: IDA, Yes, 112 (22.13), 72 (14.2), 33 (6.5), 103 (20.4).
The mean Hgb level at the start of the study was 126.2 g/L wit 95% Confidence interval (CI) of 125.14–127.25, and it increased to 132.04 g/L (CI = 131.04–133.07) at the end. In the intervention group, the mean Hgb concentration increased from 124 g/L (CI = 122.5–125.4) at baseline to 140 g/L (CI = 138.56–141.42) at the end-line surveys. However, there was no notable difference in Hgb concentration in the control group, which started at 129.0 g/L (CI = 129.28–131.63) and ended at 130.4 g/L (CI = 131.12–133.58). However, there was a significant difference in Hgb levels between the groups (MD = −4.49 g/l, p = 0.001).
At baseline, the overall prevalence of iron deficiency anaemia (IDA) was 18.2% (n = 184) and decreased to 13.44% (n = 136) at the end of the trial. The baseline prevalence was higher in the intervention group (22.13%, n = 112) than in the control group (14.23%, n = 72). By endline, IDA prevalence decreased to 6.5% (n = 33) in the intervention group, representing a 15.5-percentage-point reduction, whereas it increased to 20.4% (n = 103) in the control group, representing a 6.2-percentage-point increase (Table 2).
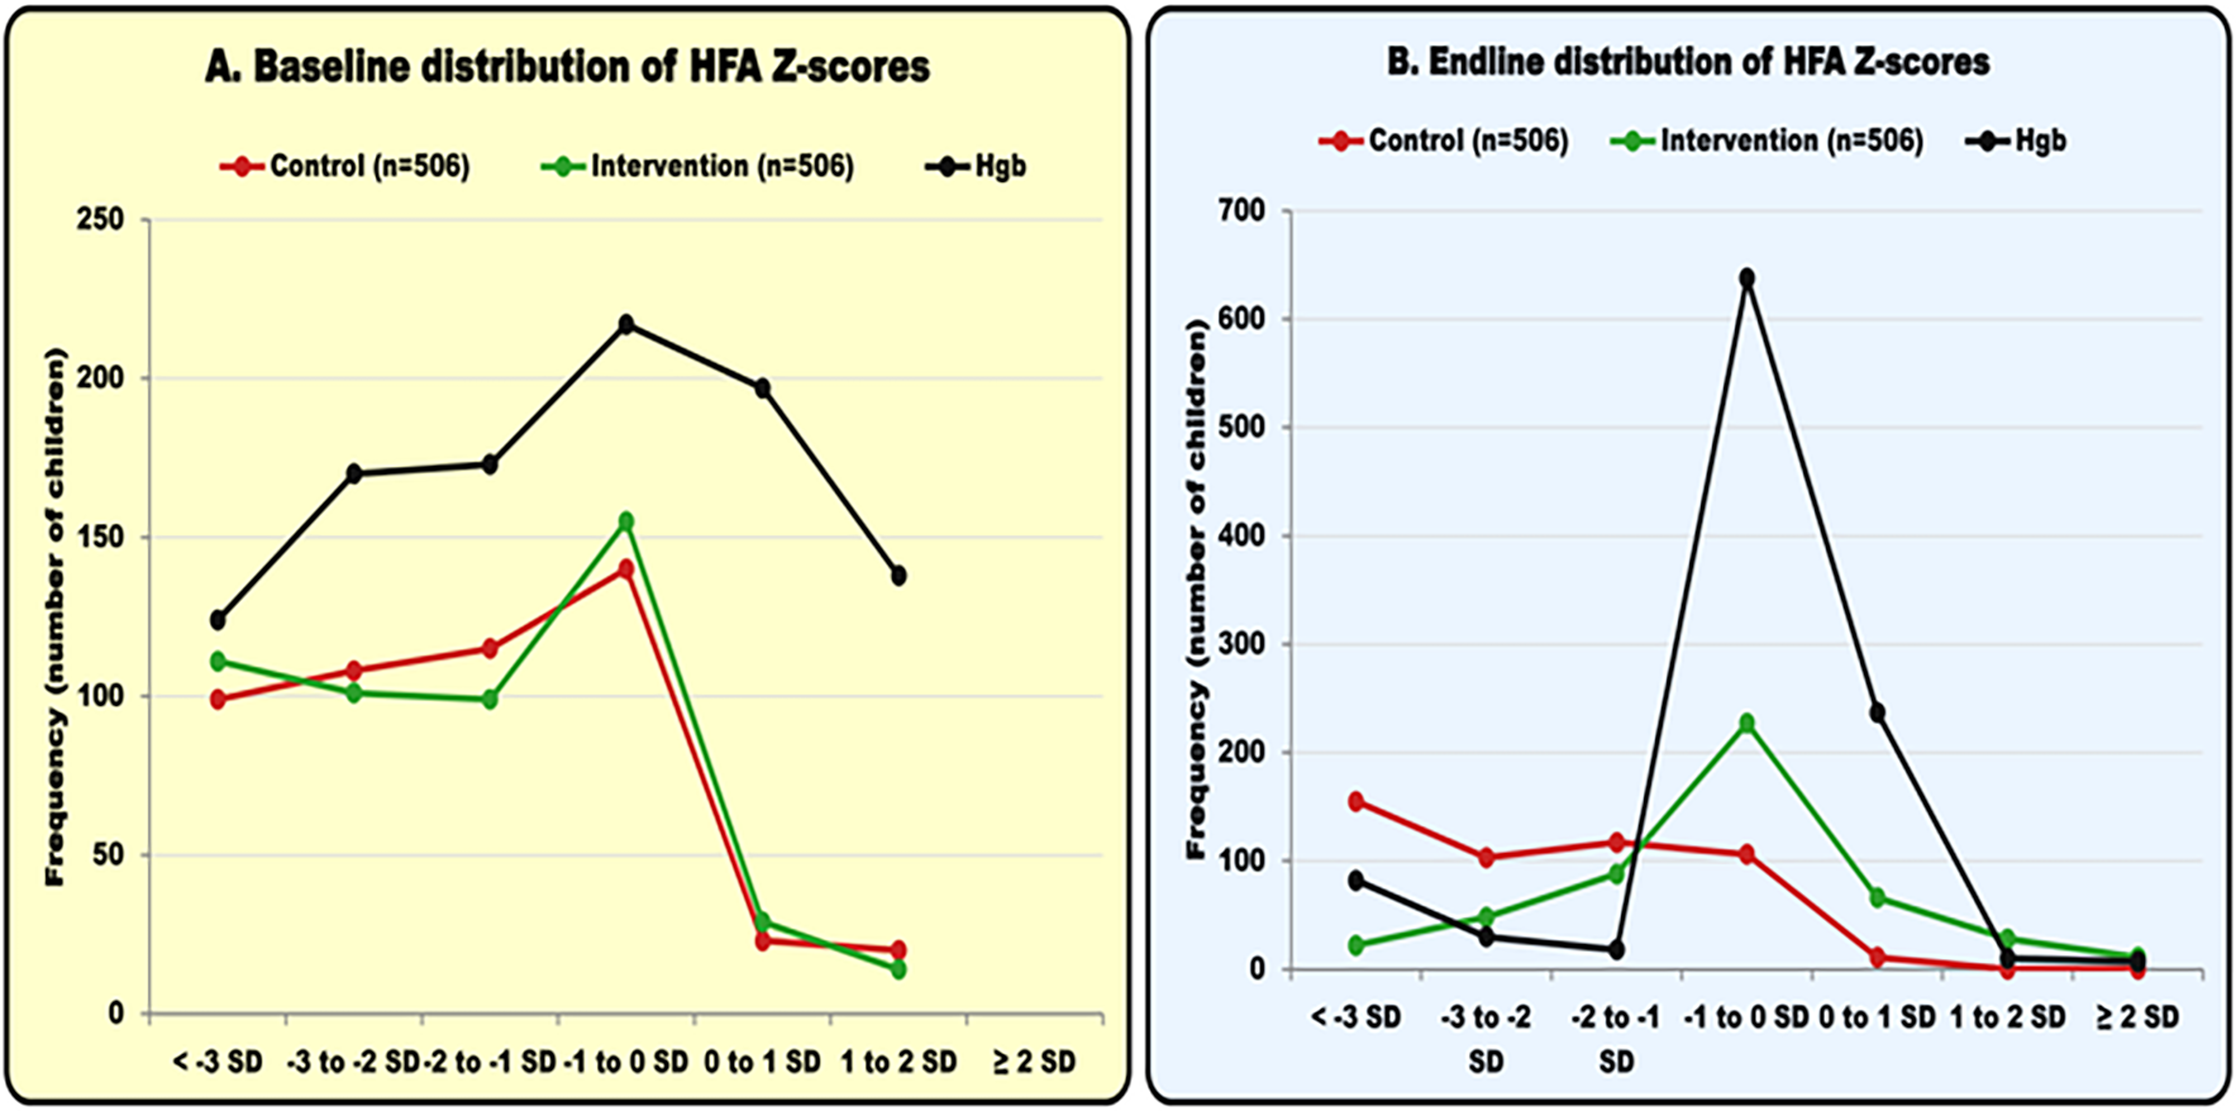
The reduction in IDA prevalence in the intervention group was accompanied by a significant improvement in haemoglobin concentration compared with the control group (mean difference [MD] = 15.86 g/L, p = 0.001). Upon analysing the data, it was noted that both the intervention and control groups demonstrated comparable Hgb levels compared to their initial height. These observed levels were also in line with the Z-score standard deviation growth position analysis specific to children. Notably, there were no differences in these findings (Figure 4A).
Distribution of child anthropometric and haemoglobin outcomes by study group and assessment time.

Figure 4. Long description
Panel A: A line graph titled ‘Baseline distribution of HFA Z-scores’ shows the frequency of children on the vertical axis and Z-score ranges on the horizontal axis. Three lines represent Control (red), Intervention (green), and Hemoglobin (black). The Control and Intervention groups have similar trends, peaking around 0 to 1 SD, while the Hemoglobin group peaks higher around -1 to 0 SD. Panel B: A line graph titled ‘Endline distribution of HFA Z-scores’ shows the frequency of children on the vertical axis and Z-score ranges on the horizontal axis. The Hemoglobin group has a significant peak at -1 to 0 SD, while the Control and Intervention groups show lower and more spread-out frequencies.
At the conclusion of the survey, a noteworthy dissimilarity in the dispersion of stature and haemoglobin (Hgb) was evident in the intervention group, portraying a higher level within the range of normalcy. These individuals exhibited Z scores between −1 and 1 standard deviation (SD) of the mean Z score. Conversely, the control group demonstrated an inclination towards the lowest scores (Figure 4B).
Results from generalised estimating equations analysis
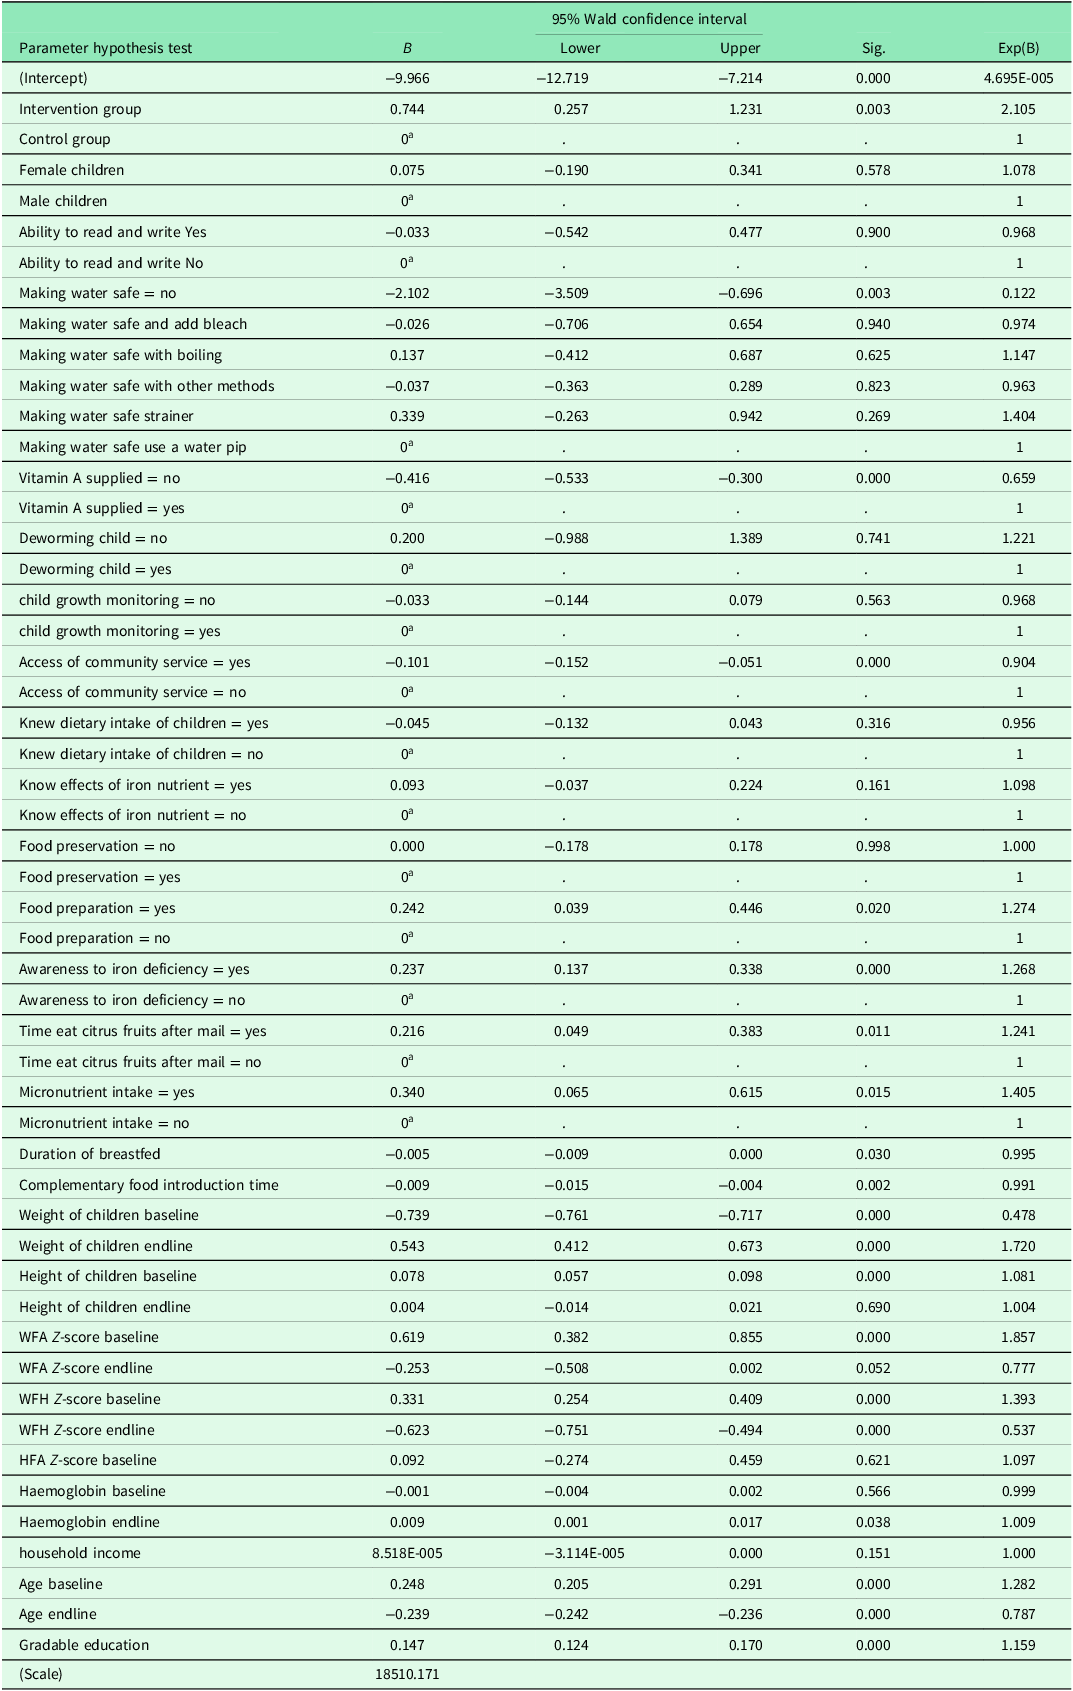
Based on the parameter-estimates table, the results can be written more fully so that readers understand the direction, magnitude, statistical significance, and practical interpretation of the associations with the endline HFA Z-score. The reference categories are those shown with parameter estimates fixed at zero.
The multivariable model identified several factors significantly associated with children’s height-for-age (HFA) Z-score at endline after adjustment for the other variables included in the model. The dependent variable was the endline HFA Z-score, and categorical predictors were interpreted relative to their respective reference categories.
Study group was significantly associated with endline HFA Z-score. Compared with children in the reference control group, children in the intervention group had a higher expected HFA Z-score (B = 0.744, SE = 0.249, 95% CI: 0.257–1.231, p = 0.003). This indicates that, after controlling for the other covariates in the model, membership in intervention Group was associated with an approximately 0.74-unit higher HFA Z-score than membership in control Group. The corresponding exponentiated coefficient was 2.105 (95% CI: 1.293–3.426).
Among the household water-safety practices, the method of making water safe coded as ‘No’ was significantly associated with HFA Z-score compared with the reference category, ‘Use a water safe-yes (B = −2.102, 95% CI: −3.509 to −0.696, p = 0.003). The negative coefficient indicates a substantially lower expected HFA Z-score for children whose households were classified in this category. The estimated exponentiated coefficient was 0.122 (95% CI: 0.030–0.499). In contrast, the other water-safety categories – adding bleach, boiling, other methods, and straining were not statistically significant (p > 0.05).
Vitamin A supplementation was significantly associated with endline HFA Z-score. Children whose vitamin A status was coded as ‘No’ had a lower expected HFA Z-score than those in the reference ‘Yes’ category (B = −0.416, 95% CI: −0.533 to −0.300, p < 0.001). The corresponding Exp(B) was 0.659 (95% CI: 0.587–0.741), indicating a strong inverse association between not receiving vitamin A and the modelled outcome.
Maternal knowledge-related variables showed mixed findings. Knowledge of children’s dietary intake was not significantly associated with endline HFA Z-score (B = −0.045, 95% CI: −0.132 to 0.043, p = 0.316), and knowledge of the effects of iron nutrients was also not significant (B = 0.093, 95% CI: −0.037 to 0.224, p = 0.161).
However, food preparation practices were significantly associated with endline HFA Z-score (B = 0.242, 95% CI: 0.039–0.446, p = 0.020). Compared with mothers who did not practice appropriate food preparation, those who practiced it had a higher expected HFA Z-score. Similarly, awareness of iron deficiency and iron-related issues was positively associated with endline HFA Z-score (B = 0.237, 95% CI: 0.137–0.338, p < 0.001). The Exp(B) of 1.268 (95% CI: 1.146–1.402) further indicates a positive association between this characteristic and the modelled outcome. Overall, the findings suggest that actionable maternal nutrition-related behaviours were more consistently associated with child linear growth than general nutrition knowledge. While knowledge of dietary intake, iron nutrients, and food preservation was not significantly associated with endline HFA Z-score, appropriate food preparation was associated with a 0.242-SD higher HFA Z-score. Similarly, awareness of iron-related issues was positively associated with HFA (B = 0.237, 95% CI: 0.137–0.338; p < 0.001). These findings suggest that nutrition knowledge may contribute to growth primarily when it is translated into practical feeding and food-preparation behaviours. The results therefore support interventions that move beyond information provision toward practical, skill-based nutrition behaviour change, enabling mothers to apply appropriate food selection, preparation, and feeding practices within their available household resources.
Timing of citrus-fruit consumption was also significantly associated with endline HFA Z-score. Children whose citrus-fruit consumption after mail’ had a higher expected outcome than those in the reference did not consume citrus-fruit after mail (B = 0.216, 95% CI: 0.049–0.383, p = 0.011). Likewise, micronutrient intake was significantly associated with the outcome (B = 0.340, 95% CI: 0.065–0.615, p = 0.015), with the category coded as 1 having a higher expected HFA Z-score than the reference category.
Several continuous child characteristics were also significantly associated with endline HFA Z-score. Duration of breastfeeding had a small but statistically significant negative association (B = −0.005, 95% CI: −0.009 to approximately 0.000, p = 0.030). Age at complementary-food introduction was also negatively associated with the outcome (B = −0.009, 95% CI: −0.015 to −0.004, p = 0.002). These coefficients indicate that increasing values of these variables were associated with small reductions in the modelled HFA Z-score, although the magnitude of the association should be interpreted in relation to the measurement units of each variable.
Haemoglobin concentration at baseline was not significantly associated with endline HFA Z-score (B = −0.001, 95% CI: −0.004 to 0.002, p = 0.566). However, endline haemoglobin concentration showed a statistically significant positive association (B = 0.009, 95% CI: 0.001–0.017, p = 0.038). This suggests that higher endline haemoglobin levels were associated with slightly higher HFA Z-scores after adjustment for the other variables in the model.
Anthropometric measures demonstrated strong associations with the endline HFA Z-score. Child weight was negatively associated with the outcome (B = −0.739, 95% CI: −0.761 to −0.717, p < 0.001), whereas endline weight was positively associated (B = 0.543, 95% CI: 0.412–0.673, p < 0.001). Baseline height was positively associated with endline HFA Z-score (B = 0.078, 95% CI: 0.057–0.098, p < 0.001), while endline height was not statistically significant (B = 0.004, 95% CI: −0.014 to 0.021, p = 0.690).
Baseline nutritional status was also important. Baseline weight-for-age Z-score (WFAZ) was positively associated with endline HFA Z-score (B = 0.619, 95% CI: 0.382–0.855, p < 0.001). Baseline weight-for-height Z-score (WFHZ) showed a similar positive association (B = 0.331, 95% CI: 0.254–0.409, p < 0.001). In contrast, endline WFAZ was borderline and did not reach the conventional 5% significance level (B = −0.253, 95% CI: −0.508 to 0.002, p = 0.052), whereas endline WFHZ was significantly and negatively associated with HFA Z-score (B = −0.623, 95% CI: −0.751 to −0.494, p < 0.001). Baseline HFA Z-score itself was not significantly associated with the outcome in this model (B = 0.092, 95% CI: −0.274 to 0.459, p = 0.621).
Access to community services was statistically significant (B = −0.101, 95% CI: −0.152 to −0.051, p < 0.001). Relative to the reference mothers not accessed to community services compared to accessed was associated with a lower expected HFA Z-score. The Exp(B) was 0.904 (95% CI: 0.859–0.951), indicating an inverse association.
Several maternal and child characteristics were not significantly associated with endline HFA Z-score. Child gender showed no statistically significant difference between the categories (B = 0.075, 95% CI: −0.190 to 0.341, p = 0.578). Similarly, maternal ability to read and write was not significantly associated with HFA Z-score (B = −0.033, 95% CI: −0.542 to 0.477, p = 0.900). These findings suggest that, within this adjusted model, neither child gender nor maternal literacy independently explained substantial variation in the children’s endline HFA Z-score. In contrast, deworming and growth monitoring were not significantly associated with endline HFA Z-score. Children classified as not having received deworming had B = 0.200 (95% CI: −0.988 to 1.389, p = 0.741), while those classified as not participating in growth monitoring had B = −0.033 (95% CI: −0.144 to 0.079, p = 0.563). Thus, there was insufficient statistical evidence that these variables were independently associated with endline HFA Z-score after adjustment for the other covariates.
Household income was not statistically significant (B = 8.518 × 10⁻⁵, p = 0.151), indicating insufficient evidence of an independent association with endline HFA Z-score in this adjusted model. In contrast, baseline age was positively associated with the outcome (B = 0.248, 95% CI: 0.205–0.291, p < 0.001), whereas endline age showed a negative association (B = −0.239, 95% CI: −0.242 to −0.236, p < 0.001). The variable representing grade/category among those responding ‘yes’ was also positively associated with the outcome (B = 0.147, 95% CI: 0.124–0.170, p < 0.001).
Therefore, the GEE results table was revised to emphasise the B coefficient, 95% CI, and p-value, in accordance with the recommendation, with Exp(B) reported only where appropriate for interpretation. For further details, see Table 3.
Description of analysed parameters as predictors of the End-Line Height-for-Age Z-Score in children, using the GEE model. These are cubshin caption for noting value in respective tables

Table 3. Long description
The table has 50 rows and 5 columns. The columns are labeled Parameter hypothesis test, B, 95% Wald confidence interval, Sig., and Exp(B). The rows include various predictors such as intervention group, control group, female children, male children, ability to read and write, making water safe, vitamin A supplied, deworming child, child growth monitoring, access of community service, knew dietary intake of children, know effects of iron nutrient, food preservation, food preparation, awareness to iron deficiency, time eat citrus fruits after meal, micronutrient intake, duration of breastfed, complementary food introduction time, weight of children baseline, weight of children endline, height of children baseline, height of children endline, WFA Z-score baseline, WFA Z-score endline, WFH Z-score baseline, WFH Z-score endline, HFA Z-score baseline, haemoglobin baseline, haemoglobin endline, household income, age baseline, age endline, gradable education. Each row provides the B coefficient, 95% confidence interval, significance value, and Exp(B) where appropriate.
Discussion
The results of this study highlight a significant concomitant between children’s growth status and the dietary education of their mothers. Initially, the 1,012 children assessed had a notably high prevalence of stunting at 41.1%, a rate slightly lower than the 43% reported for children aged 6 to 59 months in a prior study (Abdilahi et al., Reference Abdilahi, Osman and Abate2024). Following the intervention, the stunting rate in the intervention group decreased dramatically from 41.5% to 15%, with an average growth improvement HFA Z-score 0.74. In contrast, a previous study indicated a decline in the stunting prevalence among children under five, from 47% to 37% in 2019 (Dessie et al., Reference Dessie, Tsegaye, Mekonnen, Bayih and Nigussie2022). The significant reduction in stunting observed in our study may primarily reflect the effect of the dietary education intervention delivered to mothers. However, stunting prevalence unexpectedly increased in the control group from 40.7% at baseline to 51.8% at endline. This finding should be interpreted cautiously and does not necessarily indicate deterioration attributable solely to the absence of the intervention.
One possible explanation is the age-related trajectory of linear growth. In Ethiopia, stunting prevalence increases substantially during early childhood, from approximately 17% among children younger than 6 months to about 45% among those aged 24–35 months (EPHI and ICF, 2021). Given the 17-month follow-up, children aged 6 months at baseline would have reached approximately 23 months at endline, potentially placing many participants within a period of increased vulnerability to growth faltering.
The observed increase also differs from Ethiopia’s broader declining secular trend, with national stunting prevalence decreasing from 51% in 2005 to 37% in 2019 (EPHI and ICF, 2021). Seasonal food insecurity may have contributed. A longitudinal study in southern Ethiopia reported substantial seasonal variation in stunting (38–49%) and associations with household food insecurity and dietary diversity (Belayneh et al., Reference Belayneh, Loha and Lindtjørn2021). Food insecurity has similarly been associated with childhood undernutrition in Western Oromia (Yazew, Reference Yazew2022).
Furthermore, the study period (2021–2023) coincided with COVID-19, conflict, drought and economic pressures that affected livelihoods and food access, particularly in Oromia (UNICEF Ethiopia, 2023). However, our data were insufficient to quantify their individual contributions. Therefore, the control-group increase should be considered multifactorial. The between-group difference supports a beneficial intervention effect, although its magnitude should be interpreted in light of age-related and contextual changes.
A primary objective of the DIBE intervention was to improve children’s haemoglobin status. The prevalence of IDA decreased markedly from 18.2% at baseline to 6.5% at endline, with the greatest reduction observed in the intervention group, where prevalence declined from 22.13% to 6.5%. This improvement coincided with favourable changes in linear growth. Consistent with this finding, baseline haemoglobin concentration was not significantly associated with endline HFA Z-score (B = −0.001, 95% CI: −0.004 to 0.002, p = 0.566), whereas endline haemoglobin concentration showed a significant positive association (B = 0.009, 95% CI: 0.001–0.017, p = 0.038). Thus, higher haemoglobin concentrations at endline were associated with modestly higher HFA Z-scores after adjustment for other variables in the model. These findings suggest that improved haemoglobin status may have contributed to better linear growth among children receiving the intervention. These findings indicate that the dietary education programme implemented for children’s mothers had a positive impact on increasing mothers’ knowledge and subsequently reducing the risk of IDA among young children (Alhaija et al., Reference Alhaija, Hasab, El-Nimr and Tayel2024).
Endline haemoglobin concentration was positively associated with endline HFAZ (B = 0.009, 95% CI: 0.001–0.017, p = 0.038), whereas baseline haemoglobin was not significant and is therefore not considered further. The positive association suggests that children with higher haemoglobin concentrations at endline tended to have better linear-growth status after adjustment for other variables. This relationship may reflect the contribution of adequate micronutrient intake and overall dietary adequacy to child growth. Iron deficiency and anaemia commonly occur in the context of inadequate diets and infections, which may collectively affect child health and growth. Nevertheless, haemoglobin should be interpreted as an indicator associated with nutritional and health status rather than as an independent causal determinant of linear growth. The finding is nevertheless compatible with the broader evidence that micronutrient adequacy is important during the period of rapid childhood growth.
Household water-safety practices may contribute to child health and linear growth. In this study, the method used to make household water safe was significantly associated with HFA z-score. Children from households in category ‘0’ had substantially lower HFA z-scores than those in the reference category (B = −2.102, 95% CI: −3.509 to −0.696, p = 0.003). Because this was an observational association, the finding should be interpreted cautiously and does not establish causality.
The association is biologically plausible because unsafe or contaminated water can increase exposure to enteric pathogens and diarrhoeal diseases, potentially reducing nutrient intake and absorption and impairing growth. Repeated pathogen exposure may also contribute to environmental enteric dysfunction, characterised by intestinal inflammation and (Conroy and Metzler, Reference Conroy and Metzler2004; Lowe et al., Reference Lowe, Tsheten, Wagnew, Sarma, Ancha, Gray and Kelly2025). Evidence suggests that improved water quality and broader WASH interventions may benefit child nutritional outcomes, although findings vary across settings and interventions (Gizaw and Worku, Reference Gizaw and Worku2019; Bekele et al., Reference Bekele, Rawstorne and Rahman2020). Recent evidence also indicates that improved drinking-water quality and accessibility are associated with lower odds of childhood stunting, but substantial heterogeneity remains (Saputro Wijayanto et al., Reference Saputro Wijayanto, Theodora Simanjuntak, Chang, Miftahul Asrar, Phoebe Swastidharmistha, Amaral Haq, Krisnanta Gandhy, Zaky Rabih, Dwi Putra and Girsang2026). Thus, our finding highlights household water safety as an important component of integrated nutrition, sanitation, and hygiene interventions rather than evidence of a direct causal effect.
The present analysis identified several child-level characteristics associated with endline height-for-age Z-score (HFAZ), although the magnitude and direction of these associations varied considerably. These findings suggest that linear growth at the end of follow-up was influenced not only by the intervention and baseline nutritional status but also by feeding practices, haemoglobin status, and concurrent anthropometric characteristics. Because HFAZ is an indicator of attained linear growth relative to age and sex, these associations should be interpreted cautiously, particularly where contemporaneous anthropometric variables were included in the same model.
Age at introduction of complementary foods was significantly and negatively associated with endline HFAZ (B = −0.009, 95% CI: −0.015 to −0.004, p = 0.002). Thus, increasing age at introduction of complementary foods was associated with a small reduction in HFAZ. This finding is consistent with the biological importance of timely complementary feeding. From approximately six months, breast milk alone may no longer meet the increasing energy and nutrient requirements of infants, making nutritionally adequate complementary foods necessary for continued growth (WHO, 2023a, 2023b). The complementary-feeding period also coincides with a particularly vulnerable period for growth faltering and nutrient deficiencies (WHO, 2023a). The observed association therefore suggests that delayed introduction of complementary foods may have contributed to poorer linear-growth outcomes in this population. However, the relatively small coefficient indicates that the magnitude of the association per unit increase in age was modest.
Baseline nutritional status was also strongly associated with subsequent linear growth. Baseline WFAZ showed a significant positive association with endline HFAZ (B = 0.619, 95% CI: 0.382–0.855, p < 0.001), while baseline WFHZ was similarly positively associated (B = 0.331, 95% CI: 0.254–0.409, p < 0.001). These findings indicate that children with better nutritional status at baseline were more likely to have better linear-growth status at the end of follow-up. This is consistent with the concept that early nutritional status and cumulative nutritional exposures influence subsequent physical growth. WHO recognises WFAZ, WFHZ and HFAZ as complementary indicators describing different dimensions of child growth and nutritional status (WHO, 2006). The strong association of baseline weight-related indicators with subsequent HFAZ may therefore indicate that children entering the intervention with better nutritional reserves had greater potential to maintain or achieve favourable linear growth.
The negative association between endline WFHZ and HFAZ (B = −0.623, 95% CI: −0.751 to −0.494, p < 0.001) should be interpreted cautiously. Although statistically significant, this relationship may partly reflect the mathematical relationship among weight, height, age and their corresponding Z-scores rather than a direct adverse effect of weight-for-height on linear growth. WFHZ and HFAZ are derived from overlapping anthropometric measurements, and therefore simultaneous inclusion of these variables in a model predicting HFAZ can generate strong associations because of their mathematical dependence. Accordingly, this finding should not be interpreted as evidence that higher weight-for-height causes poorer linear growth. Rather, it demonstrates the close relationship between different dimensions of anthropometric status.
Finally, access to community services was significantly associated with endline HFAZ (B = −0.101, 95% CI: −0.152 to −0.051, p < 0.001; Exp(B) = 0.904, 95% CI: 0.859–0.951). Children in the category coded as having access to community services had a lower expected HFAZ than those in the reference category. Although this direction was unexpected, it should not be interpreted as evidence that community services adversely affect child growth. A plausible explanation is reverse causality or indication bias, whereby children with poorer nutritional or health status are more likely to receive or seek community-based services. In addition, the variable may reflect whether services were accessed rather than their frequency, quality, timing, or specific nutritional content. Consequently, this association should be interpreted as an adjusted statistical relationship rather than a causal effect.
Overall, the significant findings indicate that timely complementary feeding, better endline haemoglobin status, and favourable baseline nutritional status were associated with better endline linear growth, while the inverse associations involving endline WFHZ and community-service access require cautious interpretation because of potential mathematical coupling and selection-related mechanisms. These findings support the importance of interventions that promote timely, adequate and diverse complementary feeding and improve the nutritional status of young children during the critical period of growth faltering (WHO, 2023a).
Conclusions
In summary, this interventional study used various approaches to address the health and developmental needs of children in communities severely impacted by public health challenges and limited resources. This interventional study was particularly beneficial in areas where iron supplements, such as tablets or syrups, are unavailable or difficult to access, especially in communities facing high rates of infectious diseases and inadequate access to safe water. Furthermore, the intervention resulted in a notable decrease in the rates of stunted growth, a significant public health issue. The findings of this study have broader implications, extending beyond the immediate health concerns of young children to encompass potential long-term health problems stemming from childhood malnutrition.
Recommendations
Implications for practice: Health Extension Workers should consider incorporating structured DIBE messages into routine maternal and child nutrition counselling, particularly on dietary diversity, complementary feeding, locally available nutrient-rich foods, safe water practices, and prevention of micronutrient deficiencies.
Implications for policy: The Ethiopian primary health care system could consider integrating the DIBE approach into the existing Health Extension Programme and routine community-based maternal and child nutrition services. Implementation should include standardised training, supportive supervision, and monitoring of intervention delivery.
Implications for future research: Future studies should evaluate the feasibility, cost-effectiveness, scalability, fidelity, and sustainability of delivering DIBE through routine primary health care services. Longer-term studies are also needed to determine whether the observed improvements in child nutritional outcomes are sustained beyond the 17-month follow-up period.
Limitations
This study has several limitations. First, children were followed for 17 months and naturally aged during follow-up; however, age-related changes occurred comparably in the intervention and control groups. Second, only 16 LCUs were selected from approximately 200 eligible LCUs, which may limit the generalisability and precision of cluster-level estimates. Although geographical separation and cluster-level allocation were used to minimise contamination, some exchange of nutrition-related information between communities cannot be completely excluded. Third, blinding of mothers and Health Extension Workers was not possible, which may have introduced performance or reporting bias. Nevertheless, objective anthropometric and haemoglobin measurements were used for key outcomes. Fourth, maternal knowledge and behavioural information was partly self-reported and may therefore be subject to recall and social-desirability bias. Fifth, detailed quantitative dietary assessment was not conducted, limiting our ability to quantify changes in children’s dietary intake and to determine whether reported improvements in maternal practices translated into measurable changes in dietary intake. Finally, the extensive longitudinal dataset generated during the 17-month intervention required the present manuscript to focus on pre-specified primary outcomes and key explanatory variables; other intervention-related findings may be reported separately.
Supplementary material
The supplementary material for this article can be found at https://doi.org/10.1017/S1463423626101960.
Data availability statement
Data are available from the Harvard Dataverse International Data Access view at: dataset named Promoting dietary intake behaviour to enhance children’s iron levels and improve growth in Ethiopia: low unit community trial. (View at https://dataverse.harvard.edu/dataset.xhtml?persistentId=doi:10.7910/DVN/HCC6CT).
Acknowledgements
First, we thank Jimma University for providing us with the opportunity to conduct this study. We extend our special appreciation to the Arsi Zone administrative offices and the Zone Health Department for their assistance and cooperation during the data collection and intervention periods. Finally, we thank the health extension workers of the 16 rural low community units and study participants. We also thank the head of the eight health officers for their involvement in this study.
Author contributions
Conception and design AF, MA, TB; investigation: AF, MA, TB; methodology: AF, MA, TB, formal analysis: AF, MA, TB; writing – original draft: AF, MA, TB; editing of the manuscript: AF, MA, TB; Giving final approval: AF, MA, TB; Project and Financial administration AF.
Funding statement
This study was supported by Jimma University under the gran number T/AI/M/D/M/DA/3022/2018. The funder had no role in the study design, data collection, analysis and interpretation of the data, decision to publish, or preparation of the manuscript.
Competing interests
We have disclosed no conflicts of interest.
Ethical standards
The Jimma University Institutional Review Ethics Board (IRth) granted approval for our research on January 1, 2018 (reference number IHRPGD/3007/18). Although the study commenced in April 2021, the delay was primarily related to prolonged financial and administrative transfer processes, procurement of essential reagents and study materials, and disruptions associated with the COVID-19 pandemic. During this period, communication was maintained with the IRB and relevant authorities regarding the study’s implementation. The study commenced after the necessary preparatory requirements had been fulfilled, with no ethical concerns raised regarding its implementation.


 Open access

