Democrat Barack Obama is going to defeat Republican Mitt Romney by a comfortable margin in the 2012 presidential election. This forecast comes from a statistical model that uses the primary performance of the candidates and a cycle in presidential elections to predict the presidential vote. In plain English, Obama has history on his side as well as the fact that he was unchallenged in the primaries. The model, called The Primary Model because of its heavy reliance on primaries, covers elections from 1912, the beginning of presidential primaries. Since 1952, however, only the New Hampshire Primary is used; we justify the choice of New Hampshire at some length.
Overshadowed by the intense Republican battle in that state this year, Obama won the 2012 primary contest of his party in New Hampshire in commanding fashion. For the record, Obama captured 82% of the votes in the Democratic primary of that state, against token opponents. Any time a candidate of the party that controls the White House has gone unchallenged for renomination, the odds are overwhelmingly in favor of that candidate's victory in the November election. This was evident in 1912, when the incumbent president William Howard Taft first lost the primary battle and then the general election. Primary challenges to Truman (1952), Johnson (1968), Ford (1976), Carter (1980), and Bush (1992) augured poorly for them or their party in the general election.
The moment the New Hampshire Primary was decided, the model was able to make a forecast for any match-up in November between Democratic and Republican candidates (first posted January 12, 2012, at http://www.huffingtonpost.com/helmut-norpoth/new-hampshire-primary-for_b_1200199.html).
The forecast gives Barack Obama 53.2% of the two-party vote over Mitt Romney with 46.8%. It is an unconditional forecast subject to no updating or other revision. It assures Obama's reelection with 88% certainty.
THE FORECAST MODEL
The Primary Model, with some modifications, has proved itself in the four previous elections (Norpoth Reference Norpoth, Campbell and Garand2000, Reference Norpoth2001, Reference Norpoth2004, and Reference Norpoth2008). It relies on the showings of candidates in primaries—hence the name of the model—along with a cyclical dynamic of presidential elections, and a partisan adjustment.Footnote 1
The Primary Vote
Winning or losing the primary battle has proved to be good barometer of the outcome of the general election, going back 100 years to 1912, when primaries were introduced. Our measure of primary support uses the vote percentage in primaries. For sitting presidents, who count on being renominated without challenge, we take the vote share received in primaries. For contests without a sitting president, where competition is natural, we form a measure of relative strength. We do this by expressing a nominee's primary vote relative to the vote received by that candidate's chief rival (the one with the next most votes, or the leading vote-getter if the nominee did not win the primary battle). Short of knowing who the nominee will be, this rule can be applied to any candidate in primary contests so we can make forecasts for all possible match-ups until the nominations are decided.Footnote 2
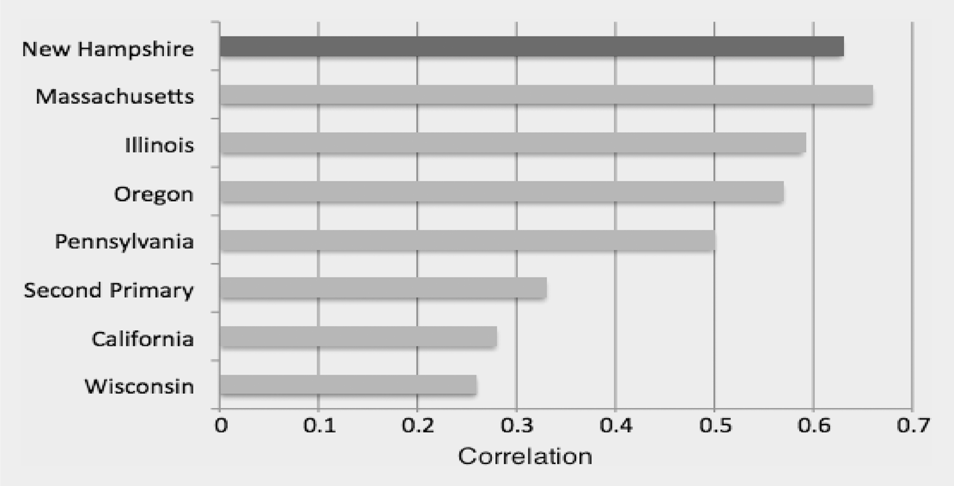
From 1912 through 1948, the results of all primaries were included, but from 1952 onward only the New Hampshire primary is used in our model. In 1952, the adoption of a presidential ballot in the first primary dramatically changed the dynamic of the presidential nominating contest (Adams Reference Adams, Orren and Polsby1987; Buell Reference Buell and Mayer2000). How well does New Hampshire's track record in predicting the November vote compare with that of other states since 1952? Let us first consider primary contests within the incumbent party, the one that controls the White House. Figure 1 includes all the states that held primaries in every election year since 1952. The correlation between the support received by such nominees in the New Hampshire primary and their vote in the general election in November is high, but it turns out, only second highest to Massachusetts.Footnote 3 So should we replace New Hampshire with Massachusetts?
Primary Support for Incumbent-Party Nominee and General Election Vote, 1952–2008

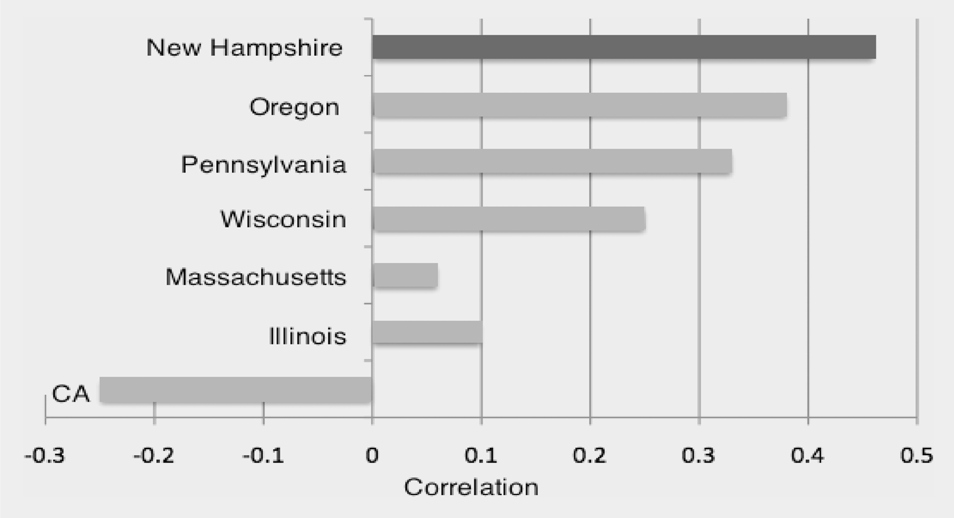
Before considering that option, let us look at the primary contests within the party in opposition to the White House party, again for the states that held primaries in all elections years since 1952. As shown in figure 2, New Hampshire dominates these rankings.Footnote 4 The opposition-party nominee's performance in Massachusetts offers almost no guidance for picking the winner in November. The New Hampshire average of incumbent and opposition primary performance clearly beats the Massachusetts average.
Primary Support for Opposition-Party Nominee and General Election Vote, 1952–2008

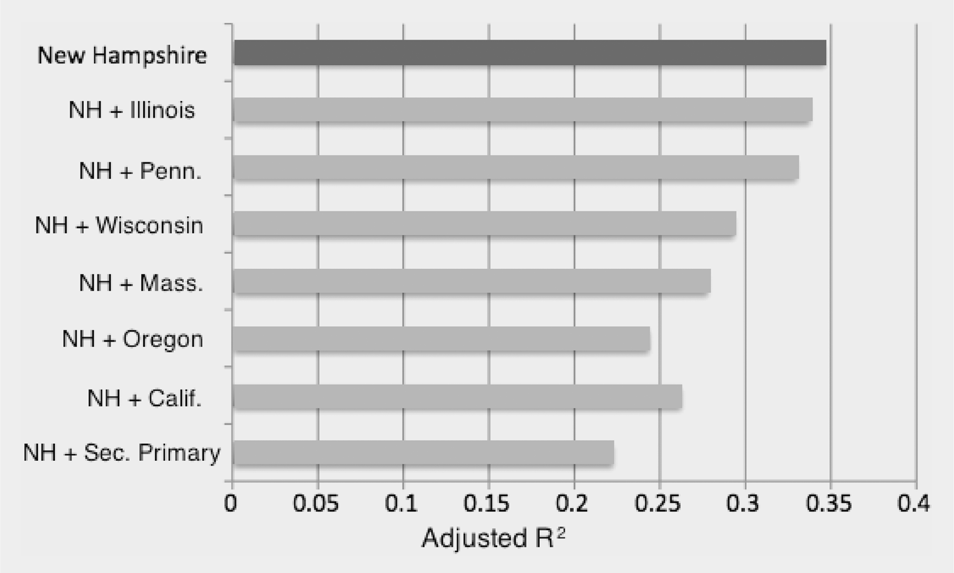
Given the critical role of the order of primaries, we also considered the possibility that whichever state goes next to New Hampshire might offer a better prediction for the general election. We did this test for second, third, fourth, and fifth primaries past New Hampshire. None of them produce averages for incumbent-party and opposition-party primary performance that top New Hampshire. As a final test, we examined whether adding any other state to the New Hampshire equation produces a better prediction for the general election. The answer, according to figure 3, is a resounding no. New Hampshire alone does better than combinations of New Hampshire and other primaries.Footnote 5
The Predictive Power of Primaries: New Hampshire and New Hampshire Plus (For Incumbent and Opposition-Party Nominees)

Primaries aside, at least one caucus state might clamor for attention in the election forecasting business. Iowa has featured the first contest in presidential nomination politics for some time, preceding the New Hampshire primary. The Iowa precinct caucuses have been a regular event only since 1972, so the window for testing their effect is smaller than it is for primaries. Nonetheless, could Iowa serve as a better barometer of the general election during that time frame? Barack Obama, after all, followed up his victory in the Democratic caucuses in Iowa with a victory in November over John McCain. The statistical evidence for 1972–2008 does not elevate his case to the norm. The correlations between support in Iowa and general election vote fall short of the ones for New Hampshire. For incumbent-party nominees, the correlation is 0.44 for Iowa compared with 0.69 for New Hampshire. For opposition-party nominees, the correlation for Iowa actually has the wrong sign (−0.33). Obama's success in going from Iowa to the White House as the nominee of the out-party was truly exceptional. It would be an invalid reason to revise the forecasting model. The inclusion of Iowa would not be an improvement over New Hampshire in the Primary Model.
What makes the New Hampshire primary such a superior predictor of the general election vote? First, its first place on the primary calendar guarantees New Hampshire the nearly undivided attention of all presidential candidates and the media. Plus, it is easy for candidates to enter the New Hampshire primary; getting on the ballot only requires a $1,000 filing fee from a candidate. Furthermore, New Hampshire allows Independents to vote in a party primary; they account for close to half of New Hampshire primary voters. Hence, candidates are not just tested by the party faithful but also by large numbers of Independents whose vote in November is pivotal for the outcome of the general election. With all the serious presidential candidates campaigning, and Independents eligible, voter turnout in New Hampshire is nearly as high as in the general election. No other primary puts candidates to such a rigorous test in every election year than New Hampshire.
The Presidential Cycle
In addition to primaries, the forecast model enlists a cyclical dynamic (Jones Reference Jones2002; Norpoth Reference Norpoth1995). Over the course of two centuries, American presidential elections have exhibited a distinct cycle. This is not the pattern associated with long-term partisan realignments but a more short-term cycle. As an example, let us examine elections since 1960. Whenever the White House party was in its first term, it has won reelection in five of six cases, with an average share of 55.5% of the two-party vote. Compare that to instances in which the White House party went for reelection after two or more terms. Since 1960, it has lost six of seven such elections, averaging a vote share below 50%. It appears that the prospect of losing looms large for the presidential party when it has held the White House for two or more terms. But the White House party has little to fear when it has been there just for one term.
This trend may be because a president who enters the White House by defeating the candidate of the incumbent party—perhaps the sitting president himself—starts out with a pledge of change: from Kennedy's “New Frontier” in 1960, through Reaganomics in 1980, to Obama's “Hope and Change” in 2008. The electorate has loudly registered the demand, “It's time for a change.” Change, however, takes time to be implemented. At such moments in history the public may show some patience with the efforts of a new administration to work its magic. When two terms are up, however, the public may no longer be inclined to give the administration the benefit of the doubt. By then, of course, the two-term limit prevents a sitting president from running for another term, making the odds of retaining the White House even longer for the presidential party.
Whatever the explanation, the pattern illustrated for the last 50 years can be spotted in presidential elections back to 1828, when popular voting took hold across the United States (Norpoth Reference Norpoth, Dorussen and Taylor2002). This “cycle” in presidential elections, which occurs in an irregular fashion, is handled by means of a second-order autoregressive process with a positive parameter for the first lag and a negative one for the second (Yule Reference Yule, Stuart and Kendall1971). It produces an estimate for the average tenure of a White House party that comes to two-and-a-half terms. So, it is not just recent history (since 1960), but electoral history going back to 1828 that augurs well for Obama in 2012. Having ousted the Republicans from the White House in 2008, he has an expected lease on the property for two terms, while leaving his party with a 50-50 chance of retaining it for another term. History alone forecasts an Obama victory with 51.8% of the two-party vote, although with only a 66% certainty.Footnote 6
MODEL ESTIMATES
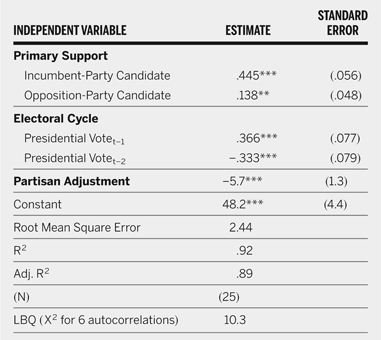
The parameter estimates of the forecast model, along with diagnostics, are shown in table 1. Note that the dependent variable is the Democratic percentage of the major-party vote, regardless of whether that party was in the White House or not. As a result, the primary-support variables are inverted for elections with Republicans in control.Footnote 7 With the primary support of the incumbent-party candidate carrying much greater weight than the one of the opposition-party candidate, whatever happened in 2012 on the Democratic side packs a bigger predictive wallop for the vote in November 2012 than what happened in the Republican contest. The estimates for the autoregressive vote parameters translate into an expected length of two-and-a-half terms of party control of the White House. That is good news for a first-term president like Obama in 2012, seeking reelection. Taken all by itself, the electoral cycle makes Obama the favorite this year, but the predicted vote margin would be too small to offer much comfort. Finally, the adjustment for pre-New Deal partisanship produces a constant estimate that suggests a close balance in presidential elections, notwithstanding the lead that Democrats have enjoyed in party identification for much of the time since the New Deal.
Estimates of the Primary Model

Source: CQ Guide to U.S. Elections, 3rd ed., 1994, pp. 489–560; CQ Weekly Report, Aug. 3, 1996, p. 63, and Aug. 17, 1996, p. 79; Pomper 2001, pp. 32, 35; www.primary.monitor.com, Jan. 29, 2004; http://politics.nytimes.com/election-guide/2008/results/index.html,1/9/2008.
Note: The dependent variable is the Democratic percentage of the two-party vote in presidential elections; for the 1912 election, however, the two-party vote division was approximated by the House vote. The primary support variables are capped in the 35–65 range and mean-inverted for years of Republican control of the presidency. The partisan adjustment is a binary variable (coded 1 for elections up to 1932, and 0 for elections since).
* p < .05
** p < .01
*** p < .001
THE 2012 FORECAST
All of the information required by the Primary Model to make a forecast for the presidential election in November 2012 has been known since the New Hampshire Primary was held. Hence, we offer an unconditional forecast for the contest between Democrat Barack Obama and Republican Mitt Romney. This is a final forecast; there is no possibility of revision. The prediction equation for the presidential vote in 2012 (expressed as the Democratic share of the major-party vote) is:
 $$
.445({\rm DPRIM} - 56.7) + .138({\rm RPRIM} - 47.7){\rm }( - 1)
$$
where DPRIM represents the primary support of the Democratic (incumbent party) nominee for President and RPRIM that of the Republican (opposition party) nominee, capped within a 35–65% range. Some observers may be surprised that Obama was on the ballot in the New Hampshire primary. He did win in commanding fashion against a field of unknown vanity or write-in candidates. No Democrat of any stature challenged Obama for renomination in New Hampshire or any subsequent primary or caucus. Thus, New Hampshire provided a clear signal that Obama's renomination would go uncontested. No sitting president who enjoyed this benefit has lost the general election. Meanwhile in the hotly contested Republican primary in New Hampshire, Romney won handily.Footnote 8 For the 2012 general election, the Primary Model forecasts 53.2% of the two-party popular vote for Obama. This assures Obama's reelection with 88% certainty.
CONCLUSION
In the 2012 presidential election, the twin advantages of history and primary make Obama a strong favorite to defeat Mitt Romney. Hardly any president who came to office in an election that ousted the White House party has lost his bid for reelection. This likelihood practically goes to zero for sitting presidents who faced no challenge in primaries. Using primary elections has numerous advantages for election forecasting. It enlarges the set of presidential elections needed for model estimation back to 1912; it features not only the incumbent side, but also opposition candidates; and it provides a real-life test of the candidates' electoral performance, not proxy variables or trial-heats. For more than 50 years, New Hampshire has encapsulated the primary message. Considering primary contests in both parties, no other primary (or caucus, to include Iowa) tops New Hampshire in forecasting the outcome in November. Nor does adding any other state to New Hampshire improve the accuracy of the prediction. So as the first primary, New Hampshire hands the Primary Model one more advantage—being the first one to make an unconditional forecast of the presidential election in November.