1 Introduction
Since well into the 19th century, it has been known that the equations of compressible gas dynamics form shocks, i.e. lines or surfaces across which variables change in a discontinuous fashion (Courant & Friedrichs Reference Courant and Friedrichs1948; Landau & Lifshitz Reference Landau and Lifshitz1984). This makes them perhaps the earliest example of a singularity of solutions to a partial differential equation (Eggers & Fontelos Reference Eggers and Fontelos2015). For smooth initial data, shock formation is associated with a gradual steepening and eventual overturning of the velocity and density profiles. A shock develops at the point where the slope first becomes infinite. The shock location can be calculated from the overturned profile via the so-called Rankine–Hugoniot conditions (see e.g. Courant & Friedrichs Reference Courant and Friedrichs1948). The generic solution of hyperbolic (not linearly degenerate) systems in one space dimension with smooth initial data develops a cusp catastrophe, while the solution to elliptic systems in one space dimension develops an elliptic umbilic catastrophe (Dubrovin et al. Reference Dubrovin, Grava, Klein and Moro2015).
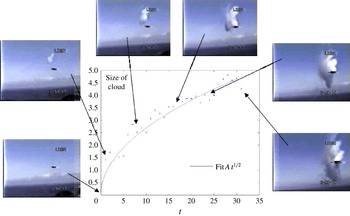
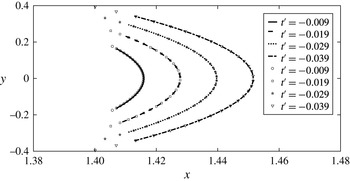
Relatively little emphasis has been placed on the description of how a shock is formed initially, starting from smooth initial data. The expectation is that the solution near the singular point is self-similar (Eggers & Fontelos Reference Eggers and Fontelos2015), but self-similar properties, in particular in more than one dimension, have also not received much attention until recently (Manakov & Santini Reference Manakov and Santini2008, Reference Manakov and Santini2012; Pomeau et al. Reference Pomeau, Le Berre, Guyenne and Grilli2008b ; Eggers & Fontelos Reference Eggers and Fontelos2009). We will show that in the transversal direction, the size of the shock solution scales like the square root of time, a fact which is confirmed readily from observation, see figure 1.
The spreading of a shock wave behind a supersonic plane, as marked by the condensation cloud produced by the shock. The data are based on measurements from a video (https://www.youtube.com/watch?v=gWGLAAYdbbc), with some sample images shown. Image and data analysis by Patrice Legal, used with permission. The width of the cloud scales like
 $t^{1/2}$
, as measured from the initiation of the cloud. Absolute units of space and time are unknown.

It has been conjectured for a long time (Thom Reference Thom and Hilton1976; Poston & Stewart Reference Poston and Stewart1978) that the formation of a shock in gas dynamics is analogous to the formation of caustics of wave fields (Nye Reference Nye1999), and thus is part of the same hierarchy of singularities which can be classified using catastrophe theory (Berry Reference Berry, Balian, Kleman and Poirier1981; Arnold Reference Arnold1989, Reference Arnold1990). The simplest such singularity is the fold, which originates from a point of higher symmetry called the cusp catastrophe (Nye Reference Nye1999). Thus the cusp catastrophe is the point where the singularity is expected to occur for the first time, unless initial conditions are chosen such that the catastrophe is of higher order (Nye Reference Nye1999). Examples of experimental observations of cusp catastrophes are found in optics (Nye Reference Nye1999), shock waves (Sturtevant & Kulkarny Reference Sturtevant and Kulkarny1976) and clouds of cold atoms (Rosenblum et al. Reference Rosenblum, Bechler, Shomroni, Kaner, Arusi-Parpar, Raz and Dayan2014). Note however that the cusp catastrophe considered for example in Sturtevant & Kulkarny (Reference Sturtevant and Kulkarny1976), Cramer & Seebass (Reference Cramer and Seebass1978), Cates & Crighton (Reference Cates and Crighton1990), Cates & Sturtevant (Reference Cates and Sturtevant1997) appears in the shape of the shock front itself, whereas we consider the evolution of the velocity and density fields as a shock is formed.
In order to use catastrophe theory, one needs to describe the phenomenon by means of a smooth mapping, whose singularities can be classified. In optics, Fermat’s principle guarantees the existence of such a function (Nye Reference Nye1999). In the case of shock dynamics, the method of characteristics can provide an analogous function (Arnold Reference Arnold1989), but its existence is usually guaranteed only in one space dimension (Courant & Friedrichs Reference Courant and Friedrichs1948) or for the simplest purely kinematic equation (Pomeau et al. Reference Pomeau, Le Berre, Guyenne and Grilli2008b ). We proposed an extension of the method of characteristics for the disperisonless Kadomtsev–Petviashvili (dKP) equation (Grava, Klein & Eggers Reference Grava, Klein and Eggers2016) and its generalizations (Dubrovin, Grava & Klein Reference Dubrovin, Grava and Klein2016) which removes the singularity in the neighbourhood of a shock, so that the unfolded profile can be expanded about the shock position. However, in the case of the full two- or three-dimensional equations of compressible gas dynamics, no such smooth unfolding is known to exist, so catastrophe theory or an analogous method of expansion cannot be applied.
Instead, we resort to solving the equations of motion directly near the singularity, whose structure is expected to resemble the cusp catastrophe of geometrical optics. The key idea is to use the self-similar properties of the cusp catastrophe in order to obtain a leading-order solution of the equations of motion in powers of the time distance
 $t^{\prime }=t_{0}-t$
to the singularity, where
 $t_{0}$
is the time of blow up. We will find below that for a slice at a constant value
 $y$
of the direction transversal to the propagation direction
 $x$
, our shock solution has the form of a simple wave in shock theory (Riemann Reference Riemann1860; Landau & Lifshitz Reference Landau and Lifshitz1984). The solution of a simple wave, in turn, can be brought into a form equivalent to the solution of the one-dimensional kinematic wave equation for a velocity
 $u(x,t)$
:
 $$\begin{eqnarray}\displaystyle u_{t}+uu_{x}=0, & & \displaystyle\end{eqnarray}$$
which we consider now to illustrate the solution of the full Euler problem below; subscripts denote the derivatives with respect to
 $t$
and
 $x$
.
Using the method of characteristics, one shows that (1.1), subject to smooth initial conditions
 $u(x,0)=u_{0}(x)$
, always produces a shock at some time
 $t_{0}$
and position
 $x_{0}$
, see e.g. Landau & Lifshitz Reference Landau and Lifshitz1984. The profile becomes vertical at the shock, so we have
 $\unicode[STIX]{x2202}x/\unicode[STIX]{x2202}u=0$
. The condition that
 $t_{0}$
is the first time this occurs is that the second derivative also vanishes:
 $\unicode[STIX]{x2202}^{2}x/\unicode[STIX]{x2202}u^{2}=0$
; however, for generic initial conditions the third derivative will remain finite at
 $t_{0}$
and
 $x_{0}$
. The self-similar structure of these shock solutions has been investigated in detail (Pomeau et al.
Reference Pomeau, Jamin, Le Bars, Le Gal and Audoly2008a
; Eggers & Fontelos Reference Eggers and Fontelos2009, Reference Eggers and Fontelos2015); to find the similarity exponents, let us assume the scalings
 $x^{\prime }\propto t^{\prime \unicode[STIX]{x1D6FD}_{1}}$
and
 $u\propto t^{\prime \unicode[STIX]{x1D6FC}}$
, where
 $x^{\prime }=x-x_{0}$
and
 $t^{\prime }=t_{0}-t$
, so that
 $t^{\prime }>0$
before the singularity, and
 $t^{\prime }<0$
after. Balancing the two terms in (1.1), we obtain
 $\unicode[STIX]{x1D6FC}-1=2\unicode[STIX]{x1D6FC}-\unicode[STIX]{x1D6FD}_{1}$
, and so
 $\unicode[STIX]{x1D6FC}=\unicode[STIX]{x1D6FD}_{1}-1$
. For
 $(\unicode[STIX]{x2202}^{3}x/\unicode[STIX]{x2202}u^{3})$
to be finite as
 $t^{\prime }\rightarrow 0$
, we have to require
 $\unicode[STIX]{x1D6FC}=3\unicode[STIX]{x1D6FD}_{1}$
, so that
 $\unicode[STIX]{x1D6FC}=1/2$
and
 $\unicode[STIX]{x1D6FD}_{1}=3/2$
.
Now we allow the initial condition to depend on the transversal variable
 $y$
as well, so there will be a value
 $y_{0}$
for which the shock occurs first, at some time
 $t_{0}$
. Denoting the time a shock forms by
 $t_{c}(y^{\prime })$
with
 $y^{\prime }=y-y_{0}$
, we must have
 $t_{c}(y^{\prime })-t_{0}=ay^{\prime 2}+O(y^{3})$
; the linear term must vanish, since otherwise there would be a
 $y^{\prime }\neq 0$
where blow up would occur at a time earlier than
 $t_{0}$
. Thus if
 $y^{\prime }\propto t^{\prime \unicode[STIX]{x1D6FD}_{2}}$
is a typical size of the singularity in the transversal direction, we have
 $ay^{\prime 2}\propto t^{\prime }$
, and it follows that
 $\unicode[STIX]{x1D6FD}_{2}=1/2$
. These scaling exponents correspond to those found previously for wave breaking (Pomeau et al.
Reference Pomeau, Jamin, Le Bars, Le Gal and Audoly2008a
,Reference Pomeau, Le Berre, Guyenne and Grilli
b
), the cusp caustic (Eggers et al.
Reference Eggers, Hoppe, Hynek and Suramlishvili2014) and for shock formation in two dimensions (Grava et al.
Reference Grava, Klein and Eggers2016).
To find the similarity solution to (1.1) valid near the point where a shock first forms, we make the similarity ansatz
 $$\begin{eqnarray}\displaystyle u(x,y,t)=|t^{\prime }|^{1/2}U(\unicode[STIX]{x1D709},\unicode[STIX]{x1D702}),\quad \unicode[STIX]{x1D709}={\displaystyle \frac{x^{\prime }}{|t^{\prime }|^{3/2}}},\quad \unicode[STIX]{x1D702}={\displaystyle \frac{y^{\prime }}{|t^{\prime }|^{1/2}}}. & & \displaystyle\end{eqnarray}$$
Inserting this into (1.1) we obtain
 $$\begin{eqnarray}\displaystyle U-3\unicode[STIX]{x1D709}U_{\unicode[STIX]{x1D709}}-\unicode[STIX]{x1D702}U_{\unicode[STIX]{x1D702}}=\pm 2UU_{\unicode[STIX]{x1D709}}, & & \displaystyle\end{eqnarray}$$
which up to a factor coming from the propagation of sound is the same as the similarity equation we will derive below for the full two-dimensional Euler equation. The solution of (1.3) will be discussed below, and will provide us with the full solution to the shock problem in the self-similar region. Note that reference length scales of the shock solution are set by the initial condition alone, so here and in future we leave the similarity variables as dimensional quantities.
Of course, (1.1) has an exact solution by the method of characteristics, namely
 $$\begin{eqnarray}\displaystyle u(x,y,t)=u_{0}(s,y),\quad x(s,y,t)=u_{0}(s,y)t+s, & & \displaystyle\end{eqnarray}$$
where
 $u_{0}(x,y)$
are the initial data. We expand
 $u_{0}$
into a Taylor series around the shock point
 $(x_{0},y_{0})$
to third order, subject to the extremal conditions
 $$\begin{eqnarray}\displaystyle \frac{\unicode[STIX]{x2202}^{2}u_{0}}{\unicode[STIX]{x2202}s^{2}}=\frac{\unicode[STIX]{x2202}^{2}u_{0}}{\unicode[STIX]{x2202}s\unicode[STIX]{x2202}y}=0, & & \displaystyle\end{eqnarray}$$
which guarantee that the shock appears at
 $t=t_{0}$
and
 $y=y_{0}$
first. All the other terms are of higher order in
 $t^{\prime }$
. Then the similarity profile
 $U(\unicode[STIX]{x1D709},\unicode[STIX]{x1D702})$
is obtained by introducing the rescaled variables
 $$\begin{eqnarray}\displaystyle \unicode[STIX]{x1D709}={\displaystyle \frac{x^{\prime }-b_{1}y^{\prime }/a-b_{2}y^{\prime 2}/a+b_{1}y^{\prime }t^{\prime }}{|t^{\prime }|^{3/2}}},\quad \unicode[STIX]{x1D702}={\displaystyle \frac{y^{\prime }}{|t^{\prime }|^{1/2}}},\quad U={\displaystyle \frac{u_{0}(s,y)-u_{0}-b_{1}y^{\prime }-b_{2}y^{\prime 2}}{|t^{\prime }|^{1/2}}}, & & \displaystyle \nonumber\\ \displaystyle & & \displaystyle\end{eqnarray}$$
where the constants
 $a,b_{1},b_{2}$
depend on the initial data. It is easy to check that the similarity solution
 $U(\unicode[STIX]{x1D709},\unicode[STIX]{x1D702})$
thus obtained (and which we will discuss in detail below) corresponds indeed to the most general regular solution of (1.3). In the next section we will model shock formation in the full two-dimensional Euler equation on the above similarity solution.
2 Equations of motion
We consider the compressible Euler equation in two space dimensions, and denote the spatial variables by
 $\boldsymbol{x}=(x,y)\in \mathbb{R}^{2}$
. The velocity field
 $\boldsymbol{v}=(u,v)$
is assumed irrotational:
 $\boldsymbol{v}=\unicode[STIX]{x1D735}\unicode[STIX]{x1D719}$
. Before the formation of a shock, we can consider the flow to be isentropic. For simplicity, we assume the relation between density
 $\unicode[STIX]{x1D70C}$
and pressure
 $p$
to be described by the polytropic ideal gas law (Landau & Lifshitz Reference Landau and Lifshitz1984)
 $$\begin{eqnarray}\displaystyle p=\frac{A}{\unicode[STIX]{x1D6FE}}\unicode[STIX]{x1D70C}^{\unicode[STIX]{x1D6FE}}, & & \displaystyle\end{eqnarray}$$
where
 $A$
is a constant and
 $\unicode[STIX]{x1D6FE}$
is the adiabatic exponent. The compressible Euler system consists of three equations for the functions
 $\unicode[STIX]{x1D70C}$
and
 $\boldsymbol{v}=(u,v)$
, which correspond to balance statements for mass and linear momentum:
 $$\begin{eqnarray}\displaystyle & \displaystyle \frac{\unicode[STIX]{x2202}\unicode[STIX]{x1D70C}}{\unicode[STIX]{x2202}t}+\unicode[STIX]{x1D735}\boldsymbol{\cdot }(\unicode[STIX]{x1D70C}\boldsymbol{v})=0, & \displaystyle\end{eqnarray}$$
 $$\begin{eqnarray}\displaystyle & \displaystyle \frac{\unicode[STIX]{x2202}\boldsymbol{v}}{\unicode[STIX]{x2202}t}+(\boldsymbol{v}\boldsymbol{\cdot }\unicode[STIX]{x1D735})\boldsymbol{v}=-\frac{1}{\unicode[STIX]{x1D70C}}\unicode[STIX]{x1D735}p; & \displaystyle\end{eqnarray}$$
here
 $\unicode[STIX]{x1D735}=(\unicode[STIX]{x2202}_{x},\unicode[STIX]{x2202}_{y})$
. Using the potential flow assumption, (2.3) can be integrated to
 $$\begin{eqnarray}\displaystyle \frac{\unicode[STIX]{x2202}\unicode[STIX]{x1D719}}{\unicode[STIX]{x2202}t}+\frac{1}{2}|\unicode[STIX]{x1D735}\unicode[STIX]{x1D719}|^{2}=-\frac{A}{\unicode[STIX]{x1D6FE}-1}(\unicode[STIX]{x1D70C}^{\unicode[STIX]{x1D6FE}-1}-\unicode[STIX]{x1D70C}_{0}^{\unicode[STIX]{x1D6FE}-1}), & & \displaystyle\end{eqnarray}$$
where the constant of integration is an arbitrary function of time. However, we have the freedom to absorb this constant of integration into a redefinition of the potential. As a matter of convenience, in (2.4) we have used this freedom to choose the constant of integration such that the potential vanishes at the point where the shock first appears, where we take the density to be
 $\unicode[STIX]{x1D70C}_{0}$
.
The isentropic compressible Euler equation admits classical solution if the initial data are sufficiently regular (Lax Reference Lax1973). However it is well known that, even starting from extremely regular initial data, the solution of the Euler equation develops singularities in finite time (Majda Reference Majda and Beirão da Veiga1984; Christodoulou Reference Christodoulou2007). An estimate of the blow-up time of classical solutions has been obtained in Alinhac (Reference Alinhac1993) for small perturbations of constant initial data.
In this manuscript we address the nature of singularity formation for classical solutions. After the formation of the singularity the solution exists only in a weak sense, and hence to fix a solution uniquely, extra conditions have to be imposed. When dealing with systems coming from physics, the second law of thermodynamics naturally induces such conditions, by assuming that weak solutions satisfy certain entropy inequalities (which correspond to the Rankine–Hugoniot conditions, see e.g. Hopf Reference Hopf1950; Cole Reference Cole1951; Landau & Lifshitz Reference Landau and Lifshitz1984. The theory is quite mature for hyperbolic systems in one space dimension or for hyperbolic scalar equations in more than one space dimension. In these cases the Rankine–Hugoniot conditions single out uniquely a solution which coincides with that obtained in the limit of vanishing viscosity, see e.g. Kruzkov (Reference Kruzkov1969), Bianchini & Bressan (Reference Bianchini and Bressan2005).
However, when dealing with systems of conservation laws in more than one space dimension, it is still an intriguing mathematical problem to develop a theory of well posedness for the Cauchy problem which includes the formation and evolution of shock waves. In particular for the compressible Euler equation in two space dimensions it has been shown that the entropy inequalities do not guarantee uniqueness and some counter-examples are obtained for initial data that are locally Lipschitz (Elling Reference Elling2006; Chiodaroli & De Lellis Reference Chiodaroli and De Lellis2015). However in this manuscript we are interested in the evolution of a classical solution (at least
 $C^{1}$
) into its first singularity, and in the local structure of the shock near this singularity.
Below we will consider the coupled set of equations (2.2), (2.3). Since entropy is created in a shock, the adiabatic gas law (2.1) and thus (2.3) will no longer strictly be valid after shock formation. However, for a short time entropy production is still weak, so we will still be able to use an adiabatic description to leading order.
3 Similarity structure
We are interested in describing the formation of a singularity in solutions of the compressible Euler equation. At the point where the singularity first forms, the gradients of all variables
 $\unicode[STIX]{x1D70C},u,v$
blow up, while the variables themselves remain finite. In the generic case, the singularity develops at a point (the gradient blowing up along a line corresponds to a non-generic initial condition); we denote the conditions at this point (such as the density
 $\unicode[STIX]{x1D70C}_{0}$
or the velocity
 $\boldsymbol{v}_{0}=(u_{0},v_{0})$
) with the subscript zero. We assume that at the critical time
 $t_{0}$
the gradient
 $\unicode[STIX]{x1D735}u$
blows up at one point
 $(x_{0},y_{0})$
in all directions of the
 $(x,y)$
plane except one, in which it remains bounded. By contrast, a gradient blowing up in all directions corresponds to an elliptic umbilic singularity, typical of elliptic systems.
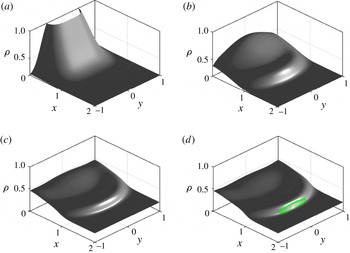
Time evolution of the density, as described by the compressible Euler equation at
 $t=0$
(a),
 $t=0.4$
(b),
 $t=0.511$
(c) and
 $t=0.55$
(d). The initial condition is a concentrated density in an initially quiescent fluid, as given in (5.1). At (c), a shock forms, which has spread in (d); the green line indicates the region where the profile has become vertical to within numerical resolution.

Using the invariance of the Euler equation under rotation in the
 $(x,y)$
-plane, we denote the direction where the gradient of
 $u$
remains bounded at the critical point by
 $y$
, while
 $\unicode[STIX]{x2202}x/\unicode[STIX]{x2202}u=0$
. We remark that this condition does not require any symmetry of the initial data about
 $y=0$
. Since the flow is potential, it follows that the first derivative
 $v_{x}=u_{y}$
remains bounded at the singular point. As before, the condition that the profile has not already overturned amounts to demanding that
 $\unicode[STIX]{x2202}^{2}x/\unicode[STIX]{x2202}u^{2}=0$
, while the third derivative will in general be finite (Landau & Lifshitz Reference Landau and Lifshitz1984; Majda Reference Majda and Beirão da Veiga1984). Thus, in summary, at the point of the wave profile first becoming singular we have the conditions
 $$\begin{eqnarray}\displaystyle \frac{\unicode[STIX]{x2202}u}{\unicode[STIX]{x2202}y}=\text{const},\quad \frac{\unicode[STIX]{x2202}x}{\unicode[STIX]{x2202}u}=0,\quad \frac{\unicode[STIX]{x2202}^{2}x}{\unicode[STIX]{x2202}u^{2}}=0,\quad \frac{\unicode[STIX]{x2202}^{3}x}{\unicode[STIX]{x2202}u^{3}}=\text{const}. & & \displaystyle\end{eqnarray}$$
This is illustrated in figure 2, which shows an example of a numerical simulation of the Euler equation to be described in more detail in § 5. It starts from a smooth initial condition for the density, whose profile gradually steepens, until a shock is formed at a point
 $(x_{0},y_{0}=0)$
at the time
 $t=t_{0}$
(panel (c)). For
 $t>t_{0}$
, the shock spreads along a line transversal to the direction of propagation (in the
 $x$
-direction), while the height of the jump increases.
We move into a frame of reference such that
 $$\begin{eqnarray}\displaystyle \boldsymbol{v}_{0}\equiv (u_{0},v_{0})=0 & & \displaystyle\end{eqnarray}$$
at the point where the singularity is formed. The speed of sound at the singular point is
 $$\begin{eqnarray}\displaystyle c_{0}^{2}=\frac{\unicode[STIX]{x2202}p}{\unicode[STIX]{x2202}\unicode[STIX]{x1D70C}}=A\unicode[STIX]{x1D70C}_{0}^{\unicode[STIX]{x1D6FE}-1}. & & \displaystyle\end{eqnarray}$$
To describe the neighbourhood of the singularity, we use a self-similar description (Eggers & Fontelos Reference Eggers and Fontelos2015), in analogy to caustic singularities in two dimensions (Eggers et al. Reference Eggers, Hoppe, Hynek and Suramlishvili2014) and shocks in the dKP equation (Grava et al. Reference Grava, Klein and Eggers2016).
As explained in the case of the kinematic wave equation, in the self-similar region, we assume the scalings
 $x^{\prime }\propto t^{\prime 3/2}$
,
 $y^{\prime }\propto t^{\prime 1/2}$
and
 $u\propto t^{\prime 1/2}$
. Thus we consider the ansatz
 $$\begin{eqnarray}\displaystyle \left.\begin{array}{@{}c@{}}\displaystyle \unicode[STIX]{x1D719}(x,y,t)=|t^{\prime }|g_{2}(\unicode[STIX]{x1D702})+|t^{\prime }|^{3/2}g_{1}(\unicode[STIX]{x1D702})+|t^{\prime }|^{2}\unicode[STIX]{x1D6F7}(\unicode[STIX]{x1D709},\unicode[STIX]{x1D702})+|t^{\prime }|^{5/2}\unicode[STIX]{x1D6F7}_{1}(\unicode[STIX]{x1D709},\unicode[STIX]{x1D702})+\cdots \\ \displaystyle \unicode[STIX]{x1D709}=\frac{x^{\prime }+c_{0}t^{\prime }-c_{1}y^{\prime }-By^{\prime 2}}{|t^{\prime }|^{3/2}},\quad \unicode[STIX]{x1D702}=\frac{y^{\prime }}{|t^{\prime }|^{1/2}}\end{array}\right\}\quad & & \displaystyle\end{eqnarray}$$
for the potential, where
 $c_{1}$
and
 $B$
are constants. The similarity variables
 $\unicode[STIX]{x1D709}$
and
 $\unicode[STIX]{x1D702}$
have the same structure as in the one-dimensional case (1.6), the functions
 $g_{1}$
and
 $g_{2}$
represent transverse modulations with respect to the
 $x$
direction, while the functions
 $\unicode[STIX]{x1D6F7}$
,
 $\unicode[STIX]{x1D6F7}_{1},\ldots$
describe the similarity expansion near the singularity. The term
 $c_{0}t^{\prime }$
comes from the fact that a disturbance moves with the speed of sound, relative to the gas.
Observe that
 $$\begin{eqnarray}\displaystyle \left.\begin{array}{@{}c@{}}\displaystyle u(x,y,t)=\unicode[STIX]{x1D719}_{x}(x,y,t)=|t^{\prime }|^{1/2}\unicode[STIX]{x1D6F7}_{\unicode[STIX]{x1D709}}(\unicode[STIX]{x1D709},\unicode[STIX]{x1D702})+O(|t^{\prime }|):=|t^{\prime }|^{1/2}U(\unicode[STIX]{x1D709},\unicode[STIX]{x1D702})+O(|t^{\prime }|)\\ \displaystyle v=\unicode[STIX]{x1D719}_{y}=|t^{\prime }|^{1/2}(g_{2\unicode[STIX]{x1D702}}-c_{1}\unicode[STIX]{x1D6F7}_{\unicode[STIX]{x1D709}})+|t^{\prime }|(g_{1\unicode[STIX]{x1D702}}-2B\unicode[STIX]{x1D702}\unicode[STIX]{x1D6F7}_{\unicode[STIX]{x1D709}})+O(|t^{\prime }|^{3/2}),\end{array}\right\} & & \displaystyle\end{eqnarray}$$
so
 $u$
is indeed analogous to (1.2). As in Eggers et al. (Reference Eggers, Hoppe, Hynek and Suramlishvili2014),
 $-c_{1}y^{\prime }-By^{\prime 2}$
in
 $\unicode[STIX]{x1D709}$
is a lower-order term, which describes a modulation in the transversal direction. A third-order term in
 $y$
would be proportional to
 $\unicode[STIX]{x1D702}^{3}$
, which is already accounted for in the
 $\unicode[STIX]{x1D702}$
dependence of
 $\unicode[STIX]{x1D6F7}$
. The absolute sign guarantees that (3.4) works both before and after the singularity. For the density we make the ansatz
 $$\begin{eqnarray}\displaystyle \unicode[STIX]{x1D70C}(x,y,t)=\unicode[STIX]{x1D70C}_{0}[1+|t^{\prime }|^{1/2}R(\unicode[STIX]{x1D709},\unicode[STIX]{x1D702})+|t^{\prime }|Q(\unicode[STIX]{x1D709},\unicode[STIX]{x1D702})]+O(t^{\prime 3/2}), & & \displaystyle\end{eqnarray}$$
where
 $R(\unicode[STIX]{x1D709},\unicode[STIX]{x1D702})$
and
 $Q(\unicode[STIX]{x1D709},\unicode[STIX]{x1D702})$
are unknown functions to be determined by requiring that (3.6) solves (2.2) and (2.4), as we will see now. The higher-order contributions
 $\unicode[STIX]{x1D6F7}_{1}$
and
 $Q$
are needed for consistency, but we will not calculate them here.
Inserting (3.4), (3.6) into (2.4), we obtain
 $$\begin{eqnarray}\displaystyle & & \displaystyle \pm \left({\displaystyle \frac{1}{2}}g_{2\unicode[STIX]{x1D702}}\unicode[STIX]{x1D702}-g_{2}\right)+|t^{\prime }|^{1/2}\left(\pm {\displaystyle \frac{1}{2}}(g_{1\unicode[STIX]{x1D702}}\unicode[STIX]{x1D702}-3g_{1})-c_{0}\unicode[STIX]{x1D6F7}_{\unicode[STIX]{x1D709}}\right)\nonumber\\ \displaystyle & & \displaystyle \qquad \quad +\,|t^{\prime }|\left[\mp 2\unicode[STIX]{x1D6F7}\pm \frac{3\unicode[STIX]{x1D709}}{2}\unicode[STIX]{x1D6F7}_{\unicode[STIX]{x1D709}}\pm \frac{\unicode[STIX]{x1D702}}{2}\unicode[STIX]{x1D6F7}_{\unicode[STIX]{x1D702}}+\frac{1}{2}\unicode[STIX]{x1D6F7}_{\unicode[STIX]{x1D709}}^{2}+{\displaystyle \frac{1}{2}}(g_{2\unicode[STIX]{x1D702}}-c_{1}\unicode[STIX]{x1D6F7}_{\unicode[STIX]{x1D709}})^{2}-c_{0}\unicode[STIX]{x1D6F7}_{1\unicode[STIX]{x1D709}}\right]\nonumber\\ \displaystyle & & \displaystyle \qquad =-c_{0}^{2}\left\{|t^{\prime }|^{1/2}R+|t^{\prime }|[Q+\frac{1}{2}(\unicode[STIX]{x1D6FE}-2)R^{2}]\right\}+O(t^{\prime 3/2}).\end{eqnarray}$$
Thus at order
 $|t^{\prime }|^{0}$
and
 $|t^{\prime }|^{1/2}$
we have
 $$\begin{eqnarray}\displaystyle & \displaystyle {\displaystyle \frac{\unicode[STIX]{x1D702}}{2}}g_{2\unicode[STIX]{x1D702}}=g_{2}, & \displaystyle\end{eqnarray}$$
 $$\begin{eqnarray}\displaystyle & \displaystyle c_{0}R=\unicode[STIX]{x1D6F7}_{\unicode[STIX]{x1D709}}\mp {\displaystyle \frac{1}{2c_{0}}}(g_{1\unicode[STIX]{x1D702}}\unicode[STIX]{x1D702}-3g_{1})=U(\unicode[STIX]{x1D709},\unicode[STIX]{x1D702})\mp {\displaystyle \frac{1}{2c_{0}}}(g_{1\unicode[STIX]{x1D702}}\unicode[STIX]{x1D702}-3g_{1}), & \displaystyle\end{eqnarray}$$
respectively. Equation (3.8) gives
 $$\begin{eqnarray}\displaystyle g_{2}(\unicode[STIX]{x1D702})=a_{0}\unicode[STIX]{x1D702}^{2}, & & \displaystyle\end{eqnarray}$$
for some constant
 $a_{0}$
. Since we expect the leading-order term,
 $R(\unicode[STIX]{x1D709},\unicode[STIX]{x1D702})$
, of
 $\unicode[STIX]{x1D70C}$
to be continuous in the transversal direction
 $y$
near the singularity point, we infer from (3.9) that
 $$\begin{eqnarray}\displaystyle g_{1\unicode[STIX]{x1D702}}\unicode[STIX]{x1D702}-3g_{1}=0, & & \displaystyle\end{eqnarray}$$
so that one has
 $$\begin{eqnarray}\displaystyle c_{0}R=\unicode[STIX]{x1D6F7}_{\unicode[STIX]{x1D709}}=U(\unicode[STIX]{x1D709},\unicode[STIX]{x1D702}),\quad g_{1}(\unicode[STIX]{x1D702})=a_{1}\unicode[STIX]{x1D702}^{3} & & \displaystyle\end{eqnarray}$$
for some constant
 $a_{1}$
. Finally grouping together terms of order
 $|t|^{\prime }$
in (3.7) and using (3.12), we obtain
 $$\begin{eqnarray}\displaystyle c_{0}^{2}Q=\pm 2\unicode[STIX]{x1D6F7}\mp \frac{3\unicode[STIX]{x1D709}}{2}\unicode[STIX]{x1D6F7}_{\unicode[STIX]{x1D709}}\mp \frac{\unicode[STIX]{x1D702}}{2}\unicode[STIX]{x1D6F7}_{\unicode[STIX]{x1D702}}+\frac{1}{2}(1-\unicode[STIX]{x1D6FE})\unicode[STIX]{x1D6F7}_{\unicode[STIX]{x1D709}}^{2}-{\displaystyle \frac{1}{2}}(g_{2\unicode[STIX]{x1D702}}-c_{1}\unicode[STIX]{x1D6F7}_{\unicode[STIX]{x1D709}})^{2}+c_{0}\unicode[STIX]{x1D6F7}_{1\unicode[STIX]{x1D709}}. & & \displaystyle\end{eqnarray}$$
Next, inserting (3.4), (3.6) into (2.2), we have
 $$\begin{eqnarray}\displaystyle & & \displaystyle -c_{0}R_{\unicode[STIX]{x1D709}}|t^{\prime }|^{-1}+|t^{\prime }|^{-1/2}\left[\mp \frac{R}{2}\pm \frac{3\unicode[STIX]{x1D709}}{2}R_{\unicode[STIX]{x1D709}}\pm \frac{\unicode[STIX]{x1D702}}{2}R_{\unicode[STIX]{x1D702}}-c_{0}Q_{\unicode[STIX]{x1D709}}\right]+|t^{\prime }|^{-1}(1+c_{1}^{2})\unicode[STIX]{x1D6F7}_{\unicode[STIX]{x1D709}\unicode[STIX]{x1D709}}\nonumber\\ \displaystyle & & \displaystyle \qquad +\,|t^{\prime }|^{-1/2}[\unicode[STIX]{x1D6F7}_{\unicode[STIX]{x1D709}}R_{\unicode[STIX]{x1D709}}+\unicode[STIX]{x1D6F7}_{\unicode[STIX]{x1D709}\unicode[STIX]{x1D709}}R+4c_{1}B\unicode[STIX]{x1D702}\unicode[STIX]{x1D6F7}_{\unicode[STIX]{x1D709}\unicode[STIX]{x1D709}}-c_{1}(g_{2\unicode[STIX]{x1D702}}-c_{1}\unicode[STIX]{x1D6F7}_{\unicode[STIX]{x1D709}})R_{\unicode[STIX]{x1D709}}+\unicode[STIX]{x1D6F7}_{1\unicode[STIX]{x1D709}\unicode[STIX]{x1D709}}]=O({t^{\prime }}^{0}),\nonumber\\ \displaystyle & & \displaystyle\end{eqnarray}$$
whose leading-order part is compatible with (3.9) if
 $$\begin{eqnarray}\displaystyle c_{1}=0. & & \displaystyle\end{eqnarray}$$
The next order, combined with (3.9), gives
 $$\begin{eqnarray}\displaystyle c_{0}^{2}Q_{\unicode[STIX]{x1D709}}=\mp \frac{\unicode[STIX]{x1D6F7}_{\unicode[STIX]{x1D709}}}{2}\pm \frac{3\unicode[STIX]{x1D709}}{2}\unicode[STIX]{x1D6F7}_{\unicode[STIX]{x1D709}\unicode[STIX]{x1D709}}\pm \frac{\unicode[STIX]{x1D702}}{2}\unicode[STIX]{x1D6F7}_{\unicode[STIX]{x1D709}\unicode[STIX]{x1D702}}+2\unicode[STIX]{x1D6F7}_{\unicode[STIX]{x1D709}}\unicode[STIX]{x1D6F7}_{\unicode[STIX]{x1D709}\unicode[STIX]{x1D709}}+c_{0}\unicode[STIX]{x1D6F7}_{1\unicode[STIX]{x1D709}\unicode[STIX]{x1D709}}. & & \displaystyle\end{eqnarray}$$
Notice that both in (2.2) and (2.4), derivatives with respect to
 $y$
are of higher order in
 $t^{\prime }$
than corresponding
 $x$
-derivatives, so they drop out of a leading-order description. This explains why the structure of the singularity turns out to be essentially the same as that of the one-dimensional equation (1.1).
Differentiating (3.13) with respect to
 $\unicode[STIX]{x1D709}$
and subtracting (3.16) one obtains
 $$\begin{eqnarray}\displaystyle \unicode[STIX]{x1D6F7}_{\unicode[STIX]{x1D709}}-3\unicode[STIX]{x1D709}\unicode[STIX]{x1D6F7}_{\unicode[STIX]{x1D709}\unicode[STIX]{x1D709}}-\unicode[STIX]{x1D702}\unicode[STIX]{x1D6F7}_{\unicode[STIX]{x1D702}\unicode[STIX]{x1D709}}=\pm (\unicode[STIX]{x1D6FE}+1)\unicode[STIX]{x1D6F7}_{\unicode[STIX]{x1D709}}\unicode[STIX]{x1D6F7}_{\unicode[STIX]{x1D709}\unicode[STIX]{x1D709}}, & & \displaystyle\end{eqnarray}$$
which is a closed equation for
 $\unicode[STIX]{x1D6F7}$
, while the term containing
 $\unicode[STIX]{x1D6F7}_{1}$
has disappeared. Summing (3.13) with the integral of (3.16) with respect to
 $\unicode[STIX]{x1D709}$
results in
 $$\begin{eqnarray}\displaystyle c_{0}^{2}Q=\frac{3-\unicode[STIX]{x1D6FE}}{4}U^{2}+c_{0}\unicode[STIX]{x1D6F7}_{1\unicode[STIX]{x1D709}}+g(\unicode[STIX]{x1D702}), & & \displaystyle\end{eqnarray}$$
where
 $g(\unicode[STIX]{x1D702})$
is a constant of integration. The scaling function
 $\unicode[STIX]{x1D6F7}_{1}$
can be determined by considering higher-order terms in powers of
 $|t^{\prime }|$
of the expansion of
 $\unicode[STIX]{x1D719}$
and
 $\unicode[STIX]{x1D70C}$
. Using (3.12) and the above relation we can express the density
 $\unicode[STIX]{x1D70C}$
in (3.6) as
 $$\begin{eqnarray}\displaystyle \unicode[STIX]{x1D70C}=\unicode[STIX]{x1D70C}_{0}\left[1+\frac{|t^{\prime }|^{1/2}}{c_{0}}U(\unicode[STIX]{x1D709},\unicode[STIX]{x1D702})+\frac{3-\unicode[STIX]{x1D6FE}}{4c_{0}^{2}}|t^{\prime }|U^{2}(\unicode[STIX]{x1D709},\unicode[STIX]{x1D702})\right]\!\!+|t^{\prime }|\unicode[STIX]{x1D70C}_{0}\left[\frac{\unicode[STIX]{x1D6F7}_{1}(\unicode[STIX]{x1D709},\unicode[STIX]{x1D702})}{c_{0}}\!\!+\frac{g(\unicode[STIX]{x1D702})}{2c_{0}^{2}}\right]\!+O(t^{\prime 3/2}). & & \displaystyle \nonumber\\ \displaystyle & & \displaystyle\end{eqnarray}$$
Note that this means that
 $$\begin{eqnarray}\displaystyle \unicode[STIX]{x1D70C}=\unicode[STIX]{x1D70C}_{0}\left[1+\frac{\unicode[STIX]{x1D6FE}-1}{2c_{0}}u\right]^{2/(\unicode[STIX]{x1D6FE}-1)}+O(|t^{\prime }|), & & \displaystyle\end{eqnarray}$$
which, up to terms of order
 $O(|t^{\prime }|)$
, is the form of a simple wave (Landau & Lifshitz Reference Landau and Lifshitz1984) for the one-dimensional Euler system. It is remarkable that such similarity structure emerges for initial data that do not have the symmetry
 $y\rightarrow -y$
. In the limit
 $\unicode[STIX]{x1D6FE}\rightarrow 1$
one obtains
 $$\begin{eqnarray}\displaystyle \unicode[STIX]{x1D70C}=\unicode[STIX]{x1D70C}_{0}e^{u/c_{0}}+O(|t|^{\prime }), & & \displaystyle\end{eqnarray}$$
which is also consistent with the form of a simple wave in the case
 $\unicode[STIX]{x1D6FE}=1$
.
The case of a Kármán–Tsien gas (Bordemann & Hoppe Reference Bordemann and Hoppe1993)
 $\unicode[STIX]{x1D6FE}=-1$
is special. This is because the structure of the similarity solution is different, and (3.4) is to be replaced by
 $\unicode[STIX]{x1D709}=(x^{\prime }-By^{\prime 2})/t^{\prime 3/2}$
. In this solution, the pressure is subdominant, so one is effectively solving the kinematic equation. To make contact with our earlier work on the eikonal equation (Eggers et al.
Reference Eggers, Hoppe, Hynek and Suramlishvili2014), we note that after setting
 $$\begin{eqnarray}\displaystyle h(\unicode[STIX]{x1D709},\unicode[STIX]{x1D702})=-\frac{\unicode[STIX]{x1D6FE}+1}{2}\unicode[STIX]{x1D6F7}(\unicode[STIX]{x1D709},\unicode[STIX]{x1D702}) & & \displaystyle\end{eqnarray}$$
in (3.17) and integrating in
 $\unicode[STIX]{x1D709}$
, one obtains
 $$\begin{eqnarray}\displaystyle 4h-3\unicode[STIX]{x1D709}h_{\unicode[STIX]{x1D709}}-\unicode[STIX]{x1D702}h_{\unicode[STIX]{x1D702}}\pm h_{\unicode[STIX]{x1D709}}^{2}=0. & & \displaystyle\end{eqnarray}$$
This is the similarity equation derived for solutions of the eikonal equation (Eggers et al. Reference Eggers, Hoppe, Hynek and Suramlishvili2014).
Finally to solve (3.17), we put
 $U=\unicode[STIX]{x1D6F7}_{\unicode[STIX]{x1D709}}$
to obtain
 $$\begin{eqnarray}\displaystyle U-3\unicode[STIX]{x1D709}U_{\unicode[STIX]{x1D709}}-\unicode[STIX]{x1D702}U_{\unicode[STIX]{x1D702}}=\pm (\unicode[STIX]{x1D6FE}+1)UU_{\unicode[STIX]{x1D709}}, & & \displaystyle\end{eqnarray}$$
which is indeed identical to (1.3) obtained earlier, apart from the form of the prefactor on the right-hand side. We will see below that this can be understood from the speed of propagation of the upstream Riemann invariant. The fact that only
 $U$
appears also shows that the transversal velocity
 $v$
does not play a role in the leading-order description of the shock. The similarity equation can be linearized by transforming to
 $\unicode[STIX]{x1D709}(U,\unicode[STIX]{x1D702})$
:
 $$\begin{eqnarray}\displaystyle \unicode[STIX]{x1D709}_{U}U-3\unicode[STIX]{x1D709}+\unicode[STIX]{x1D702}\unicode[STIX]{x1D709}_{\unicode[STIX]{x1D702}}=\pm (\unicode[STIX]{x1D6FE}+1)U, & & \displaystyle\end{eqnarray}$$
with general solution
 $$\begin{eqnarray}\displaystyle \unicode[STIX]{x1D709}=\mp \frac{\unicode[STIX]{x1D6FE}+1}{2}U-U^{3}F\left(\frac{\unicode[STIX]{x1D702}}{U}\right). & & \displaystyle\end{eqnarray}$$
The form of the function
 $F=F(z)$
is set by the requirement that the similarity profile must be regular. From (3.26) we find that
 $$\begin{eqnarray}\displaystyle \frac{\unicode[STIX]{x2202}^{4}\unicode[STIX]{x1D709}}{\unicode[STIX]{x2202}\unicode[STIX]{x1D702}^{4}}=-{\displaystyle \frac{1}{U}}F^{(iv)}\left(\frac{\unicode[STIX]{x1D702}}{U}\right), & & \displaystyle\end{eqnarray}$$
where
 $F^{(iv)}(z)$
means the fourth derivative with respect to
 $z$
. So by putting
 $\unicode[STIX]{x1D702}=aU$
for
 $a\neq 0$
, and letting
 $U\rightarrow 0$
, one needs to impose
 $F^{(iv)}(a)=0$
for any non-zero constant
 $a$
. Hence
 $F$
is a cubic polynomial, namely
 $$\begin{eqnarray}\displaystyle F(z)=A_{0}+A_{1}z+A_{2}z^{2}+A_{3}z^{3}, & & \displaystyle\end{eqnarray}$$
and the similarity profile is
 $$\begin{eqnarray}\displaystyle \unicode[STIX]{x1D709}=\mp \frac{\unicode[STIX]{x1D6FE}+1}{2}U-A_{0}U^{3}-A_{1}U^{2}\unicode[STIX]{x1D702}-A_{2}U\unicode[STIX]{x1D702}^{2}-A_{3}\unicode[STIX]{x1D702}^{3}, & & \displaystyle\end{eqnarray}$$
for some constants
 $A_{0},A_{1},A_{2}$
and
 $A_{3}$
.
In principle one could use different values of these constants for
 $t^{\prime }>0$
and
 $t^{\prime }<0$
. However, for fixed values of
 $x^{\prime }$
and
 $y^{\prime }$
away from
 $(0,0)$
the local structure of the solution has to be single valued as a function of
 $t^{\prime }$
as
 $|t|^{\prime }\rightarrow 0$
. It follows that
 $U(\unicode[STIX]{x1D709},\unicode[STIX]{x1D702})$
has to be a single-valued function of
 $\unicode[STIX]{x1D709}$
and
 $\unicode[STIX]{x1D702}$
as
 $\unicode[STIX]{x1D709}\rightarrow \infty$
and
 $\unicode[STIX]{x1D702}\rightarrow \infty$
, which is possible only if the constants
 $A_{0},A_{1},A_{2}$
and
 $A_{3}$
have the same values before and after the singularity.
This completes the solution; constraints on the coefficients
 $A_{i}$
are given in (4.8) below. It is easy to confirm that the similarity solution satisfies the conditions (3.1). Note that (3.29) corresponds exactly to the generic form of a cusp singularity (Eggers et al.
Reference Eggers, Hoppe, Hynek and Suramlishvili2014; Grava et al.
Reference Grava, Klein and Eggers2016) also found in the catastrophe theory of optical caustics (Nye Reference Nye1999). In particular, there are no quadratic terms in the expansion. From the condition that there can be no overturning of the profile before shock formation (upper sign), we also deduce the condition
 $A_{0}>0$
.
To determine the coefficients
 $A_{i}$
in (3.29) numerically, as we will do below, it is useful to take third derivatives of
 $x$
with respect to
 $u$
and
 $y$
. First, at constant
 $y$
, we have
 $$\begin{eqnarray}\displaystyle x_{u}=u_{x}^{-1}, & & \displaystyle\end{eqnarray}$$
and thus
 $$\begin{eqnarray}\displaystyle x_{uu}=-\frac{u_{xx}}{u_{x}^{3}},\quad x_{uuu}=-\frac{u_{xxx}}{u_{x}^{4}}+3\frac{u_{xx}^{2}}{u_{x}^{5}}. & & \displaystyle\end{eqnarray}$$
According to the implicit function theorem,
 $$\begin{eqnarray}\displaystyle x_{y}=-\frac{u_{y}}{u_{x}}, & & \displaystyle\end{eqnarray}$$
while
 $$\begin{eqnarray}\displaystyle \left.\frac{1}{\unicode[STIX]{x2202}y}\right|_{u}f(x,y)=\left.\frac{1}{\unicode[STIX]{x2202}y}\right|_{u}f(x(u,y),y)=-f_{x}\frac{u_{y}}{u_{x}}+f_{y}, & & \displaystyle\end{eqnarray}$$
and thus
 $$\begin{eqnarray}\displaystyle x_{yy}=\left(\frac{u_{y}}{u_{x}}\right)_{x}\frac{u_{y}}{u_{x}}-\left(\frac{u_{y}}{u_{x}}\right)_{y}=2\frac{u_{xy}u_{y}}{u_{x}^{2}}-\frac{u_{yy}}{u_{x}}-\frac{u_{xx}u_{y}^{2}}{u_{x}^{3}} & & \displaystyle\end{eqnarray}$$
and
 $$\begin{eqnarray}\displaystyle & \displaystyle x_{uyy}=\left[2\frac{u_{xy}u_{y}}{u_{x}^{2}}-\frac{u_{yy}}{u_{x}}-\frac{u_{xx}u_{y}^{2}}{u_{x}^{3}}\right]_{x}u_{x}^{-1}, & \displaystyle\end{eqnarray}$$
 $$\begin{eqnarray}\displaystyle & \displaystyle x_{uuy}=\left(\frac{u_{xx}}{u_{x}^{3}}\right)_{x}\frac{u_{y}}{u_{x}}-\left(\frac{u_{xx}}{u_{x}^{3}}\right)_{y}, & \displaystyle\end{eqnarray}$$
 $$\begin{eqnarray}\displaystyle & \displaystyle x_{yyy}=-\left[2\frac{u_{xy}u_{y}}{u_{x}^{2}}-\frac{u_{yy}}{u_{x}}-\frac{u_{xx}u_{y}^{2}}{u_{x}^{3}}\right]_{x}\frac{u_{y}}{u_{x}}+\left[2\frac{u_{xy}u_{y}}{u_{x}^{2}}-\frac{u_{yy}}{u_{x}}-\frac{u_{xx}u_{y}^{2}}{u_{x}^{3}}\right]_{y}. & \displaystyle\end{eqnarray}$$
Using the scaling (3.4), the derivatives can be converted to similarity variables, so from (3.29) one obtains
 $$\begin{eqnarray}\displaystyle A_{0}\simeq -\frac{x_{uuu}}{6},\quad A_{1}\simeq -\frac{x_{uuy}}{2},\quad A_{2}\simeq -\frac{x_{uyy}}{2},\quad A_{3}\simeq -\frac{x_{yyy}}{6}, & & \displaystyle\end{eqnarray}$$
to be evaluated at the critical point
 $t=t_{0}$
,
 $x=x_{0}$
and
 $y=y_{0}$
. Here and below, we are assuming that the higher-order scaling functions which appear in (3.4) are regular, so that the higher-order contributions to
 $u$
in (3.5) become negligible near the critical point.
Finally, the constant
 $B$
in (3.4) can be evaluated by computing the second derivative with respect to
 $y$
:
 $$\begin{eqnarray}\displaystyle u_{yy}\simeq 4B^{2}\unicode[STIX]{x1D702}^{2}|t^{\prime }|^{-3/2}U_{\unicode[STIX]{x1D709}\unicode[STIX]{x1D709}}-2B|t^{\prime }|^{-1}U_{\unicode[STIX]{x1D709}}+|t^{\prime }|^{-1/2}U_{\unicode[STIX]{x1D702}\unicode[STIX]{x1D702}}. & & \displaystyle\end{eqnarray}$$
Thus at
 $\unicode[STIX]{x1D702}=\unicode[STIX]{x1D709}=0$
, using
 $U_{\unicode[STIX]{x1D709}}=\unicode[STIX]{x1D709}_{U}^{-1}=\mp 2/(\unicode[STIX]{x1D6FE}+1)$
,
 $U_{\unicode[STIX]{x1D709}\unicode[STIX]{x1D709}}=0$
and
 $U_{\unicode[STIX]{x1D702}\unicode[STIX]{x1D702}}=0$
, one finds that
 $$\begin{eqnarray}\displaystyle B\simeq \frac{\unicode[STIX]{x1D6FE}+1}{4}u_{yy}(t_{0}-t) & & \displaystyle\end{eqnarray}$$
as
 $t^{\prime }\rightarrow 0$
. Summarizing, the solution near the singularity at the point
 $(x_{0},y_{0},t_{0})$
in the physical variables
 $x^{\prime }=x-x_{0}$
,
 $y^{\prime }=y-y_{0}$
and
 $t^{\prime }=t_{0}-t$
takes the form
 $$\begin{eqnarray}\displaystyle x^{\prime }-c_{0}t^{\prime }-By^{\prime 2}\simeq -{\displaystyle \frac{\unicode[STIX]{x1D6FE}+1}{2}}t^{\prime }u-A_{0}u^{3}-A_{1}u^{2}y^{\prime }-A_{2}uy^{\prime 2}-A_{3}y^{\prime 3}, & & \displaystyle\end{eqnarray}$$
where the constants
 $A_{0},A_{1},A_{2}$
and
 $A_{3}$
are determined from (3.38) and the constant
 $B$
is determined from (3.40). The solution (3.41) shows that the shock moves at the speed of propagation
 $c+u=c_{0}+(\unicode[STIX]{x1D6FE}+1)u/2$
of the upstream Riemann invariant, using that
 $c(u)=c_{0}+(\unicode[STIX]{x1D6FE}-1)u/2$
(Landau & Lifshitz Reference Landau and Lifshitz1984).
We claim that the local structure of the singularity for the velocity
 $u(x,y,t)$
, starting from smooth initial conditions, is captured by the self-similar profile obtained in (3.41). This represents the leading-order term in the multiple scale expansion of
 $u(x,y,t)=|t^{\prime }|^{1/2}U(\unicode[STIX]{x1D709},\unicode[STIX]{x1D702})+O(|t^{\prime }|)$
. We will support this claim by a numerical example presented in § 5.
4 After the singularity
After a shock occurs, the adiabatic law (2.1) is no longer valid, since entropy is generated inside the shock front, the entropy being given by
 $$\begin{eqnarray}\displaystyle s=c_{v}\ln \frac{p}{\unicode[STIX]{x1D70C}^{\unicode[STIX]{x1D6FE}}}, & & \displaystyle\end{eqnarray}$$
where
 $c_{v}$
is the specific heat, which for simplicity we consider constant. However, the jump in entropy across the shock is only of order
 $|t^{\prime }|^{3/2}$
, which results in a subleading contribution to (3.7). Following Landau & Lifshitz (Reference Landau and Lifshitz1984), and using
 $$\begin{eqnarray}\displaystyle w=\frac{\unicode[STIX]{x1D6FE}}{\unicode[STIX]{x1D6FE}-1}\frac{p}{\unicode[STIX]{x1D70C}} & & \displaystyle\end{eqnarray}$$
for the enthalpy of a polyatomic gas, the Rankine–Hugoniot jump condition across a shock in a frame of reference moving with the shock is
 $$\begin{eqnarray}\displaystyle \frac{\unicode[STIX]{x1D6FE}}{\unicode[STIX]{x1D6FE}+1}\left(\frac{p_{1}}{\unicode[STIX]{x1D70C}_{1}}-\frac{p_{2}}{\unicode[STIX]{x1D70C}_{2}}\right)+\frac{1}{2}\left(\frac{1}{\unicode[STIX]{x1D70C}_{1}}+\frac{1}{\unicode[STIX]{x1D70C}_{2}}\right)\left(p_{2}-p_{1}\right)=0, & & \displaystyle\end{eqnarray}$$
where the index 1 denotes the front of the shock, index 2 the back. Combining (4.1) and (4.3), and expanding in the size of the pressure jump
 $p_{2}=p_{1}+\unicode[STIX]{x0394}p$
, one finds
 $$\begin{eqnarray}\displaystyle \unicode[STIX]{x0394}s\equiv s_{2}-s_{1}=\frac{c_{v}}{12}\frac{\unicode[STIX]{x1D6FE}^{2}-1}{\unicode[STIX]{x1D6FE}^{2}}\frac{\unicode[STIX]{x0394}p^{3}}{p_{1}^{3}}. & & \displaystyle\end{eqnarray}$$
Thus the jump in entropy is only of third order, which a fact which remains true for a gas of arbitrary thermodynamic properties (Landau & Lifshitz Reference Landau and Lifshitz1984). This implies that the similarity solution is valid only for times close to
 $t_{0}$
where the shock can still be considered to be weak.
From the solution (3.6), we have that
 $\unicode[STIX]{x0394}p\propto t^{\prime 1/2}$
, and so it follows that
 $\unicode[STIX]{x0394}s\propto t^{\prime 3/2}$
, which means that
 $$\begin{eqnarray}\displaystyle p=\frac{A}{\unicode[STIX]{x1D6FE}}\unicode[STIX]{x1D70C}^{\unicode[STIX]{x1D6FE}}+O(t^{\prime 3/2}). & & \displaystyle\end{eqnarray}$$
Clearly, this makes a contribution of order
 $t^{\prime 3/2}$
to (3.7), which can be neglected. Given the leading-order solution, one can use the entropy production (4.4) to calculate the distribution of entropy near the shock, using the convection equation
 $$\begin{eqnarray}\displaystyle \left(\frac{p}{\unicode[STIX]{x1D70C}^{\unicode[STIX]{x1D6FE}}}\right)_{t}+\boldsymbol{v}\boldsymbol{\cdot }\unicode[STIX]{x1D735}\left(\frac{p}{\unicode[STIX]{x1D70C}^{\unicode[STIX]{x1D6FE}}}\right)=0, & & \displaystyle\end{eqnarray}$$
which says that entropy is transported with each fluid element, but not produced outside of the shock.
4.1 Shock condition
After the singularity, the solution given by (3.29) has a region where the profile has overturned. The line along which the profile is vertical is given by
 $\unicode[STIX]{x2202}\unicode[STIX]{x1D709}/\unicode[STIX]{x2202}U=0$
, and thus for
 $t>t_{0}$
:
 $$\begin{eqnarray}\displaystyle \frac{\unicode[STIX]{x1D6FE}+1}{2}=3A_{0}U^{2}+2A_{1}U\unicode[STIX]{x1D702}+A_{2}\unicode[STIX]{x1D702}^{2}. & & \displaystyle\end{eqnarray}$$
This can be parameterized as an ellipse in
 $(U,\unicode[STIX]{x1D702})$
-space, provided that the quadratic form on the right is positive definite; for this we need that
 $$\begin{eqnarray}\displaystyle A_{0}>0,\quad 3A_{0}A_{2}-A_{1}^{2}>0. & & \displaystyle\end{eqnarray}$$
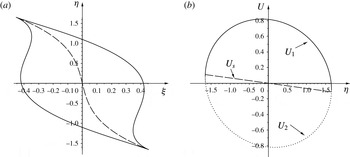
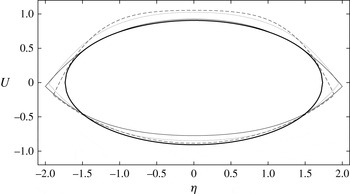
If the conditions (4.8) were not met, (4.7) would not describe a closed curve, but instead extend to infinity. This is unphysical, since it would imply that the shock has spread an infinite distance. As the ellipse (4.7) is inserted into (3.29), one obtains a closed lip-shaped region, an example of which is shown in figure 3. In the case
 $A_{1}=A_{3}=0$
, namely for initial data with symmetry with respect to reflection on the
 $y$
-axis, one has
 $$\begin{eqnarray}\displaystyle \unicode[STIX]{x1D709}=\pm {\displaystyle \frac{2}{3\sqrt{3A_{0}}}}\left({\displaystyle \frac{\unicode[STIX]{x1D6FE}+1}{2}}-A_{2}\unicode[STIX]{x1D702}^{2}\right)^{3/2}. & & \displaystyle\end{eqnarray}$$
The lip describes how the overturned region (and thus the shock) spreads in space, and corresponds to similar results found in Eggers et al. (Reference Eggers, Hoppe, Hynek and Suramlishvili2014) and Grava et al. (Reference Grava, Klein and Eggers2016).
The structure of the shock in similarity variables. On (a), the lip-shaped region inside which the velocity profile overturns; parameters are chosen arbitrarily as
 $(A_{0},A_{1},A2,A3)=(2,0.3,0.5,0.1)$
and
 $\unicode[STIX]{x1D6FE}=5/3$
. The dashed line marks the position
 $\unicode[STIX]{x1D709}_{s}$
of the shock. On (b), the velocities
 $U_{1},U_{2}$
on either side of the shock; the size of the shock goes to zero at the edge. The dashed line is the shock speed
 $U_{s}$
.

To find the position of the shock, we transform the solution (3.29) to a form equivalent to that of the one-dimensional case. Namely, we can introduce shifted variables
 $$\begin{eqnarray}\displaystyle \bar{\unicode[STIX]{x1D709}}=\unicode[STIX]{x1D709}-\unicode[STIX]{x1D709}_{s}(\unicode[STIX]{x1D702}),\quad \bar{U}=U-\hat{U} (\unicode[STIX]{x1D702}), & & \displaystyle\end{eqnarray}$$
so that (3.29) becomes
 $$\begin{eqnarray}\displaystyle \bar{\unicode[STIX]{x1D709}}=-A_{0}\bar{U}\left(\bar{U}^{2}-\unicode[STIX]{x1D6E5}^{2}(\unicode[STIX]{x1D702})\right). & & \displaystyle\end{eqnarray}$$
Comparing coefficients, we obtain
 $$\begin{eqnarray}\displaystyle & & \displaystyle \hat{U} =-\frac{A_{1}}{3A_{0}}\unicode[STIX]{x1D702},\quad \unicode[STIX]{x1D709}_{s}=-\frac{A_{1}(\unicode[STIX]{x1D6FE}+1)}{6A_{0}}\unicode[STIX]{x1D702}+\frac{9A_{0}A_{1}A_{2}-2A_{1}^{3}-27A_{0}^{2}A_{3}}{27A_{0}^{2}}\unicode[STIX]{x1D702}^{3},\quad\end{eqnarray}$$
 $$\begin{eqnarray}\displaystyle & & \displaystyle \unicode[STIX]{x1D6E5}=\sqrt{\frac{\unicode[STIX]{x1D6FE}+1}{2A_{0}}+\frac{A_{1}^{2}-3A_{0}A_{2}}{3A_{0}^{2}}\unicode[STIX]{x1D702}^{2}}.\end{eqnarray}$$
The lateral width of the shock is determined from the condition that
 $\unicode[STIX]{x1D6E5}=0$
, and thus
 $$\begin{eqnarray}\displaystyle \unicode[STIX]{x1D702}_{\pm }=\pm \sqrt{\frac{3A_{0}(\unicode[STIX]{x1D6FE}+1)}{6A_{0}A_{2}-2A_{1}^{2}}}, & & \displaystyle\end{eqnarray}$$
where (4.8) guarantees that this is well defined. Clearly, in real space the width of the shock increases like
 $|t^{\prime }|^{1/2}$
.
Having written the profile in the form of a simple s-curve (4.11), if follows from symmetry that the shock must be at
 $\bar{\unicode[STIX]{x1D709}}=0$
, so that the shock position is at
 $\unicode[STIX]{x1D709}_{s}(\unicode[STIX]{x1D702})$
. This is the dashed line plotted in figure 3. The line
 $\bar{\unicode[STIX]{x1D709}}=0$
intersects (4.11) at
 $\bar{U}=\pm \unicode[STIX]{x1D6E5}$
, and so the velocities at the front and back of the shock are
 $U_{1}=\hat{U} -\unicode[STIX]{x1D6E5}$
and
 $U_{2}=\hat{U} +\unicode[STIX]{x1D6E5}$
, respectively, so that the size of the jump is
 $2\unicode[STIX]{x1D6E5}$
.
In real space the shock position is at
 $$\begin{eqnarray}\displaystyle x_{s}^{\prime } & = & \displaystyle -c_{0}t^{\prime }+By^{\prime 2}+|t^{\prime }|^{3/2}\unicode[STIX]{x1D709}_{s}(\unicode[STIX]{x1D702})\nonumber\\ \displaystyle & = & \displaystyle By^{\prime 2}-\left(c_{0}-\frac{A_{1}(\unicode[STIX]{x1D6FE}+1)}{6A_{0}}y^{\prime }\right)t^{\prime }+\frac{9A_{0}A_{1}A_{2}-2A_{1}^{3}-27A_{0}^{2}A_{3}}{27A_{0}^{2}}y^{\prime 3},\end{eqnarray}$$
so that the shock speed in the
 $x$
-direction is
 $$\begin{eqnarray}\displaystyle u_{s}=c_{0}-\frac{A_{1}(\unicode[STIX]{x1D6FE}+1)}{6A_{0}}y^{\prime }=c_{0}+|t^{\prime }|^{1/2}U_{s}(\unicode[STIX]{x1D702}),\quad U_{s}=-\frac{A_{1}(\unicode[STIX]{x1D6FE}+1)}{6A_{0}}\unicode[STIX]{x1D702}; & & \displaystyle\end{eqnarray}$$
the speed in the
 $y$
-direction is of lower order.
To confirm that (4.16) is in agreement with the Rankine–Hugoniot conditions at the shock, note that according to (4.11), the gas velocities at the back and the front of the shock are
 $$\begin{eqnarray}\displaystyle u_{1/2}=|t^{\prime }|^{1/2}(\hat{U} \pm \unicode[STIX]{x1D6E5})\equiv |t^{\prime }|^{1/2}U_{1/2}. & & \displaystyle\end{eqnarray}$$
Using mass conservation, the shock velocity is (Landau & Lifshitz Reference Landau and Lifshitz1984)
 $$\begin{eqnarray}\displaystyle u_{s}=\frac{\unicode[STIX]{x1D70C}_{1}u_{1}-\unicode[STIX]{x1D70C}_{2}u_{2}}{\unicode[STIX]{x1D70C}_{1}-\unicode[STIX]{x1D70C}_{2}}, & & \displaystyle\end{eqnarray}$$
which to leading order can be written as
 $$\begin{eqnarray}\displaystyle u_{s}=\left.\frac{\unicode[STIX]{x2202}\unicode[STIX]{x1D70C}u}{\unicode[STIX]{x2202}\unicode[STIX]{x1D70C}}\right|_{u=(u_{1}+u_{2})/2}=\frac{u_{1}+u_{2}}{2}+\unicode[STIX]{x1D70C}\left.\frac{\unicode[STIX]{x2202}u}{\unicode[STIX]{x2202}\unicode[STIX]{x1D70C}}\right|_{u=(u_{1}+u_{2})/2}=c_{0}+\frac{\unicode[STIX]{x1D6FE}+1}{4}(u_{1}+u_{2}), & & \displaystyle\end{eqnarray}$$
where in the last step we used (3.20). Combining this with (4.17) and the expression for
 $\hat{U}$
, one indeed recovers (4.16). It is straightforward to check that the other Rankine–Hugoniot conditions are satisfied identically to leading order. In figure 3 we show the velocities
 $U_{1/2}$
in the back and front of the shock, as well as the shock speed
 $U_{s}$
itself. Note that the speed of the shock front would be different if it propagated into a region of stagnant gas (Landau & Lifshitz Reference Landau and Lifshitz1984). However, this situation corresponds to an initial condition which is non-smooth before the formation of the shock, and is therefore not captured by our analysis.
5 Numerical simulation
We test the results of the preceding sections by direct numerical simulation of the Euler equation. Starting from a smooth initial condition for the density and the velocity, a shock develops. Our aim is to compare to the similarity profile (3.29), both before and after shock formation, and to confirm the self-similar properties of the solution, as described by (3.4), (3.6). We have seen in earlier work (Grava et al.
Reference Grava, Klein and Eggers2016) that it is much easier to test self-similar properties of profiles after the singularity, where they have more structure. We will pursue this idea but with the additional twist that we use (3.38) before the singularity to calculate the coefficients
 $A_{0}$
to
 $A_{3}$
, which determines the self-similar solution completely. We are then able to predict profiles after the singularity without any adjustable parameters.
We begin with the initial condition
 $$\begin{eqnarray}\displaystyle \unicode[STIX]{x1D70C}(x,y,0)=0.2+\text{e}^{-4x^{4}-4y^{2}},\quad \boldsymbol{v}(x,y,0)=0, & & \displaystyle\end{eqnarray}$$
which corresponds to a localized high-density, high-pressure region (as if generated by an explosion), starting from rest. We choose the adiabatic exponent of air
 $\unicode[STIX]{x1D6FE}=7/5$
, and
 $A=\unicode[STIX]{x1D6FE}$
in the ideal gas law (2.1). The initial condition was chosen such that gradients are steeper in the
 $x$
-direction, so that a shock first occurs on the
 $x$
-axis. Further, the solution is symmetric about the
 $x$
-axis, so that the coefficients
 $A_{1}$
and
 $A_{3}$
in the self-similar solution (3.29) vanish. This makes it much easier to spot the singularity; in particular, the
 $x$
and
 $y$
axes of the simulation are the same as those defined by the gradients of the density, in that
 $\unicode[STIX]{x2202}\unicode[STIX]{x1D70C}/\unicode[STIX]{x2202}y=0$
is satisfied identically.
For times
 $t<t_{0}$
we use both a finite-difference scheme and a Fourier pseudo-spectral method to solve the equations.
5.1 Finite-difference scheme
In the finite-difference scheme, the equations are written as in (2.1)–(2.3), and are discretized in space using fourth-order finite differences on a uniform mesh in the numerical domain
 $[0,2]\times [0,2]$
. Mirror symmetry is applied at
 $x=0$
and at
 $y=0$
, while outflow conditions (vanishing derivatives of all variables) are applied at
 $x=2$
and at
 $y=2$
. An explicit second-order Runge–Kutta scheme is used to advance the solution in time. We used
 $2000\times 2000$
points in space and a fixed time step of
 $\unicode[STIX]{x0394}t=1.25\times 10^{-4}$
.
When a shock appears, we need to use a finite-difference method that remains stable even in the presence of jumps of the hydrodynamic fields. The finite-difference scheme is shock capturing and not shock fitted. The equations are written in conservative form, where the fluxes are computed using the second-order-in-space central-upwind scheme (see e.g. §3.1 of Kurganov & Levy (Reference Kurganov and Levy2002) with slope limiting (van Leer Reference van Leer1979)). In addition to
 $\unicode[STIX]{x1D70C}$
and the mass flux
 $\boldsymbol{j}=\unicode[STIX]{x1D70C}\boldsymbol{v}$
, the method uses the internal energy
 $e=\unicode[STIX]{x1D70C}\boldsymbol{v}^{2}/2+p/(\unicode[STIX]{x1D6FE}-1)$
as an additional variable. The energy follows the conservation equation
 $$\begin{eqnarray}\displaystyle \frac{\unicode[STIX]{x2202}e}{\unicode[STIX]{x2202}t}+\unicode[STIX]{x1D735}\boldsymbol{\cdot }(\boldsymbol{v}(e+p))=0, & & \displaystyle\end{eqnarray}$$
while (2.2) and (2.3) are solved as before, but in conservative form. The numerical scheme satisfies the so-called entropy condition (Lax Reference Lax1973), which excludes non-physical solutions (those with negative entropy variation through the discontinuity), by adding numerical diffusion in the shock region. The artificial dissipation terms introduced are proportional to the mesh size. This method remains stable even if the shock is not resolved, effectively modelling non-classical solutions to the Euler equation, which satisfy the Rankine–Hugoniot conditions. Time integration is performed with a generic variable time step predictor–corrector scheme.
This numerical scheme is implemented using the ‘Basilisk’ software (http://basilisk.fr/), developed by Popinet. It uses Quadtrees (Popinet Reference Popinet2011) to allow efficient adaptive grid refinement in the region where the gradient of the density or of the velocity becomes large. Linear refinement is used on the trees, so that reconstructed values also use slope limiting. The numerical domain is
 $[-2,2]\times [-2,2]$
, i.e. symmetry conditions are not applied in this case, and it is discretized using
 $2^{10}\times 2^{10}$
points initially. The resolution is adapted at each time step according to the (wavelet-estimated) discretization error of the density field. Whenever the discretization error is larger than
 $5\times 10^{-3}$
, the mesh is refined, down to a prescribed maximum quadtree level. Several simulations have been carried out by varying the maximum level of refinement from 10 to 18.
5.2 Pseudo-spectral method
For the pseudo-spectral method (Canuto et al.
Reference Canuto, Hussaini, Quarteroni and Zhang2006), equations (2.2) and (2.4) are set in a
 $[-2\unicode[STIX]{x03C0},2\unicode[STIX]{x03C0}]\times [-2\unicode[STIX]{x03C0},2\unicode[STIX]{x03C0}]$
box with periodic boundary conditions, with an equispaced collocation grid of resolution
 $2^{14}\times 2^{14}$
. The time discretization is obtained by means of a standard fourth-order explicit Runge–Kutta scheme with
 $\unicode[STIX]{x1D6FF}t=5\times 10^{-5}$
. To remove aliasing errors, we adopt a filtering as described in Hou (Reference Hou2009), whereby Fourier coefficients are multiplied by the exponential function
 $$\begin{eqnarray}\unicode[STIX]{x1D70E}(k)=\exp (-36(|k|/N)^{36}),\end{eqnarray}$$
where
 $N=2^{14}$
is the number of Fourier modes in each direction.
As the singularity is approached, steepening gradients require higher and higher Fourier modes to represent profiles accurately. To guarantee sufficient resolution as the profiles steepen, we inspect the magnitude of the Fourier coefficients at each time step. As long as all Fourier modes with magnitude higher than the machine epsilon (
 $10^{-12}$
) are represented, the approximation is deemed acceptable; if this is no longer the case for a given resolution, we stop the simulation.
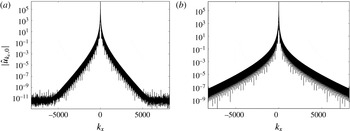
As an example, in figure 4 we report the spectrum for an acceptable solution (at time
 $t=0.45$
) on the left, and for a rejected solution (at time
 $t=0.48$
) on the right. On the left, Fourier amplitudes plateau to the smallest representable number
 $10^{-12}$
, and thus the simulation can be trusted to within the arithmetic precision of the calculation, while on the right this is no longer the case. On the basis of this, we continue the pseudo-spectral calculation up to
 $t=0.46$
, and perform a least squares interpolation of this part of the solution to extrapolate to the critical time.
Magnitude of Fourier coefficients of the numerical solution as function of the
 $x$
-wavenumber at the origin of the
 $y$
-wavenumber axis. At
 $t=0.45$
(a) there is sufficient resolution, while at
 $t=0.48$
(b) the tails of the spectrum have not dropped to
 $10^{-12}$
.

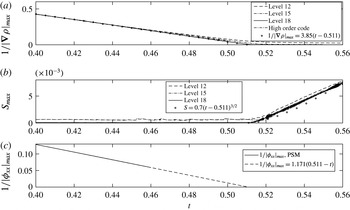
The inverse of the maximum of the density gradient (a), and the maximum of the entropy (b) over the whole domain as function of time, for three different levels of resolution, using the Basilisk code for the compressible Euler equation. The dot-dashed line is the result of the fourth-order code, up to
 $t=0.5$
. By fitting to the predicted linear law (5.5), we get an accurate prediction for the singularity time
 $t_{0}=0.511$
. In (c), the inverse of the maximum of
 $\unicode[STIX]{x1D719}_{xx}$
, obtained using the pseudo-spectral method, is plotted as a function of time. A linear fit leads
 $t_{0}=0.512$
.

5.3 Fitting
To locate the singularity, we look at the maximum gradient of the density
 $\unicode[STIX]{x1D70C}$
and the velocity field
 $u$
, which is in the
 $x$
-direction:
 $$\begin{eqnarray}\displaystyle \frac{\unicode[STIX]{x2202}\unicode[STIX]{x1D70C}}{\unicode[STIX]{x2202}x}=\frac{\unicode[STIX]{x1D70C}_{0}}{c_{0}}|t^{\prime }|^{-1}U_{\unicode[STIX]{x1D709}},\quad u_{x}=|t^{\prime }|^{-1}U_{\unicode[STIX]{x1D709}}. & & \displaystyle\end{eqnarray}$$
According to the similarity solution (3.29), the minimum
 $\unicode[STIX]{x1D709}_{U}=-(\unicode[STIX]{x1D6FE}+1)/2$
is at
 $U=\unicode[STIX]{x1D702}=0$
, and hence
 $$\begin{eqnarray}\displaystyle |\unicode[STIX]{x1D735}\unicode[STIX]{x1D70C}|_{max}^{-1}=\frac{c_{0}}{\unicode[STIX]{x1D70C}_{0}}\frac{1+\unicode[STIX]{x1D6FE}}{2}|t^{\prime }|,\quad |u_{x}|_{max}^{-1}=\frac{1+\unicode[STIX]{x1D6FE}}{2}|t^{\prime }|. & & \displaystyle\end{eqnarray}$$
The predicted linear dependence for
 $t<t_{0}$
is confirmed in figure 5(a,c). The quantity
 $|\unicode[STIX]{x1D735}\unicode[STIX]{x1D70C}|_{max}^{-1}$
is computed using the conservative scheme, since it allows us to go up to the singularity and beyond. Close to the singularity, the maximum gradient of the density crosses over to a finite value, as the scheme can no longer resolve the steepest gradient. As the resolution is increased, the linear behaviour continues to smaller values. From a linear fit of the inverse of
 $\unicode[STIX]{x1D70C}_{x}$
to the highest resolution data (circles), we find
 $t_{0}=0.511$
, which is our most accurate estimate of the singularity time, since it is based on a simulation which continues up to shock formation and beyond. Using (5.5), the theoretical prefactor of the linear fit is
 $(c_{0}/\unicode[STIX]{x1D70C}_{0})(1+\unicode[STIX]{x1D6FE}/2)\simeq 4.01$
, in reasonable agreement with the fitted value of
 $3.85$
. The linear fit also agrees very well with the result of the fourth order finite-difference code before the singularity.
To confirm that the velocity component
 $u$
blows up in the same way as
 $\unicode[STIX]{x1D70C}$
, we use the pseudo-spectral method to also calculate
 $|u_{x}|_{max}^{-1}$
. A linear fit to
 $|u_{x}|_{max}^{-1}=|\unicode[STIX]{x1D719}_{xx}|_{max}^{-1}$
gives a singularity time of
 $0.512$
, in good agreement with the result of the finite-difference scheme. The prefactor of the linear fit is
 $1.171$
, again in good agreement with the theoretical value
 $(\unicode[STIX]{x1D6FE}+1)/2=1.20$
(see figure 5
c).
Using the location of the maximum gradient of
 $\unicode[STIX]{x1D70C}$
at
 $t_{0}$
, we obtain
 $\boldsymbol{x}_{0}=(1.4052,0)$
as the position of the singularity. At this point, the velocity
 $\boldsymbol{v}_{0}=(0.2769,0)$
, the density
 $\unicode[STIX]{x1D70C}_{0}=0.2731$
and
 $c_{0}=0.9127$
. From now on, we will report all results in a frame of reference which moves with
 $\boldsymbol{v}_{0}$
, and relative to
 $\boldsymbol{x}_{0}$
. The middle graph of figure 5 shows the maximum entropy, which starts to grow exactly at the time of shock formation
 $t_{0}$
. The growth is consistent with a fit based on (4.4), which would predict the maximum entropy to grow like
 $t^{\prime 3/2}$
. However, our results are not sufficiently accurate to distinguish this from a linear behaviour.
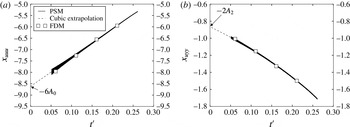
The derivatives
 $x_{uuu}$
(a) and
 $x_{uyy}$
(b) as function of
 $t^{\prime }$
for the initial conditions (5.1), evaluated at the maximum of the pressure, using the pseudo-spectral method (PSM) and the finite-difference method (FDM). The values of
 $x_{uuu}$
and
 $x_{uyy}$
are plotted before they start to oscillate strongly for
 $t^{\prime }<0.05$
. The coefficients
 $A_{0}$
and
 $A_{2}$
are found by extrapolating to
 $t^{\prime }=0$
.

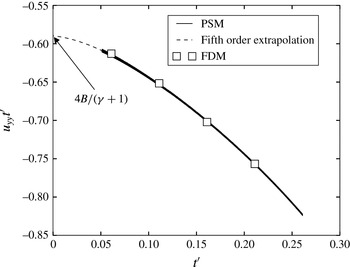
Plot of the values of
 $u_{yy}t^{\prime }$
for several values of
 $t^{\prime }$
using PSM and FDM. The coefficient
 $B$
is found from (3.40) by extrapolating to
 $t^{\prime }=0$
.

We are now in a position to calculate the constant
 $B$
(cf. (3.4)) as well as the coefficients
 $A_{i}$
which appear in the similarity solution (3.29); by symmetry,
 $A_{1}=A_{3}=0$
. For the latter, we use (3.38), aiming to evaluate the right-hand sides as close to the singularity as possible. As illustrated in figures 6 and 7, and recorded in table 1, we use the results of both the finite-difference method (FDM) and our pseudo-spectral method (PSM) to extrapolate to
 $t_{0}$
. As seen from (3.31)–(3.37), the numerical approximation for the third derivatives will loose resolution eventually, since for example
 $u_{x}$
blows up at the singularity, and cancellation errors become large. In calculating
 $x_{uuu}$
and
 $x_{uyy}$
, we use that odd derivatives with respect to
 $y$
vanish on account of symmetry. We then evaluate
 $x_{uuu}$
and
 $x_{uyy}$
at the maximum of the pressure, and plot the result as a function of time see, figure 6. We use linear and cubic approximations to extrapolate
 $x_{uuu}$
and
 $x_{uyy}$
to
 $t^{\prime }=0$
, from which
 $A_{0}$
and
 $A_{2}$
are calculated using (3.38) (see table 1). The coefficient
 $B$
(cf. (3.4)), is found from (3.40) by extrapolating to
 $t=t_{0}$
, using both linear and quintic approximations (see figure 7 and table 1). As seen in table 1, the numerical values for the coefficients, obtained by different methods, are in good agreement.
The parameters of the similarity solution as determined numerically from
 $t<t_{0}$
, extrapolating to
 $t_{0}=0.511$
, using the finite-difference and pseudo-spectral methods.

5.4 Results after the singularity
We are now in a position to make predictions for
 $t^{\prime }>0$
. From (3.4), the velocity field
 $u$
in the direction of propagation is
 $$\begin{eqnarray}\displaystyle u-u_{0}=|t^{\prime }|^{1/2}U\left(\frac{x^{\prime }+c_{0}t^{\prime }}{|t^{\prime }|^{3/2}},\unicode[STIX]{x1D702}\right). & & \displaystyle\end{eqnarray}$$
In figure 8, velocity profiles have been rescaled according to (5.6), and cuts at constant values of
 $\unicode[STIX]{x1D702}$
are being considered. The numerical data are superimposed for the times shown, and compared to the theoretical prediction. Note that no adjustable parameter was used to achieve the collapse, which requires accurate estimates for
 $x_{0}$
and
 $u_{0}$
, as well as the speed of sound
 $c_{0}$
. Theoretical predictions for the profile (3.29), based on the coefficients from table 1, are shown as the heavy black line.
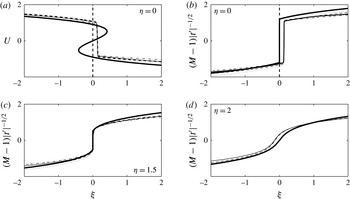
Velocity and Mach number profiles, rescaled according to (5.6), for some values of
 $t^{\prime }$
and
 $\unicode[STIX]{x1D702}$
. The heavy line is the theoretical prediction with parameters as given by table 1; curves using parameters as determined from the FDM and from the PSM are virtually indistinguishable. The dotted, dashed, solid, and dot-dashed lines are rescaled numerical profiles for
 $t^{\prime }=-0.009$
,
 $-0.014$
,
 $-0.019$
and
 $-0.039$
, respectively. In (a), we show the s-curve as described by (3.29), for which a jump from the top to the lowermost branch is predicted to occur at
 $\unicode[STIX]{x1D709}=0$
(heavy dashed line). In (b)–(d) we show the Mach number in its similarity form (5.7), with the jump corresponding to the shock inserted. At
 $\unicode[STIX]{x1D702}=2$
the shock has disappeared, and the profile is smooth.

In (a) we show the velocity profile along the centreline
 $\unicode[STIX]{x1D702}=0$
. The numerical data show a sudden change of velocity over a few grid points, marking the position of the shock. The theoretical profile (3.29) has the form of an s-curve, into which a shock must be inserted. According to (4.12), the shock position
 $\unicode[STIX]{x1D709}_{s}$
is zero (dashed line), independent of
 $\unicode[STIX]{x1D702}$
for the present symmetric shock. Apart from a slight shift in the
 $x$
-direction, theory well describes the position and size of the jump.
In the remaining (b)–(d), we plot the Mach number
 $$\begin{eqnarray}\displaystyle M=\frac{c_{0}+u_{0}-u}{c}=1-|t^{\prime }|^{1/2}\frac{\unicode[STIX]{x1D6FE}+1}{2c_{0}}U & & \displaystyle\end{eqnarray}$$
for three different values of
 $\unicode[STIX]{x1D702}$
. We now insert the jump directly, without showing its construction using the s-curve. As
 $\unicode[STIX]{x1D702}$
increases, one effectively detunes from the centre of the shock, and its strength (the size of the jump) decreases. At the edges of the shock, which according to (4.14) are at
 $\unicode[STIX]{x1D702}_{\pm }=\pm \sqrt{(\unicode[STIX]{x1D6FE}+1)/(2A_{2})}=\pm 1.67$
, the jump vanishes and
 $M\rightarrow 1$
at the shock position. Indeed, as seen in (d), for
 $\unicode[STIX]{x1D702}=2$
the shock has disappeared and one observes a smooth profile.
The position of the shock front as function of time, as determined from the maximum of the density gradient (symbols). The end of the shock is determined by the procedure used in figure 10 to determine the size of the jump. The symbols are superimposed with the theoretical prediction (4.15), with
 $B$
as given in table 1.

The rescaled values of the velocity field
 $U_{1,2}$
at the front and back of the shock, written as a function of the similarity variable
 $\unicode[STIX]{x1D702}$
. Numerical results are for
 $t^{\prime }=-0.009$
(dashed line),
 $t^{\prime }=-0.014$
(dotted line) and
 $t^{\prime }=-0.039$
(solid line). The heavy solid line is the theoretical prediction based on (4.13), using the PSM data.

In figure 9 we compare the shape of the shock in real space with the theoretical prediction for four different times, as given in the figure. The shock position is determined numerically from the maximum gradient of the density, and excellent agreement with the shape (4.15) of the shock line is found. As the shock propagates, the width of the shock spreads like
 $|t^{\prime }|^{1/2}$
, with a prefactor (4.14) determined from the coefficients
 $A_{i}$
. To know where the shock line ends, we have to find the point where the jump goes to zero. To this end we determine the size of the jump, which is shown in figure 10.
Thus to look at the structure of the shock in more detail, we consider the velocity in the front and back of the shock,
 $U_{1/2}=U_{s}\mp \unicode[STIX]{x1D6E5}$
, as given by (4.12), (4.13). This prediction is shown as the heavy black line in figure 10, with coefficients determined before the singularity. The values of
 $U_{1}$
and
 $U_{2}$
are determined numerically from slices such as those shown in figure 8, but for a range of
 $\unicode[STIX]{x1D702}$
values, until the shock disappears. Similarity functions are found by rescaling according to
 $U_{1/2}=(u_{1/2}-u_{0})/|t^{\prime }|^{1/2}$
and
 $\unicode[STIX]{x1D702}=y^{\prime }/|t^{\prime }|^{1/2}$
.
Near the centre of the shock,
 $U_{1}$
and
 $U_{2}$
are relatively easy to determine, by looking for a corner in the profile, where it suddenly becomes vertical; but as the shock becomes weaker near the edge, numerical viscosity leads to a rounding of the jump, and values of
 $U_{1}$
,
 $U_{2}$
can no longer be read off as easily. Instead, we adopt the following procedure, which is used for each
 $\unicode[STIX]{x1D702}$
fixed: first, the derivative of the profile with respect to
 $\unicode[STIX]{x1D709}$
has a sharp peak at the position of the shock, which we take as the location of its minimum. Second, by interpolation from the grid used by the Basilisk software we find the curves
 $U_{+}(\unicode[STIX]{x1D709})$
and
 $U_{-}(\unicode[STIX]{x1D709})$
of the upper and lower branches of the profile, excluding the region directly at the shock where numerical viscosity is significant. Third, we use a fourth-order extrapolation of these curves to the position of the shock to find the actual value
 $U_{1}$
at the intersection of the upper branch with a vertical line at the position of the shock, and
 $U_{2}$
from the lower branch. The result of this procedure is shown in figure 10 for three different values of
 $t^{\prime }$
. Again, excellent collapse is found, as well as agreement with the theoretical prediction, based on the PSM simulation.
6 Discussion
In this manuscript we have derived the leading-order behaviour of the solution of the compressible two-dimensional isentropic Euler equation near the formation of its first singularity. We have obtained a self-similar structure for the local solution near the singularity, showing it captures the main features of the local behaviour of the shock solution after singularity formation. In particular, we find scaling like
 $t^{1/2}$
along the orthogonal direction of propagation and scaling like
 $t^{3/2}$
along the direction of propagation. Furthermore, for a specific choice of initial data, we have compared the spatial structure of the shock with our theoretical predictions, finding good agreement.
It is a worthwhile exercise to extend our calculations to three space dimensions, in which case there are two variables
 $y$
and
 $z$
in the direction transversal to the direction of propagation
 $x$
. Repeating essentially the same steps as before, this leads to a similarity profile similar to (3.29), but which contains all third-order terms in the variables
 $U$
and the two similarity variables for the transversal directions.
Our similarity solution is in the form of an infinite series (3.4), (3.6), of which we calculated the leading-order contributions
 $\unicode[STIX]{x1D6F7}(\unicode[STIX]{x1D709},\unicode[STIX]{x1D702})$
and
 $R(\unicode[STIX]{x1D709},\unicode[STIX]{x1D702})$
. It would be interesting to pursue the calculation to the next order and beyond, in order to calculate the contributions of higher order such as
 $\unicode[STIX]{x1D6F7}_{1}(\unicode[STIX]{x1D709},\unicode[STIX]{x1D702})$
and
 $Q(\unicode[STIX]{x1D709},\unicode[STIX]{x1D702})$
. This will affect the transversal velocity component
 $v$
, while our focus has been on the component
 $u$
in the direction of propagation.
Acknowledgements
J.E.’s work was supported by Leverhulme Trust Research Project grant RPG-2012-568. T.G. acknowledges the support of the Leverhulme Trust Research fellowship RF-2015-442. M.A.H. thanks the Ministerio de Educación, Cultura y deporte of Spain for supporting him with the grant ‘Salvador de Madariaga’ during his stay at Bristol University.