Introduction
Population ageing is a global phenomenon which especially challenges China’s social policy because of the county’s rapid ageing in the context of underdevelopment: ‘ageing before affluence’. According to the Seventh National Population Census, the number of older people aged 65 and over has more than doubled during the past two decades, from 88 million in 2000 to 191 million in 2020, and increased as a proportion of the total population from 6.96 per cent in 2000 to 13.50 per cent in 2020 (National Statistical Bureau 2021). This is expected to rise to 366 million, equating to 26.1 per cent of the total population, by the middle of this century (United Nations 2019). This unprecedented demographic shift is largely due to extended average life expectancy, which has increased over the past three decades by nearly 9 years, to 78 in 2020 (National Statistical Bureau 2021). However, the quality of older people’s lives during these extra years is unclear. In low-to-middle-income countries such as China, extended life expectancy does not mean a healthier life with lower morbidity, but, rather, rising rates of chronic disease and multimorbidity (World Health Organization [WHO] 2015b). Thus, additional health-care services are needed to meet the increasing demands associated with longevity. In China, however, health-care resources are limited and unequally distributed. The mismatch between population ageing and socio-economic development is apparent across the country. The latest Census shows that the three provinces with the highest proportion of older people are Liaoning (17.42 per cent), Chongqing (17.08 per cent) and Sichuan (16.93 per cent), which are all located in the central and western regions. By contrast, the proportion of older people in Guangdong, the most affluent province, whose gross domestic product in 2020 was nearly equal to that of South Korea, ranking tenth in the world, was only 8.58 per cent. Such mismatches are particularly prevalent between rural and urban areas (WHO 2015a). The proportion of older people aged 60 and above in rural areas (24.79 per cent) is greater than in urban ones (16.50 per cent), while the numbers of health technology staff and beds per thousand were 11.46 and 8.81, respectively, in urban areas in 2020, compared with 5.18 and 4.95, respectively, in rural ones (National Statistical Bureau 2021).
On social justice and humanitarian grounds, scarce health resources should be distributed according to need (Blaxter Reference Blaxter1983; Braveman Reference Braveman2022; Whitehead Reference Whitehead1992). Compared to people of working age, older people have fewer chances to acquire health-care resources themselves but, instead, must rely on public provision. Health policies seeking to equalise the position of older people require a detailed understanding of the health inequalities they face, as well as the extent to which they can access health services. Health inequalities and health system accessibility among older people have been discussed extensively in developed societies (Bergqvist et al. Reference Bergqvist, Yngwe and Lundberg2013; McGowan et al. Reference McGowan, Buckner, Mead, McGill, Ronzi, Beyer and Bambra2021). The growing literature in this field is full of mixed, even contradictory, results (Lundberg et al. Reference Lundberg, Yngwe, Bergqvist and Sjöberg2015). By comparison, in countries in transition, where the economy and the society have experienced fundamental change, these issues have hardly been considered (Castillo-Laborde et al. Reference Castillo-Laborde, Aguilera-Sanhueza, Hirmas-Adauy, Matute, Delgado-Becerra, Najera-De Ferrari, Olea-Normandin and Gonzalez-Wiedmaier2017; Khang and Lee Reference Khang and Lee2012). Particularly in China, a typical less developed transition country, the basic economic system has changed from a planned to a market-oriented one, resulting in a transformation of the welfare system from an employer-based Soviet system to a state-social security one (Zhu and Walker Reference Adler and Rehkopf2018); this in turn has resulted in increasing inequality in both primary and secondary distribution. It is unclear whether these socio-economic transitions favour the better-off or the disadvantaged. Furthermore, it is also unclear whether inequalities in health have been mitigated by the enormous progress in health policy, characterised by the significant expansion of social medical insurance and improvement of health-care accessibility (HA) since the turn of the century, especially when an authoritative assessment at the time was very pessimistic (Gong et al. Reference Gong, Walker and Shi2007; He et al. Reference He, Bali and Ramesh2022). Based on data derived from a large longitudinal survey, this paper investigates the trends in health inequalities among older Chinese people over the past 15 years. In addition, we assess the impact of health policy progress, particularly concerning accessibility, on those inequalities.
Background
Development of China’s health-care system in this century
Since the collapse of the Soviet model of the social welfare system in the 1980s, most residents were exposed to disease risks until 1998, when a wholly new social medical insurance scheme, the Basic Medical Insurance for Employees (BMIE), was established for enterprise employees in urban areas. Another two schemes, the New Rural Cooperative Medical Insurance and the Basic Medical Insurance for Urban Residents, were piloted in 2003 and 2011, respectively, and have been integrated as the Basic Medical Insurance for Urban and Rural Residents (BMIURR). This signalled that a universal but stratified social medical system had been constructed.
Compared to the highly stratified pension system (Zhu and Walker Reference Adler and Rehkopf2018), however, while medical insurance is also stratified according to occupation, the extent of the inequality is much smaller. As shown in Table 1, as many as 78.4 per cent of residents were originally excluded from all medical insurance schemes. This plummeted to 2.9 per cent in 2018. At the same time, the Free Medical Treatment (FMT) for workers in government departments and public institutions was abolished and replaced by the BMIE (Center for Health Statistics and Information 2021). Thus, the BMIE is a work-related medical insurance scheme covering most urban workers. The resident medical insurance covered 74.0 per cent of rural and urban residents in 2018. The medical insurance coverage rate for older people reached 98.8 per cent in 2018, with a slightly higher rate in rural areas than in urban ones (Center for Health Statistics and Information 2021).
Coverage of medical insurance schemes (%)

Data source: Center for Health Statistics and Information (2021).
With this extension of coverage, the role of medical insurance in alleviating older patients’ medical costs has been enhanced. The proportion of expenditure by patients has steadily declined since 2001. In contrast, the proportions paid by medical insurance funds and public finance have increased from 24 per cent and 15 per cent, respectively, in 2001 to 44 per cent and 27 per cent, respectively, in 2019 (National Health Commission 2020). Another index measuring inequality is differences in benefit levels among the stratified medical insurance schemes. Table 2 presents a comparison of medical benefits between the resident medical insurance scheme and the worker-related one over the past 15 years. It shows that while the benefit levels of work-related medical insurance are still better than those of the resident medical insurance, the gap between them has narrowed significantly since 2008.
Comparison of medical insurance benefits (%, CNY)

Data source: Center for Health Statistics and Information (2021).
Alongside the improvement of health-care affordability, supported by a universal medical insurance system, the availability of health services has also improved during this period, particularly since 2009. The Chinese government has also strengthened the capacity of health services at a community level to enhance their availability. It has improved financial compensation for public hospitals, to guarantee the return of the public benefits promised by the health system reform act in 2009. Equal access to basic health services was one of the act’s major goals. According to the report by the National Center for Health Statistics and Information (NHFPC), health-care availability has improved markedly. We selected several indicators to examine the extent of this improvement, as presented in Table 3. The proportion living less than 20 minutes from the nearest medical facility has increased steadily from 88.4 per cent in 2003 to 95.1 per cent in 2018, with a narrowing of the gap between urban and rural areas. The proportion of people aged 65 and over who should visit a doctor or be hospitalised, but have not, reduced dramatically, to 8.3 per cent and 19.9 per cent, respectively, in 2018.
Health-care services availability between 2003 and 2018 (%)

Data source: Center for Health Statistics and Information (2021).
Despite the still significant inequality in HA, the huge progress in health-related social policy has contributed to the improvement of health conditions and health equity among older people. Therefore, we expected inequalities in health among older people to have narrowed.
Health inequality measurement
Health inequalities refer to ‘differences in health which are not only unnecessary and avoidable but, in addition, are considered unfair and unjust’ (Whitehead Reference Whitehead1992, p. 219), while health equity is defined as ‘the absence of unfair and avoidable or remediable differences in the health among social groups’ (Solar and Irwin Reference Solar and Irwin2010, p.4). Correspondingly, health equity implies that, ideally, everyone should have a fair opportunity to attain their full health potential and, more pragmatically, that no one should be disadvantaged from achieving this potential if it can be avoided (WHO 1986). Thus, originally, this concept had a moral and ethical dimension (Scholz Reference Scholz2020). According to this criterion, the abundance of measures of health inequalities can be roughly divided into two categories: surface (or total) and underlying (or socio-economic) inequalities in health (Harper et al. Reference Harper, Lynch, Meersman, Breen, Davis and Reichman2008; Wagstaff and van Doorslaer Reference Wagstaff, van Doorslaer, Culyer and Newhouse2000). Measures of surface inequality, such as the Lorenz curve and the Gini coefficient, just consider the distribution of a health indicator in a population, whereas measures of underlying inequality, including the concentration curve and indices, assess how a health indicator varies among socio-economic groups (Schlotheuber and Hosseinpoor Reference Schlotheuber and Hosseinpoor2022).
Surface inequalities in health, eschewing a moral dimension, are used to measure the extent of health inequality in a certain society, rather than trying to capture whether persons in poor health are rich or poor, and is frequently replaced by the term disparity in the United States (Lynch and Perera Reference Lynch and Perera2017). The Lorenz curve and the Gini coefficient are the most frequently used measurements of such inequalities in health. This approach, however, has been criticised on the grounds that the socio-economic dimension is an integral part of the measurement exercise and should not be pushed back to the explanatory one (Whitehead Reference Whitehead1992). The concentration curve, a modified Lorenz curve, considering each person’s rank in the socio-economic distribution, and a series of concentration indices, is commonly used to measure socio-economic inequalities in health (O’Donnell et al. Reference O’Donnell, van Doorslaer, Wagstaff and Lindelow2007). This does not measure the magnitude of inequality that can be compared conveniently across many time periods, countries, regions or whatever unit may be chosen for comparison (Schlotheuber and Hosseinpoor Reference Schlotheuber and Hosseinpoor2022). A concentration index (CI), based on the concentration curve, is a bivariate rank-dependent index that summarises the relationship between cumulative health and socio-economic rank in which gender, age, ethnicity and residential location are the most frequently used measures of socio-economic status (Heckley et al. Reference Heckley, Gerdtham and Kjellsson2016). In empirical studies, corrected concentration indices, such as the Wagstaff Index (WI, Reference Wagstaff2009) and the Erreygers Index (EI, Reference Erreygers2009), are the most common approaches when analysing binary health variables (Ataguba Reference Ataguba2022). Those extended concentration indices measuring pure inequalities allow attitudes to inequality to be made explicit and to see how measured inequality changes as attitudes to inequality change (Wagstaff Reference Wagstaff2002).
Rueda et al. (Reference Rueda, Artazcoz and Navarro2008) analysed gender inequalities in health among older people in Western Europe using the first wave of SHARE (Survey of Health, Ageing and Retirement in Europe). They found that health inequalities persist between genders: women have poorer health status than men. Rueda and Artazcoz (Reference Rueda and Artazcoz2009) compared gender inequalities in health among older people in Spain by adopting a composite index of health inequality, including self-perceived health status, poor mental health status and long-standing limiting illness. They confirmed the disadvantaged health status of older women. Health gaps based on gender are encapsulated in the ‘male–female health-survival paradox’ (Lindahl-Jacobsen et al. Reference Lindahl-Jacobsen, Hanson, Oksuzyan, Mineau, Christensen and Smith2013), which argues that women’s life expectancy is superior to men’s, but their health is worse. The reason is differences in morbidity transition rates between genders. The transition rate from independence/disability to death for older women is lower than for their male counterparts, while their transition rate from independence to disability is higher (Jiao et al. Reference Jiao, Liu and Xu2021).
In the case of ethnicity, most studies consider the total population covering all ages, including older adults, and examine the inequalities in health between ethnic minorities and the majority population (Adler and Rehkopf Reference Adler and Rehkopf2008; Cooper Reference Cooper2002), or migrants and non-migrants (Leão et al. Reference Leão, Sundquist, Johansson and Sundquist2009). Of the very few studies on health inequalities and ethnicity in China, Ouyang and Pinstrup-Andersen (Reference Ouyang and Pinstrup-Andersen2012) found significant negative differences between minority and majority Han Chinese in a set of anthropometric measures for all age groups, due in part to the vast socio-economic inequalities between regions in China. Because of the great disparities in development between the rural and urban areas in China, studies of Chinese health inequalities among older people highlight the importance of comparisons between these areas (Lu et al. Reference Lu, Yu and Gao2018; Xue Reference Xue2015). Older people in rural areas are more vulnerable to poor health than their urban counterparts, whereas health inequalities are more pronounced in urban areas (Gu et al. Reference Gu, Kou, You, Xu, Yang, Liu, Liu, Gu and Li2019; Le et al. Reference Le, Leon-Gonzalez, Giang and Nguyen2021). Chen and Pan (Reference Chen and Pan2020) estimated inequalities in health among older people in China’s rural areas and found that higher socioeconomic status older people were more likely to obtain health care and report better health. Socio-economic determinants related to education, income, employment and social insurance are regarded as avoidable. Many studies have investigated the association between socio-economic determinants and inequalities in health among older people (Avendano et al. Reference Avendano, Glymour, Banks and Mackenbach2009; Huisman et al. Reference Huisman, Kunst and Mackenbach2003).
Despite dramatic social and economic changes in recent decades, few studies focus on long-term trends in health inequality (Du and Wang Reference Du and Wang2013). In particular, we do not know whether health inequalities in China have widened or narrowed since the systematic reform of its welfare regime.
Impact of health policies on health inequality
Compared to the given factors, the impact of the avoidable determinants on inequalities in health is more sensitive to the cultural and institutional contexts they are embedded in (Homan Reference Homan2019). Eco-social theory, for example, stresses the importance of macro-level discriminatory environments in shaping individual inequalities in health (Krieger Reference Krieger2001). A few studies have paid attention to the ‘causes of the causes’, investigating the wider social circumstances in which people live their lives and that, to a greater or lesser extent, indirectly affect their chances of being healthy and living long (Bergqvist et al. Reference Bergqvist, Yngwe and Lundberg2013). Focusing on health policies, Mackenbach and McKee (Reference Mackenbach and McKee2013) argued that public health policies based on primary prevention (aiming to avoid the occurrence of disease by reducing exposure to health risks) and secondary prevention (aiming to avoid the development of disease to a symptomatic stage by diagnosing and treating disease before it causes significant morbidity) played a potential role in mitigating health inequalities through both downstream (such as state control regulating the supply of a particular substance or activity) and upstream (such as individual-level approaches for the prevention or management of disease) interventions. While other studies have documented the adverse effects of health policies on health inequality. Yamada et al. (Reference Yamada, Chen, Murata, Hirai, Ojima, Kondo and Harris2015) found that the disparity in access to health-care services significantly elevated health inequality among Americans.
Many researchers have attempted to explain the mixed results from a welfare state regime perspective (Dahl and van der Wel Reference Dahl and van der Wel2013). They argue that welfare regimes characterised by distinct policy domains, including health care, social policy and public health policy, are therefore a vital macro-level determinant of health, which moderates the extent, and the impact, of socio-economic inequalities in exposure to the social determinants of health (Thomson et al. Reference Thomson, Bambra, McNamara, Huijts and Todd2016). Comparative studies suggest that Nordic countries such as Sweden provide a decent life to a larger share of the population, leading to better health and smaller inequalities than liberal regimes like Great Britain (Vagerö and Lundberg Reference Vagerö and Lundberg1989). Compared to Western societies, where social policy, in the form of universal and relatively generous welfare benefits, narrows health gaps (Högberg Reference Högberg2018), in less developed countries, on the one hand, economic advance equates to increasing income inequality; on the other, a stratified welfare system disproportionately redistributes scarce benefits to the rich (Le et al. Reference Le, Leon-Gonzalez, Giang and Nguyen2021). This reverse redistribution contributes significantly to inequality in old age when people have exited from the labour market and, consequently, are more dependent on social welfare. Gu (Reference Gu2019) examined the uneven impacts of health insurance on inequalities in health between China’s rural and urban areas and found that the unequal distribution of health insurance contributed to higher health inequalities in urban areas. Similarly, Yang (Reference Yang2020) concluded that inequalities in health in China have enlarged over the past two decades, which runs counter to the claims of policy makers. However, there are still two research questions to be answered. First, do the above conclusions apply to older people? Second, do those conclusions change if an alternative index of health inequality is applied?
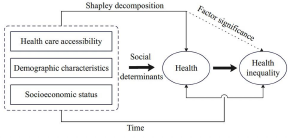
Considering the above analyses, a conceptual framework was constructed and is shown in Figure 1. It distinguishes the three types of social determinants of health and health inequalities among older adults that we examined with a focus on HA, which we measured along three dimensions: availability of medical treatment, social medical insurance and affordability of health care. We then compared the relative significance of each factor via a Shapley decomposition. Embedded in the context of health-care policy development in China, a multi-phase dataset covering the years 2005 to 2018 was employed to examine the time trends of health inequality and the relative importance of each factor.
Conceptual framework.

The conceptual framework reflects a political economy of ageing perspective, which aligns easily with the social determinants of health because both are rooted in social constructionism. Following political economy theory, this framework eschews the ill-defined approaches of ‘successful’ and ‘productive’ ageing and their respective individualism and economism, as well as their common neo-liberal underpinning. In contrast, political economy demands recognition of difference and diversity, and an analysis of inequality and intersectionality (Holman and Walker Reference Holman and Walker2021). It would argue, for example, that individualistic approaches, such as successful ageing, overlook the critical importance of the highly unequal structural distribution of opportunities (Katz and Calasanti Reference Katz and Calasanti2014; Walker Reference Walker, Baars, Dannefer, Phillipson and Walker2005). This is particularly important in the field of health inequalities because many popular narratives about healthy ageing emphasise individual behaviour. Further, it invites a life course analysis (‘time’ in the conceptual model) because later-life inequalities are usually produced at earlier stages of the life course and may stem from accumulated advantages/disadvantages.
Data, variables and methods
Data
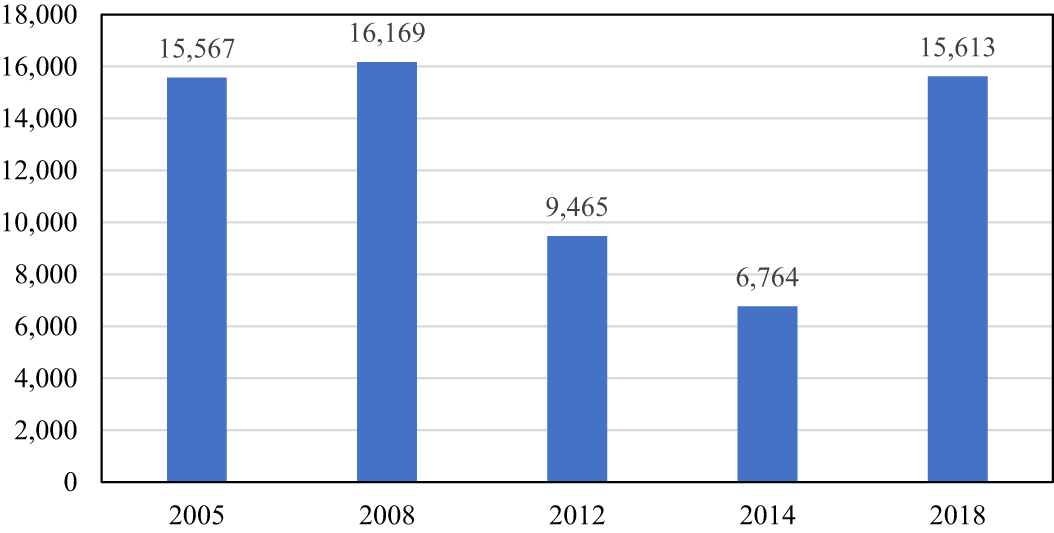
The data employed in this paper are derived from the Chinese Longitudinal Healthy Longevity Survey (CLHLS), which is a large national study of the older population. It is conducted by Peking University with the aim of a better understanding of population ageing in China and its impact on socio-economic development and the wellbeing of older people. This survey was initiated in 1998, and there have been seven subsequent survey waves up to 2018, covering 23 out of 31 provinces in China. Many of those sampled were interviewed more than twice. The data quality is good, and the psychometric measures are judged to be reliable (Gu and Dupre Reference Gu, Dupre, Zeng, Poston, Vlosky and Gu2008). Those sampled in Waves 1 and 2 are aged 80 and above, and the age band was extended to those aged 65 and over from Wave 3. However, some key variables of interest were absent from Wave 3; therefore, the datasets used in this research cover the last five waves, between 2005 and 2018. The total sample was 64,377, which was reduced to 63,578 after deleting respondents with missing dependent variables. The number sampled for each wave is shown in Figure 2.
Sample numbers per wave.

Variable measurement
Health status
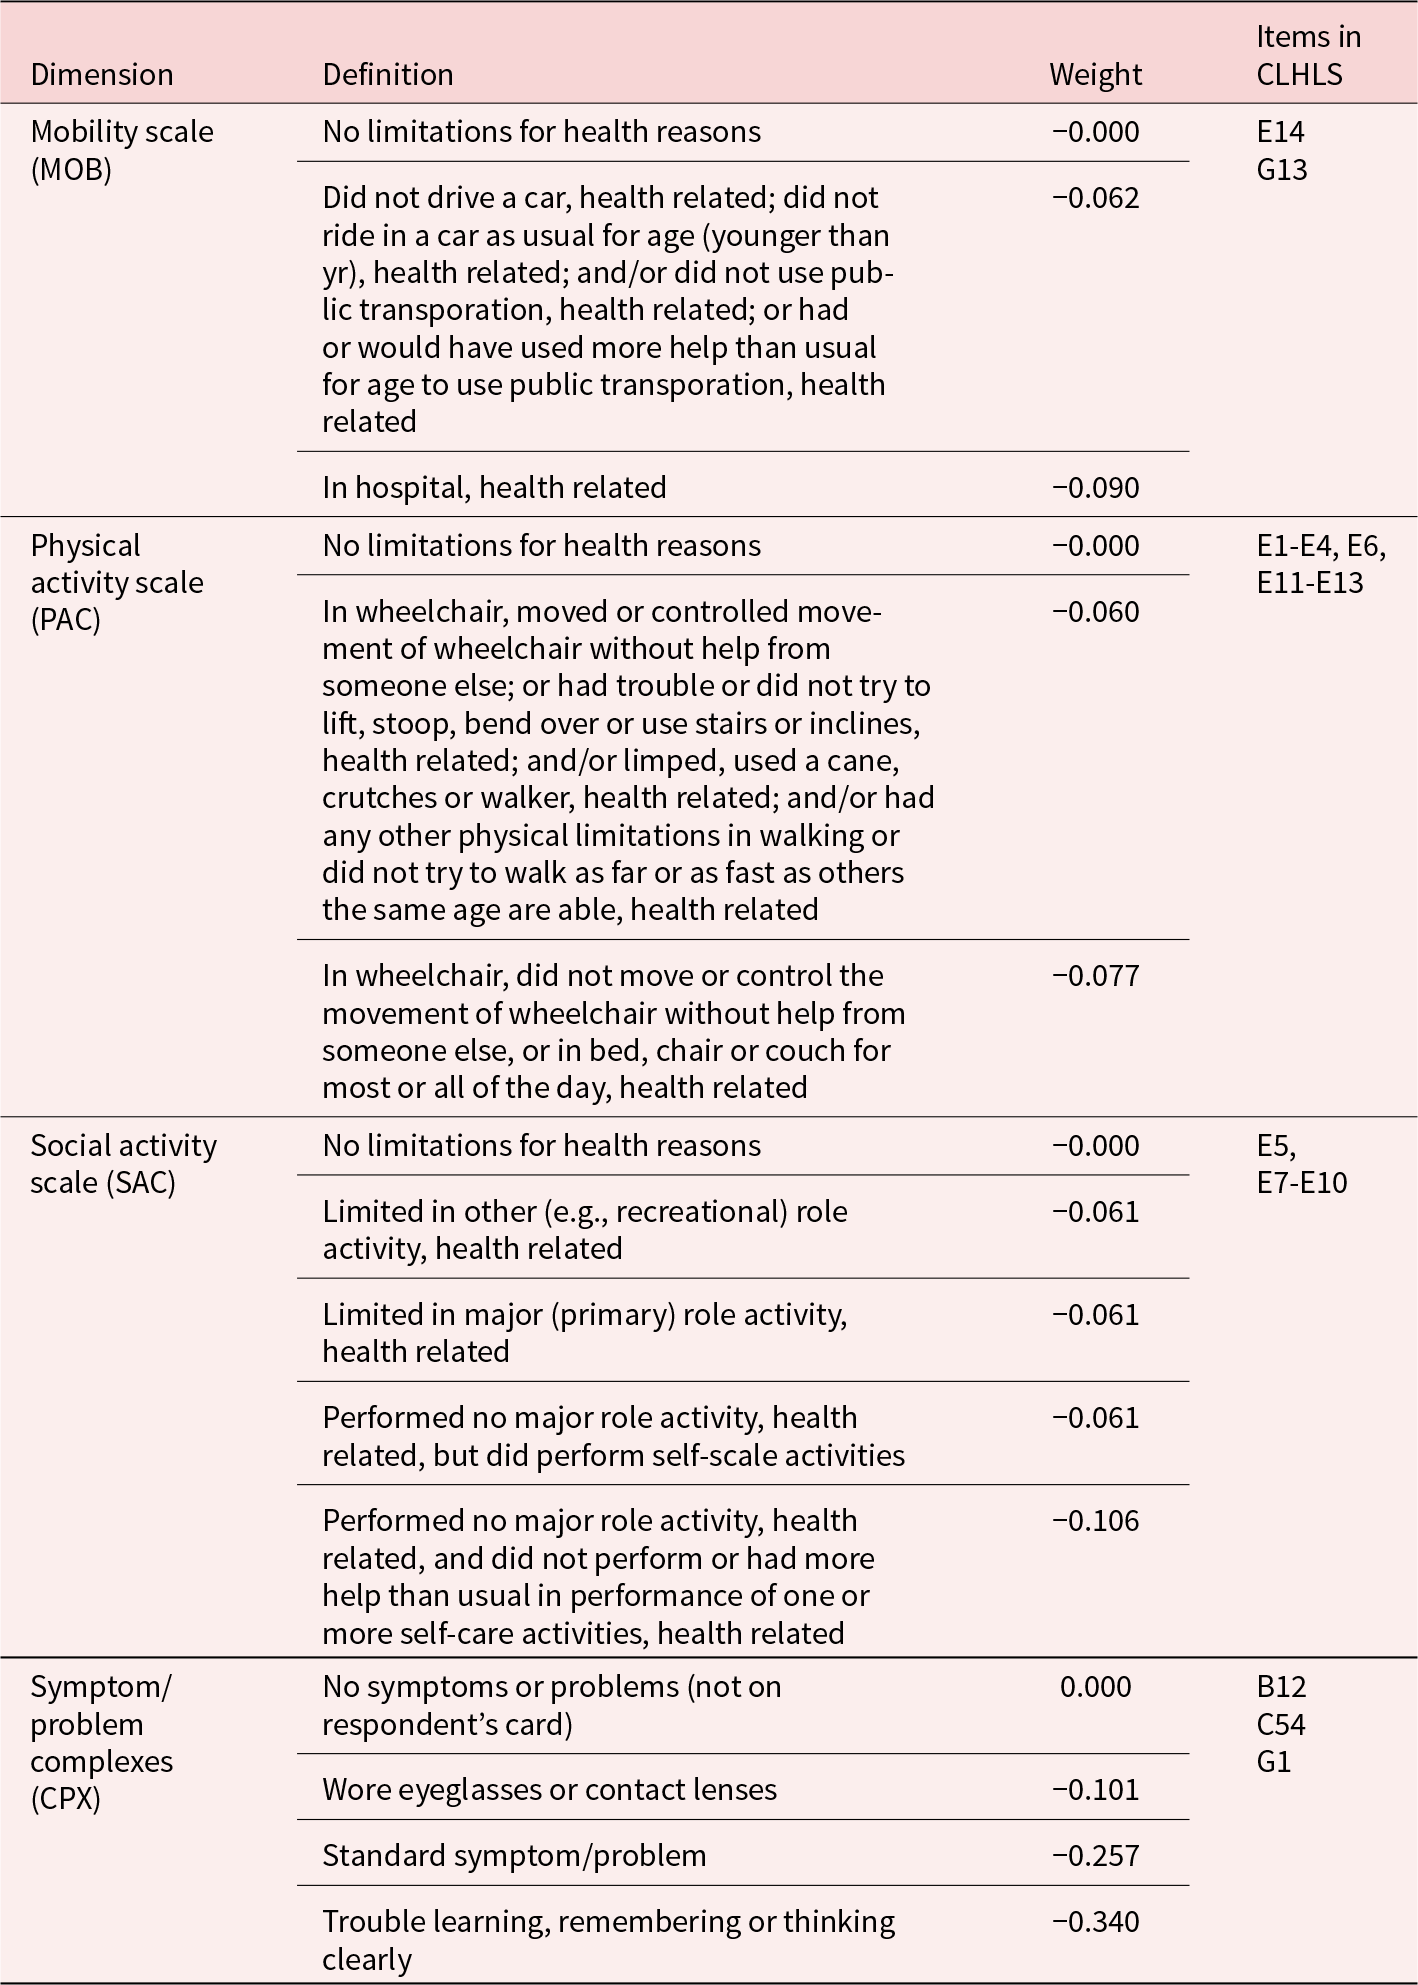
A single index is rightly criticised for lacking accuracy, so multiple variables, combining physical and self-rated health indices, are used increasingly to improve the validity of health measurement (Jiao Reference Jiao2014; Rueda and Artazcoz Reference Rueda and Artazcoz2009). In this research, the Quality of Well-Being (QWB) index, designed by Kaplan and Anderson (Reference Kaplan and Anderson1988), was employed to measure the complex health status of older people. This index is an integrated measure of health-related quality of life, which combines clinical diagnosis with self-rated health status. In contrast to specific health measures, this index is one of the few instruments that can, on the one hand, provide a comprehensive summary of the heterogeneous health effects of different diseases and, on the other hand, capture side effects and benefits that were not anticipated (Du and Wang Reference Du and Wang2013; Kaplan and Anderson Reference Kaplan and Anderson1988). It has been extensively validated, and its psychometric properties are well established (Seiber et al. Reference Seiber, Groessl, David, Ganiats and Kaplan2008). The QWB is a preference-weighted index integrating three scales of functioning (mobility MOB, physical activity PAC and social activity SAC) with a measure of symptoms and problems (CPX) to produce a point-in-time expression of wellbeing that runs from 0 (for death) to 1 (for asymptomatic optimum function). Each scale includes several sub-indices. For example, 11 items in those three function scales are fixed, while 21 items indicating symptoms and problems are optional. Most empirical studies select several items from the whole CPX scale (Pan et al. Reference Pan, Fan, Yang and Deng2019). Following Du and Wang (Reference Du and Wang2013), we selected corresponding items from the CLHLS questionnaire, including four symptoms and problems, as shown in the Appendix, Table A1. Preference weights for each item are fixed and derived from a community sample conducted by Kaplan and Anderson (Reference Kaplan and Anderson1988), which have been confirmed to be consistent across nations and groups (Seiber et al. Reference Seiber, Groessl, David, Ganiats and Kaplan2008).
Health-care accessibility
Quantifying how much personal health care can improve population health and ultimately health system performance is a crucial undertaking, particularly following the inclusion of universal health coverage in the Sustainable Development Goals. Researchers commonly use HA to measure this performance, which refers to the relative ease by which health care can be reached (Wang Reference Wang2012). For example, the World Health Organization (WHO), the World Bank and The Lancet have developed a series of health-care access and quality indices (HAQ) to monitor the unequal performance of countries (Fullman et al. Reference Fullman, Yearwood and Abay2018). Equal access to health care means that services are available whenever and wherever patients need them, and that the point of entry to the system is well-defined, all of which has been operationalised by a variety of indicators (Freeborn and Greenlick Reference Freeborn and Greenlick1973). Taking the above-mentioned HAQ, for example, the WHO employed three indicators, including physicians, nurses and midwives per 1,000, while the coverage index of three primary health-care interventions was used by the World Bank (Fullman et al. Reference Fullman, Yearwood and Abay2018). Other variables, such as health insurance, health expenditure, distance to health facilities and availability of medical treatment when in serious illness, are well documented by studies at the individual level (Li and Xia Reference Li and Xia2014). According to Chen and Pan (Reference Chen and Pan2020) and the CLHLS questionnaire, the HA in this study was constructed with three indicators: availability of medical treatment when in serious illness (yes = 1; no = 0); medical insurance types which include the BMIURR, the BMIE and the FMT for particular persons and those without any medical insurance; and affordability of health care, measured by the proportion of older people’s total medical expenditure paid by their families in the last year in relation to their household income per capita. This HA covers service and financial accessibility.
Control variables
To assess the net effect of HA on inequalities in health, some key control variables, such as gender (men = 1; women = 0), age, ethnicity (Han = 1, minority = 0), current residential areas (urban = 1, rural = 0), years of schooling, marital status (with spouse = 1; others = 0), co-residence status (alone = 0; with family members = 1), unhealthy practices (smoking = 1; otherwise = 0) and occupational types before retirement (managerial position/technicist = 1; general staff = 2; farmer = 3; others = 4) were included in our analysis according to previous studies (Chen and Pan Reference Chen and Pan2020; Li and Xia Reference Li and Xia2014). Table 4 shows the sample distribution and variable descriptions.
Sample distribution and variable description (N = 64,377)

Note: All values in the table are based on the pooled data from Wave 4 to Wave 8.
Methods
Measurement of health inequalities
A CI represents twice the area between the concentration curve, which plots the cumulative percentage of individuals ranked by socio-economic status against the cumulative percentage of QWB (Le et al. Reference Le, Leon-Gonzalez, Giang and Nguyen2021). It captures the extent to which health differs across individuals ranked by some indicator, such as socio-economic status (O’Donnell et al. Reference O’Donnell, O’Neill, van Ourti and Walsh2016). Although an ordinal scale is sufficient for the variable used to rank individuals, the selection of a CI depends on the properties of the variable of interest. For variables on fixed or ratio scales, the standard and generalised CIs are appropriate. When the variable of interest is cardinal, a modified CI is a better choice, as shown in Equation 1 (Erreygers and van Ourti Reference Erreygers and van Ourti2011):
 \begin{equation}MC(h \vee y) = \frac{1}{n}\mathop \sum \limits_{i = 1}^n \left[ {\frac{{{h_i}}}{{\bar h - {h^{min}}}}\left( {2{R_i} - 1} \right)} \right]\end{equation}
where n is the number sampled, hi is the health variable for which inequality is measured, while hmin is the lower limit of hi and Ri is the weighted fractional rank. The index ranges between  $\frac{{1 - n}}{n}$ and
 $\frac{{n - 1}}{n}$.
For microdata, the data must be weighted. The weighted fractional rank is defined as Equation 2:
 \begin{equation}{R_i} = \mathop \sum \limits_{j = 0}^{i - 1} {w_j} + \frac{{{w_i}}}{2}\end{equation}
where wj is the sample weight scaled to sum to 1, observations are sorted in ascending order of socio-economic status, and w0 = 0.
Regression model and Shapley decomposition
Regression concerns the variance explained by the introduced variables; and Shapley the error sum of squares. To investigate the impacts of HA on older people’s health, we developed a linear regression due to the interval scale of the dependent variable, as shown in Equation 3:
 \begin{equation}y = \alpha + \mathop \sum \limits_{j = 1}^J {b_j}{x_j} + e\end{equation}
where the dependent variable, y, is the health status of older people measured by QWB;  ${x_j}$ is a set of factors determining health status, which includes the independent variable HA and control variables such as gender, age and so on; while
 ${b_j}$ is the corresponding regression coefficient of each factor;
 $\alpha $ and
 $e$ indicate the constant item and error item, respectively.
To disentangle and quantify the impact of various factors on inequalities in health among older people, we employed the Shapley decomposition method (Israeli Reference Israeli2007), which overcomes problems associated with other techniques, including being not interpretable in an intuitively meaningful way of the contribution assigned to a specific factor, constraints on the kinds of inequality indices which can be used and limitations placed on the types of contributory factors which can be considered (Shorrocks Reference Shorrocks2013).
According to variance theory, the total sum of squares (TSS) of health status can be decomposed into two parts: one is the regression sum of squares (RSS), while the other is the error sum of squares (ESS), which is unexplained deviations from the regression model. The R-square value of a linear regression is generally taken as the portion of the variance of the introduced variable accounted for by the explanatory variables, which can be expressed by Equation 4:
 \begin{equation}{R^2} = \frac{{RSS}}{{TSS}} = \frac{{Var\left( {\hat y} \right)}}{{Var\left( y \right)}} = 1 - \frac{{Var\left( e \right)}}{{Var\left( y \right)}}.\end{equation}
As pointed out by Fields (Reference Fields2003), the variance of the dependent variable can be decomposed into the contributions of all explanatory variables and the residual as Equation 5:
 \begin{equation}Var\left( y \right) = \mathop \sum \limits_{j = 1}^J Cov\left( {{b_j}{x_j},{ }y} \right) + Cov\left( {e,{ }y} \right).\end{equation}
Given the basic assumption in regression that the residual and the explanatory variables are uncorrelated, Cov(e, y) = Var(e), we can combine Equation 4 and Equation 5, then obtain Equation 6, in which the contribution of the residual is deleted:
 \begin{equation}R^{2} \left(y\right) = \frac{\sum \limits_{j}^{J}{b_j} Cov (x_{j}, y)} {Var ( y)} = 1 - \frac{{Cov\left( {e, y} \right)}}{{Var(y)}}.\end{equation}
The effect of each factor may be ranked in order of importance using Equation 5. However, this fails to consider the probable correlation between the contribution of a particular explanatory variable and that of the other ones. The coefficient of a variable thus depends on other explanatory variables. To solve this problem, Shorrocks (Reference Shorrocks2013) equated the contribution of each factor to its marginal impact, which is measured by eliminating the factor from the equation. Thus, the marginal effect of xk on the R-square, Mk, can be expressed as Equation 7:
 \begin{equation}{M_k} = {R^2}[y = a + \mathop \sum \limits_{j \in S} {b_j}{x_j} + {b_k}{x_k} + e\left] { - {R^2}} \right[y = {a^*} + \mathop \sum \limits_{j \in S} b_j^*{x_j} + {e^*}]\end{equation}
where S is a subgroup of the set of explanatory variables excluding variable k. Star marks on the right part of the equation indicate a distinction from the coefficients on the left part of the equation due to the changed ones when explanatory variables are omitted from a regression.
Since there are usually several explanatory variables, the marginal effect Mk would be expected to depend on the elimination order. This is obtained by considering the J! possible elimination sequences and by computing the average marginal effect of Mk when the sequences in ∑ are chosen at random.
Results
Inequalities in health among older people
Table 5 shows the temporal trend of older people’s health status and the simple inequality in health among subgroups. It reveals that the health status of people aged 65 and over in China has experienced a steady improvement since 2005. However, this positive trend is unequal at different times and for different social groups. Compared to the significant increase in the QWB scores between 2008 and 2014, the health status of older people has made only marginal progress since 2014. In contrast to previous studies (Ouyang and Pinstrup-Andersen Reference Ouyang and Pinstrup-Andersen2012), there are no significant gaps based on either ethnicity or residence. As for other individual characteristics, the health status of older people is associated with gender, age, marital status, educational attainment, co-resident status, occupations before retirement and unhealthy practices. Specifically, older men have better health than older women, and this gender gap has remained unchanged over the past 15 years. Health status steadily worsens with age, and inequalities among age groups have widened. Those aged 84 and under witnessed an improvement in their health, while the very elderly remained in poor health. Older people in couples are healthier than single ones, which probably contributes to the age effect because the former are more likely to be younger than the latter. Educational attainment is positively related to health status. Given the extremely low level of education among China’s older people, 2.4 years on average, those with more than 6 years of schooling, with primary education and above, are in better health. Health status differences between those with years of schooling from 7 to 12 years and those over 13 years are minuscule. Those living with their family members, who did not smoke and were in higher occupational positions reported being healthier.
Quality of Well-Being scores between 2005 and 2018

Table 6 presents the inequalities in health using concentration indices and compares subgroups without controlling other variables. All indices were positive, suggesting a pro-rich inequality in health. However, with the recent extension of social welfare schemes to people in lower economic positions (especially those in rural areas), inequalities in health among older people have narrowed steadily. The CI for the total population decreased from 0.013 in 2005 to 0.010 in 2018. Like the scenario for health status, the temporal trends of health inequalities among subgroups are more complex. First, inequalities in health among older people in poorer health are greater. For example, the concentration indices among older women are higher than among men. This is also the case for subgroups classified by education, co-residence status and unhealthy practices. Second, inequalities in health among subgroups have diminished gradually since 2005, with several exceptions in Wave 7. In the last wave in 2018, both the concentration indices for social groups and the gaps between subgroups were at their lowest level, but this trend remains to be confirmed by future waves. Third, it is surprising that the previously distinct inequality in health between urban and rural areas was not found. Those differences among subgroups should be statistically confirmed by later regression analyses.
Concentration indices of Quality of Well-Being between 2005 and 2018

Contribution of health-care accessibility to health inequalities
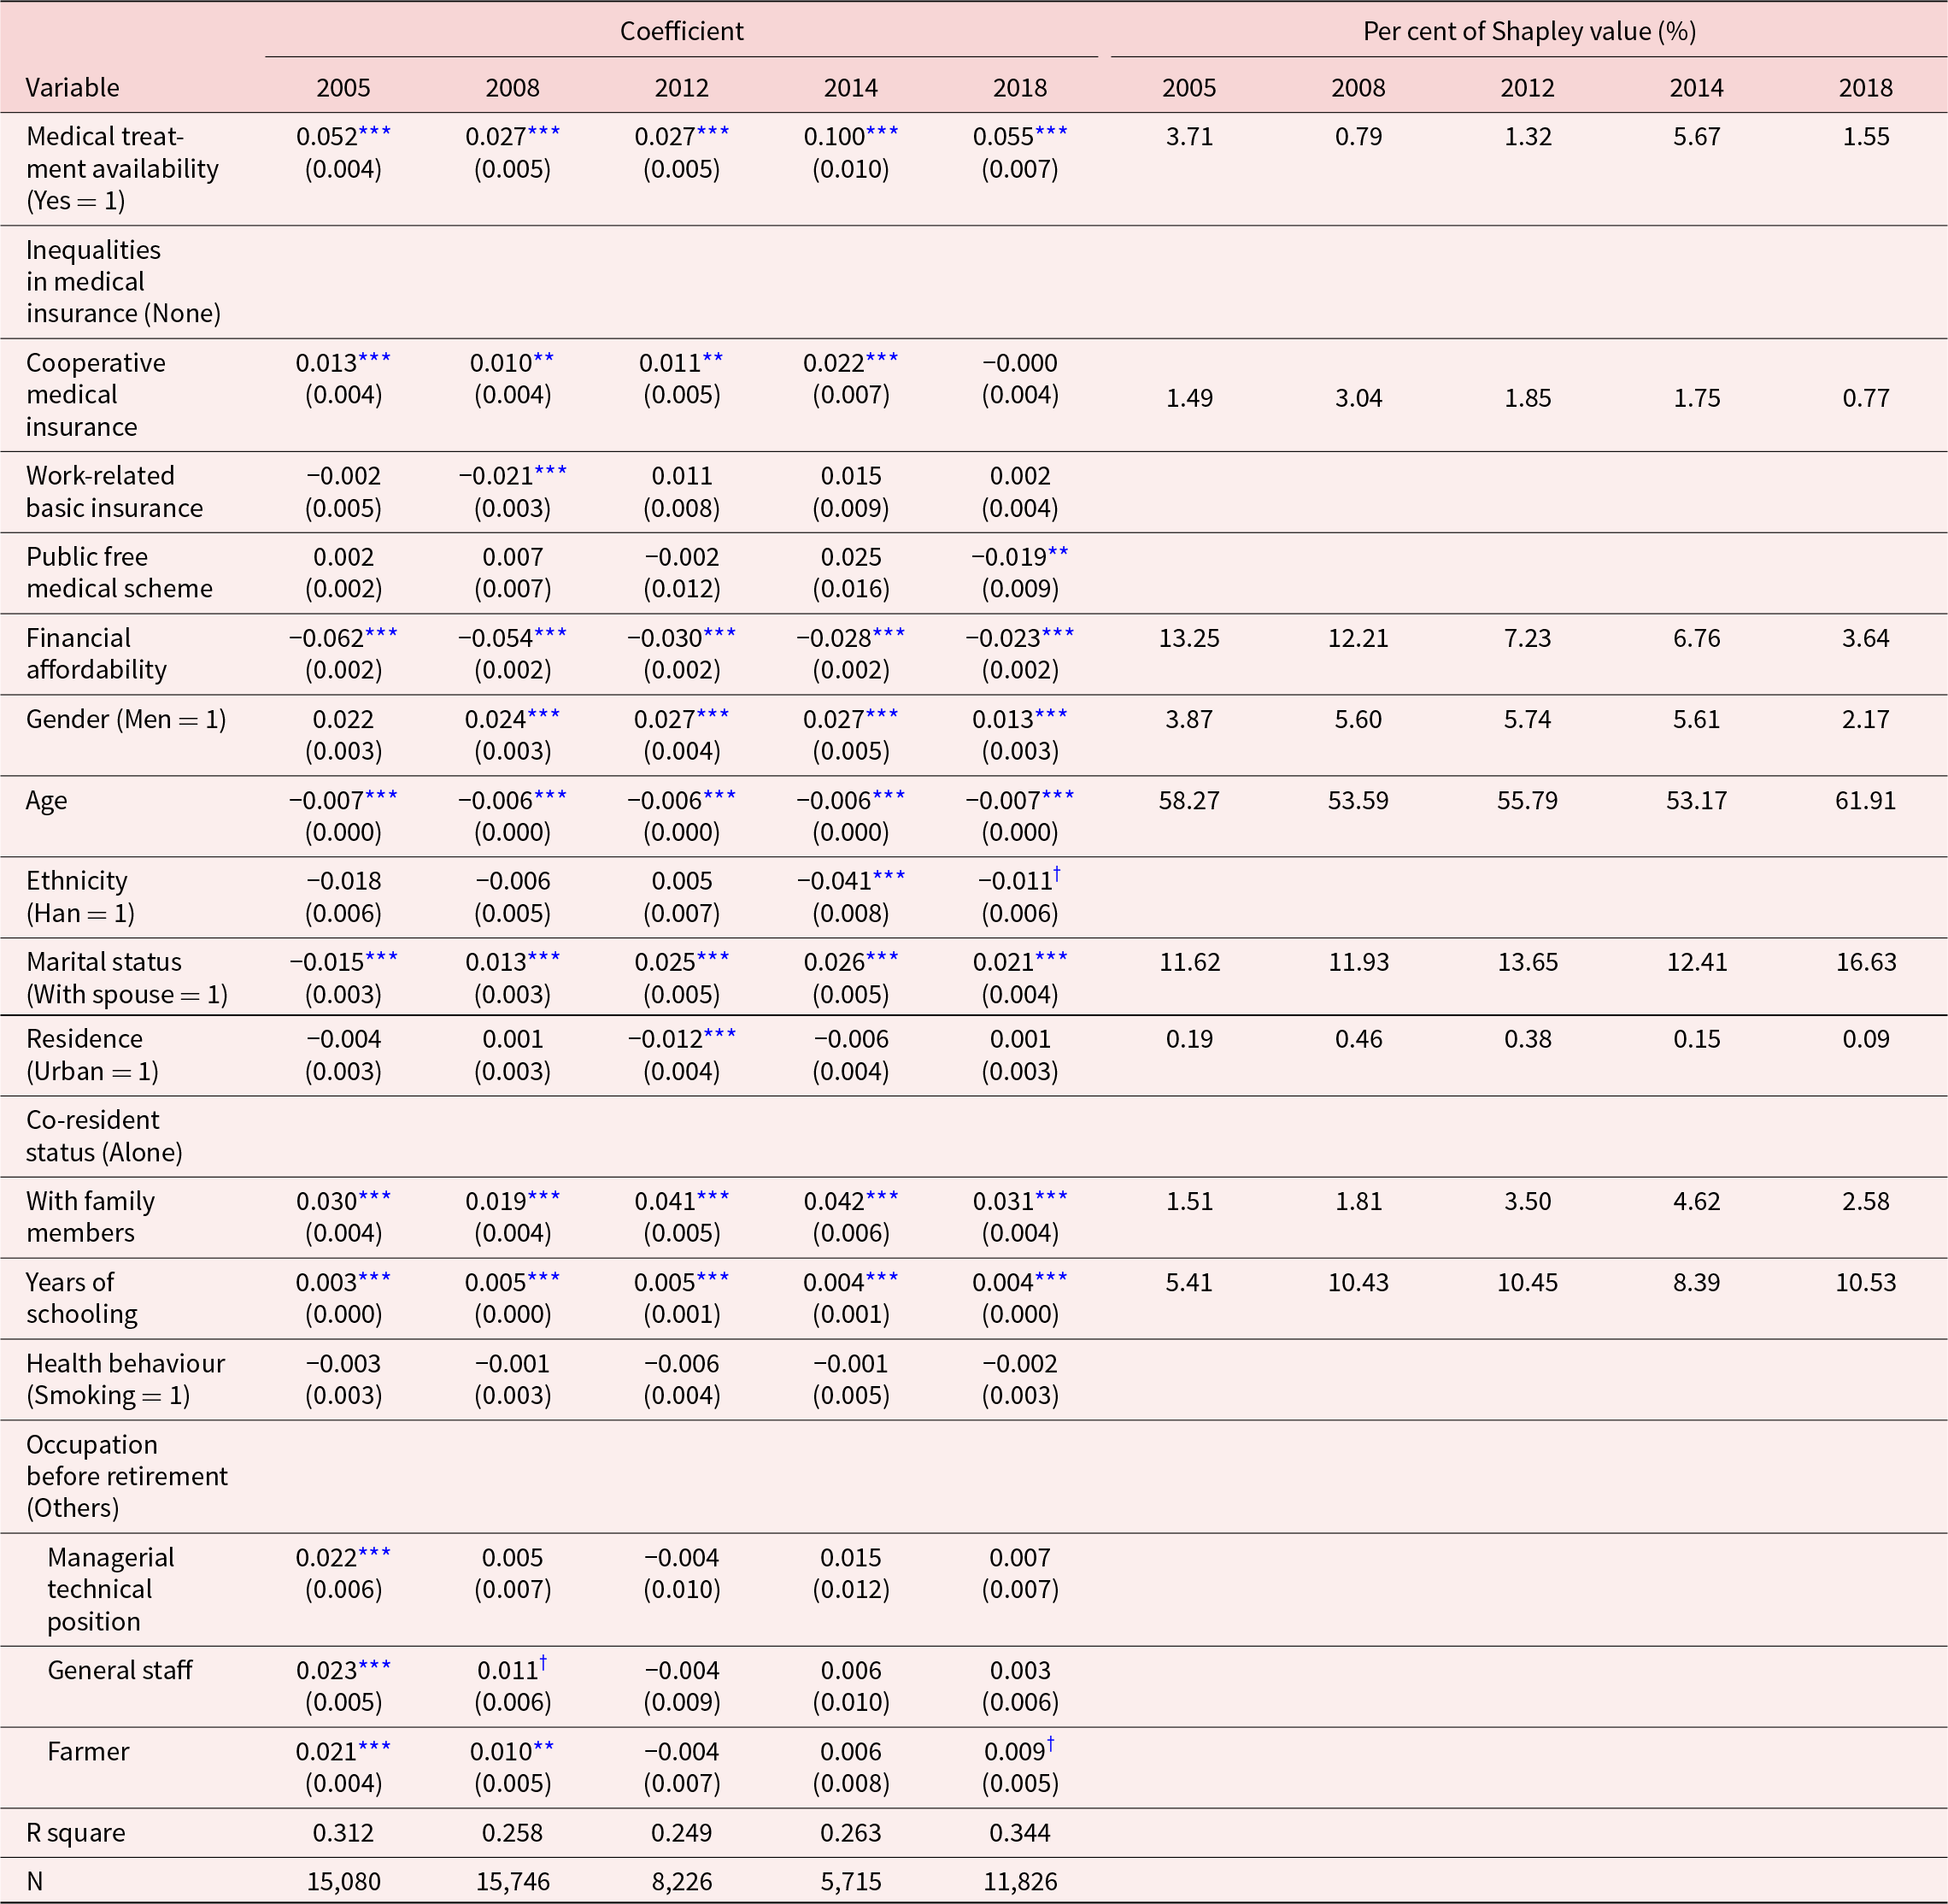
We examined the association between HA and health inequality under the control of several individual variables, forcing all variables into the ordinary least squares (OLS) regression model. All their variance inflation factors (VIF), in all models, were less than 2.5, indicating no multi-collinearity; therefore all variables were accepted. Table 7 shows the regression coefficients and the Shapley value percentages by wave.
Determinants of health status and Shapley composition by wave

Note: Significant levels:
† p < 0.1,
** p < 0.05,
*** p < 0.01.
The OLS regression results on the left suggest that most variables are significantly associated with the health status of older people, but with some exceptions in several waves, including ethnicity, residence and health practices, while the occupational types before retirement significantly affected health status in 2005, but not in the following waves. In brief, men, younger older people, couples and those with better education and living with their family members were likely to be in better health.
Regarding the three HA indices, medical treatment availability was positively associated with older people’s health, while financial affordability (the proportion of medical expenditure related to household income per capita) had a negative impact on health status. The coefficients of medical treatment availability increased from 2008 to 2014, suggesting a growing marginal effect on health inequalities, whereas financial affordability appeared to have a decreasing impact. The effect of inequalities in medical insurance is relatively uncertain and marginal. In general, older people with more generous medical insurance are in better health, although this does not hold for those covered by work-related basic insurance and the free public medical scheme. This could be a function of low sample coverage in these groups. Most individual variables were significantly associated with health status.
Given the limited number of independent variables operating the Shapley syntax, we selected the variables with statistical significance in the Shapley process, which is reported on the right side of Table 7. It reveals the contribution of each variable or variable group (including control variables) to health status. The total contribution of HA ranged from 6 to 20 and was shrinking. Specifically, financial affordability played a dominant role in determining older people’s health, followed by medical treatment availability and medical insurance inequality. It is particularly notable that the marginal contribution of financial affordability decreased year by year from 13.25 per cent in 2005 to 3.64 per cent in 2018, which is consistent with the regression coefficients. The contributions of medical insurance schemes significantly increased before 2008 and then decreased to 0.77 in 2018.
Individual characteristics dominated inequalities in health among older people: age, marital status and educational attainment being the key factors. These three factors accounted for approximately 80 per cent of the health variance, which peaked at 89 per cent in the last CLHLS wave. Given the large preponderance of the oldest old in the CLHLS, age was bound to loom large in health determination. Thus, the contribution of age would be smaller when applied to the whole population. Years of schooling, which is related to socio-economic position, played an increasing role in determining health in later life.
Discussion
Inequalities in health among older people have received increasing research and policy attention. Very few studies have mapped their trends in a single country, particularly a developing one which has undergone a radical social and economic transformation. This paper investigated trends in health inequalities among older people, over 15 years, using a large longitudinal survey. Unusually, the impact of HA on inequalities in health was given special attention, given the unprecedented advances in China’s social welfare policy. We have partly confirmed previous research and made some important new contributions.
First, we assessed the trend in health status among people aged 65 and over in China, using the QWB index. The health of older Chinese people has been steadily enhanced in recent decades. Results are in line with most studies with the same index (Du and Wang Reference Du and Wang2013) and those using other ones, such as activities of daily living (ADLs) (Xue Reference Xue2015). For example, Du and Wang (Reference Du and Wang2013) confirmed an increasing QWB from 0.73 to 0.80 from 2000 to 2005. The increasing life expectancy of older Chinese people also reflects their improved health status. Life expectancy at 60 in China has made a remarkable increase from 18.43 years to 21.06 years. These achievements may be attributed to both socio-economic development and improved medical services (Pan et al. Reference Pan, Fan, Yang and Deng2019).
Second, moving from absolute health status to health inequalities, we were not surprised to find pro-rich inequalities in China indicating that older people with higher socio-economic positions are likely to be in better health (Chen and Pan Reference Chen and Pan2020). This result is aligned with most previous studies, including both those with the same health measures (Cai and Zhang Reference Cai and Zhang2020) and those using other indicators such as ADLs (Xue Reference Xue2015) and self-reported health (Ruan and Chen Reference Ruan and Chen2017). Despite this, health inequalities among older people have narrowed markedly since 2008. The CI of the total older population in 2014 fell to 0.01 and persisted until the last wave in 2018, accompanied by a similar trend for each subgroup. This result was supported by Xue (Reference Xue2015) but contrasts to findings from Du and Wang (Reference Du and Wang2013). Xue (Reference Xue2015) confirmed a reducing trend of health inequality among older people aged 60 and over, using ADLs, including 15 items such as bathing, dressing, toileting and generalised entropy (GE) based on the CHNS dataset, while Du and Wang (Reference Du and Wang2013) argued that QWB inequality among older people increased between 1998 and 2008. Moreover, inequalities in health between subgroups, for example older men and women, have diminished remarkably. These findings appear counter to most of the contemporary literature, which portrays a negative trend in health inequality (Gong et al. Reference Gong, Walker and Shi2007; Huang Reference Huang2012). This discrepancy is partly attributable to time differences between studies and varied measurement indicators. Most of the literature reporting growing health inequalities employed data collected before 2010 (Du and Wang Reference Du and Wang2013). A representative assessment of the performance of China’s health system at the turn of the century was that it was failing to secure significant improvements in health, probably due to the strong neo-liberal orientation of policy in the early reform era (Gong et al. Reference Gong, Walker and Shi2007). Another important reason is differences in the measurement tools employed. For example, Yang (Reference Yang2020) compared prevalence rates of chronic diseases and visits to a doctor in a 14-day period among subgroups with different educational attainment, between 1993 and 2013, and concluded that health inequalities were growing. However, those two indicators are not representative and may have been biased by China’s epidemiological transition from the dominance of communicable to non-communicable diseases (Shi et al. Reference Shi, Gu and Fu2020).
We then investigated a set of determinants of health and health inequality. Several essential factors have been identified. First, HA has been positively associated with older people’s health, which accords with many previous studies (Pan et al. Reference Pan, Fan, Yang and Deng2019). The contribution rate of HA was approximately one-fifth of the total, although it is uneven among subfactors. Financial affordability plays a dominant role in improving health status, followed by medical treatment availability and medical insurance. Their contribution rates in 2015 were 0.133, 0.037 and 0.015, respectively. The dominant role of financial affordability in health was confirmed by Chen and Pan (Reference Chen and Pan2020). Older people with lower financial affordability have a higher probability of being excluded from health-care services. In contrast, the contribution of medical insurance to health is much less than financial affordability. One reason may lie in the validity of the variable, which, merely measuring the type of medical insurance schemes, is unable to capture the actual utilisation of health-care services (Guo and Gu Reference Guo and Gu2020). Therefore, this variable is unlikely to distinguish the potential uneven effects among medical insurance. Another reason may be the increasingly equitable medical insurance system. As mentioned in the background section, despite its stratification, the medical insurance system is much more equitable than China’s pension system. Most disadvantaged groups, including farmers and urban residents with precarious jobs, have been covered by medical insurance. The health-care availability gaps among beneficiaries from different medical insurance schemes have been greatly diminished.
But, at the same time, the marginal contribution of HA to health equity has weakened gradually since the inequalities in service accessibility among older people have decreased, the contribution of which has declined to less than 6 per cent. In other words, both health status and inequality among older people are increasingly dominated by individual and social determinants, such as age/generation, marital status and education, as documented by the regression analyses, which together constitute over 80 per cent of contributions. These findings are supported by Ai (Reference Ai2022). He argued that social welfare policies, including health policies, and individual characteristics have heterogeneous impacts on health in different development states. In the period of underdevelopment when the social welfare system is fragmentary, health-related policies disproportionately affect health outcomes; then individual characteristics take over with increased economic development and improvements in the health-care system (Ai Reference Ai2022). The gradual marginal effect of HA suggests a progressive health-care system.
It is surprising that the previously distinct inequality in health between urban and rural areas was not found, which departs from the findings of Du and Wang (Reference Du and Wang2013) but is in line with Zhao (Reference Zhao2017). This may be attributed to the health variable used in this study, QWB, which incorporates both objective and subjective elements. A mixed result of health gaps between rural and urban residents has been well demonstrated. The morale of rural residents is higher than that of their urban counterparts, while their physical health is the opposite (Clayton et al. Reference Clayton, Dudley, Patterson, Lawhorn, Poon, Johnson and Martin1994; Jun et al. Reference Jun, Kim, Park and Oh2002).
Limitations
This study is subject to several limitations. First, it was limited by the dataset. The average age of the sample is over 85 years, which results in an underestimation of health status and inequalities among older people while overestimating the contribution of individual characteristics, especially age. We conducted alternative regressions with sub-samples aged 85 and under, and 75 and under. The result from Wave 8 in 2018 shows that the contribution of age decreased to 42.75 and 11.37, respectively, which verifies the validity of this study. Second, like most longitudinal surveys, approximately one-third of the sample in the CLHLS waves is re-interviewed in any two adjacent surveys. For example, 3,463 out of the 12,411 people in Wave 8 were also interviewed in Wave 7. Thus, there is a potential systematic bias in sample selection: older people in better health may be more likely to be re-interviewed more than once given their higher accessibility. Thus, health status may be overestimated. Third, it is necessary to test the effectiveness of the indicators making up the HA index in future research if a suitable dataset is available. We chose the availability of medical treatment when in serious ill-health as the indicator of health-care availability. Over 90 per cent of the sample responded yes, which could be an overestimate. Alternatively, time expenditure or distance to the nearest medical facility is the most frequently used (Tanser et al. Reference Tanser, Gijsbertsen and Herbst2006; Wang Reference Wang2012). This was used in the latest CLHLS wave in 2018 but was absent from previous ones.
Conclusion
We started this investigation by using previous studies to identify knowledge gaps and key research questions. The analysis then proceeded to examine the empirical story revealed by analysis of the CLHLS dataset. Along the way, various theories relevant to this investigation have been discussed and the importance of grounding the conceptual model in the socio-gerontological theory of political economy was emphasized. This opens the way for further empirical testing of the model by gerontologists. The research reported here contributes broadly to the study of health inequality and social policy in several ways, two of which must be highlighted. First, the social determinants of health concept was strongly supported but, in a development context, this concept requires modification to account for the diminishing impact on inequality of health-care policies with economic and social policy development. This does not mean that health-related policies are not essential to health improvement but suggests a transition in such policies towards a more modest role. This finding has relevance for countries in the less developed Global South seeking to prevent or ameliorate health inequalities in old age. Second, as socio-economic characteristics grow in significance, as health policy–related factors subside, the importance of the life course comes into play more strongly. Thus, while the social determinants perspective remains a powerful explanation for health inequalities among older people in later life, it requires modification to take account of both the development context and the accumulation of advantages and disadvantages over the life course. This suggests that inequalities in later life cannot be eliminated by health policies targeted solely at people in later life. Health status in old age is an outcome of accumulated advantages/disadvantages in earlier life and becomes more irreversible with age. This finding has clear policy relevance within China but, also, far beyond it, because the life course is commonly neglected in strategies to reduce health inequalities.
As for China, the findings raise questions about the focus of its healthy ageing agenda. Undoubtedly, China has made remarkable progress in HA and health improvement. Most older people are now covered by health insurance. The priority of the healthy ageing agenda in the future is to enhance the equity of health policies, particularly among regions, occupations, age groups and social classes. But the prominent contributions to inequality of demographic and social factors indicate that healthy ageing policies should target health improvements across the whole life course.
Financial support
This work was supported by the Philosophy and Social Science Planning Office of Guangdong Province (grant number: GD23YSH07).
Competing interests
The authors declare no competing interests.
Ethical standards
This study used secondary data from the Chinese Longitudinal Healthy Longevity Survey (CLHLS) conducted by Peking University..
Appendix
Quality of wellbeing elements, calculating weights and corresponding items in the CLHLS

Data source: Kaplan and Anderson (Reference Kaplan and Anderson1988).
Note: We just selected 4 out of 23 items in terms of CPX which match the questions of the CLHLS.