Introduction
Hate has been a persistent problem across human history, and it has become an ever more pressing issue in the wake of the COVID-19 pandemic, which has sparked a wave of anti-foreigner, anti-Muslim and antisemitic hate (UN, 2020). Despite the relevance of this policy area, the ability of states to create effective policies to address hate crimes, hate incidents and hate speech is constrained by a general lack of coordination among the different governmental and non-governmental stakeholders that contribute to measuring and responding to hate. This article aims to develop a comprehensive conceptual framework and a systematic procedure to map the diversity of responses to hate, and to test it in the context of Australia. This framework will provide a template to assist scholars and policymakers to orient research and policy efforts.
There is a diversity of government and non-government responses to the ecosystem of hostilities against minority communities, ranging from criminal acts (such as physical aggression and property damage) to on- and offline hate speech, to micro-aggressions (such as verbal abuse). These responses are mostly disconnected, uneven and fragmented, and can be likened to a jigsaw puzzle. The legislation regulating behaviours motivated by hate or displaying a hate element is the underpinning of all government responses, and it includes civil and criminal laws, sentencing laws, and anti-discrimination and human rights laws. Hate crime laws are underdeveloped in most countries globally, they are unevenly applied and tend to protect some communities more than others (Sheppard et al., Reference Sheppard, Lawshe and McDevitt2021). All laws are historically and culturally contingent, and in many cases driven by political agendas (Perry, Reference Perry2001). For example, Lowe (Reference Lowe2020) found that in Australia, Canada, New Zealand, the UK and the US, laws regulating Islamist-inspired hate speech are much harsher than laws regulating far-right hate speech. Schweppe (Reference Schweppe2021) notes that the definition of protected characteristics in hate crime legislation reflects the ability of some vulnerable groups to advocate for their protection and the inability of others to be heard: a noticeable example of the latter are the homeless, who are often absent from most lists of hate-crime-protected characteristics.
Laws inform the response of different government agencies that deal with specific types of hate behaviours: for example, law enforcement agencies generally respond to hate motivated behaviours regulated by criminal law, and human rights agencies generally respond to hate motivated behaviours regulated by civil law (Bell, Reference Bell2002). Each government agency tends to run its own awareness and outreach programs, and to have its own data collection system, and data is rarely shared among different agencies. Victim support services sometimes have dedicated projects for hate crime victims, but they tend to service unevenly different communities who are the target of racism, homophobia, ableism, and other community-specific forms of hate (Dunn et al., Reference Dunn, Atie, Kennedy, Ali, O’Reilly and Rogerson2016; Owen et al., Reference Owen, Burke, Few-Demo and Natwick2018).
Non-government organisations can play a key role in providing a variety of responses to hate, too. For example, watch-group organisations, such as the Anti-Defamation League and the Southern Poverty Law Centre in the US, collect third-party reports of criminal and non-criminal incidents from victims and witnesses (Vergani et al., Reference Vergani, Navarro, Freilich and Chermak2020). These reports are key to advocacy and community awareness programs, they contribute to hate prevention and pressure policymakers into strengthening protections for the target communities. Non-government organisations can also engage in responses to hate behaviours ranging from community education to victim support services (Kees et al., Reference Kees, Iganski, Kusche, Swider and Chahal2016). Although in policy fields such as countering and preventing violent extremism there have been efforts to coordinate and harmonise government and non-government responses via the creation of National Action Plans, policy responses to hate motivated behaviours such as hate crime and hate speech have been under-researched and there are no attempts to theorise a possible harmonisation of these responses (Wulandari, Reference Wulandari2019; Vergani, Reference Vergani2021).
The Australian case study
Australia is a relevant case study because it presents key issues that are common to many other country contexts, especially in North America and Europe. Firstly, the laws that protect Australians from different forms of hate across different states and territories of the federation are exceptionally diverse and often inconsistent, which is a common problem with federal countries like the United States (Mason et al., Reference Mason, Maher, McCulloch, Pickering, Wickes and McKay2017; Ashley, Reference Ashley2018; Lowe, Reference Lowe2020). Relevant civil laws include equal opportunity and human rights legislation, such as the Equal Opportunity Act 2010 (which protects from discrimination, sexual harassment and victimisation) and the Victorian Racial and Religious Tolerance Act 2001. There are significant differences across Australia’s states and territories in terms of what types of hateful conduct is covered by legislation: in 2018, New South Wales introduced legislation that is unparalleled in other states and territories, the Crimes Amendment (Publicly Threatening and Inciting Violence) Bill 2018, which outlaws publicly threats or inciting violence towards a person or a group on the grounds of race, religion, sexual orientation, gender identity or intersex or HIV/AIDS status. All laws that regulate hate crime in Australia have been criticised for being too narrow (that is, for focusing only on some protected characteristics, leaving many groups without protection), and for having a threshold of proof that is too high (Mason, Reference Mason2019).
Secondly, in Australia, data collection on hate crime, hate incidents and hate speech is piecemeal and insufficient, and affected by severe under-reporting due to barriers experienced by victims and witnesses (Vergani and Navarro, Reference Vergani and Navarro2021). Police data is the only official record of hate crime, but it is collected only in a few Australian states and territories, and data quality is limited due to significant recording and coding inconsistencies and biases (Mason, Reference Mason2019). In New South Wales, the New South Wales Police Force recorded thirty-four reports of hate crime a month on average between 2007 and 2017, with hate crimes targeting racial, ethnic and religious minority groups making up the vast majority of reports (81 per cent), followed by hate crimes against LGBTIQ+ (lesbian, gay, bisexual, transgender, intersex, queer) communities (14 per cent) (Mason, Reference Mason2019). To complement police reports, surveys remain a key source of data on the prevalence of hate crime, hate speech and hate incidents, although Australia does not have a longitudinal victimisation survey that looks at hate crimes. Occasionally, researchers collect survey data about hate behaviours, mostly using different and inconsistent measurement tools. For example, a survey with a representative sample of the Victorian population (N = 4,019) found that about 26.6 per cent of the sample (N = 1,069) reported having experienced discrimination in the last twelve months, with higher proportions among Indigenous respondents (69.6 per cent), Muslims (36.1 per cent), Indians (35.9 per cent), and East Asians (33.8 per cent) (Dunn et al., Reference Dunn, Sharples, Diallo, Derbas, Vergani, Mansouri, McGarty, Paradies and Elias2020). According to a survey commissioned by the eSafety Commissioner, one in seven Australians report having been the target of online hate speech in the twelve months to August 2019, with people identifying as Indigenous and LGBTIQ+ experiencing online hate at more than double the national average (eSafety Research, 2020).
As in most countries in North America and Europe (as well as in other parts of the world; Vergani et al., Reference Vergani, Navarro, Freilich and Chermak2020), some community watch-groups in Australia produce reports of hate incidents (which include hate crime and hate speech) to document the prevalence of hate behaviours in their communities. For example, the Executive Council of Australian Jewry (ECAJ) has compiled the Report on Antisemitism in Australia since 1990. The report is based on antisemitic incidents reported to the ECAJ or other Jewish state-based organisations by targets and witnesses (Nathan, Reference Nathan2019). The Islamophobia Register Australia has been producing an Islamophobia Report, based on target and witness reports, since 2014 (Iner et al., Reference Iner, Asquith, Ip, Islam, Mason, Vergani and Zayied2019). During the COVID-19 pandemic, a community organisation of Asian Australians started collecting community reports of incidents of racism (Asian Australian Alliance, 2020). All these groups use different data collection methods and inclusion criteria for incidents in their reports, which makes their data impossible to compare across communities.
Finally, in Australia a range of identities are the target of hate behaviours, which is a common issue in all multicultural democracies. Racial and ethnic minorities are one of the main targets of hate in Australia (Mason, Reference Mason2019). In particular, hate against Aboriginal and Torres Strait Islander people is the oldest form of hate in Australia, which is motivated by a range of beliefs about Indigenous people being lazy, violence prone, unintelligent, and having unhealthy habits (Paradies et al., Reference Paradies, Harris and Anderson2008; Priest et al., Reference Priest, Slopen, Woolford, Philip, Singer, Kauffman, Mosely, Davis, Ransome and Williams2018). Racism against people of African and Asian descent in Australia is similarly well documented (for example, Dunn et al., Reference Dunn, Forrest, Burnley and McDonald2004). Although hate against religious minorities (e.g. Islamophobia, antisemitism) is often categorised as separate from hate of racial minorities (e.g. racism), research shows that offenders might be driven by a mix of hostile attitudes towards culture, heritage, language, skin colour, immigration, politics, and terrorism (see, for example, Dunn et al., Reference Dunn, Atie, Mapedzahama, Ozalp and Aydogan2015). Hate against the LGBTIQ+ community is also well documented in Australia, mainly using terms such as homophobia and transphobia (Flood and Hamilton, Reference Flood and Hamilton2005). Victimisation surveys among LGBTIQ+ people in Australia indicate that between 75 per cent and 90 per cent of respondents have experienced hate due to their sexuality or gender identity, commonly in the forms of harassment, bullying and abuse (Leonard et al., Reference Leonard, Mitchell, Patel and Fox2008; AHRC, 2015; Hillier et al., Reference Hillier, Jones, Monagle, Overton, Gahan, Blackman, Mitchell and La Trobe2010). Although less prominent in public discourse, other groups, including women, people with disability, people experiencing homelessness, or the elderly, are well-documented targets of hatred (D’Souza et al., Reference D’Souza, Griffin, Shackleton and Walt2018; Oakley and Bletsas, Reference Oakley and Bletsas2018; Johnson and West, Reference Johnson and West2020; Lichtenstein, Reference Lichtenstein2021). In Australia, mapping responses to hate behaviours such as hate crime, hate speech and hate incidents is hindered by the diversity and inconsistency of legislative frameworks, the fragmented data on the prevalence of hate behaviours, and the use of different terms to describe hate against different target groups (e.g. antisemitism, Islamophobia, homophobia, ableism, etc.). This article proposes a new conceptual framework and a systematic procedure to map anti-hate efforts within a country, with the aim to map gaps and needs. The next sections will present our conceptual framework, and outline the data collection procedure and the analysis plan. Subsequently, we will present the results of our analysis in the Australian context.
Conceptual framework and systematic procedure to map anti-hate efforts
At the core of the conceptual framework is the notion of hate, which is the key attribute of the behaviours captured by the terms hate crime, hate incidents and hate speech. Hate has been the object of much scholarship in the social and psychological sciences: Allport (Reference Allport1954) defined hate as a stable emotion of extreme dislike, as opposed to anger, which is a transitory emotional status. Fromm (1973/Reference Fromm1992) proposed a well-known distinction between two types of hate: rational hate, which has a rational basis and is aroused by an attack on freedom or on people we love; and character-conditioned, which is irrational and, for example, was made use of by the Nazis in recruiting their members. Both Fromm and Allport suggest that prejudice underpins the generation of hate, both in its rational and irrational forms. Sternberg and Sternberg (Reference Sternberg and Sternberg2008) further specifies the nature of hate by identifying three core dimensions: negation of intimacy (disgust), passion (anger or fear in reaction to a perceived threat) and commitment (devaluation or diminution). According to Sternberg and Sternberg (Reference Sternberg and Sternberg2008), hate can be captured by both feelings and actions, but feelings might not always translate into action, and actions may or may not represent genuine feelings. For scholars in the social sciences, hate is more than an emotional arousal: it is motivated by a worldview that reflects the willingness to exert power, and historical notions of hierarchies of race, religions, sexual and gender identities, bodies and other characteristics (Perry, Reference Perry2001). The damage of hate crime extends beyond the immediate targets and offenders: oftentimes, the specific victim is almost immaterial and interchangeable, and the crime is more a symbolic act aimed at the people watching than an instrumental crime (Perry, Reference Perry2001).
Hate underpins a variety of criminal and non-criminal behaviours, which include: hate crime, hate speech, and hate incidents. In this article, we define a hate behaviour as any behaviour motivated in whole or in part by bias, or exhibiting a marker of bias. Hate behaviours include both lethal and non-lethal violence against people and properties. Hate crimes are usually referred to as behaviours regulated by criminal law (ODIHR, 2009), although some researchers include also non-criminal acts under the umbrella of hate crime (for example, Hardy, Reference Hardy2019). Practitioners often use the term hate incident to indicate any malicious behaviour motivated in whole or in part by bias that does not meet the threshold for a crime (ADL, Reference Anti-Defamation2016). However, other definitions of hate incident may capture all – criminal and non-criminal – malicious behaviour motivated by bias (Sadique et al., Reference Sadique, Tangen and Perowne2018). Hate conduct is a term utilised often in hate crime statutes and legislation to indicate any prejudice-motivated behaviour (Pezzella, Reference Pezzella2016). The terms hate incidents and hate conduct may thus encompass both criminal and non-criminal behaviours.
The use of terms such as hate incidents and hate conduct, which include both criminal and non-criminal behaviours, has advantages and disadvantages. On the one hand, it is important to distinguish between criminal and non-criminal incidents for victims, policymakers and criminal justice systems practitioners to devise the most appropriate response. On the other hand, the thresholds of criminality are culturally and socially constructed, and from a sociological point of view, even non-criminal incidents such as denying a job or an apartment to someone because of their perceived identity might be legal in some jurisdictions, but still a violation of basic human rights and a hate behaviour that harms both the immediate victim and their communities (Perry, Reference Perry2001).
Hate speech can be defined as speech that implicitly or explicitly stigmatises an out-group and depicts them as undesirable and a legitimate object of hostility (Parekh, Reference Parekh, Herz and Molnar2012). When hate speech takes place online, it is often referred to as cyber-hate or online hate (Costello et al., Reference Costello, Hawdon, Bernatzky and Mendes2019), or – when targeting a specific group – referred to with terms like cyber-racism (Bliuc et al., Reference Bliuc, Faulkner, Jakubowicz and McGarty2018). Online hate is inherently difficult to regulate by nation states because of the global nature of the internet, which is a key barrier to the policing and prosecution of online hate speech across national boundaries. Depending on the use of the term and the legislative context, hate speech may constitute a criminal offence, and therefore overlap with the concept of hate crime. When hate speech captures acts that do not constitute a criminal offence, it overlaps with the concept of hate incident.
There are multiple explanations why there is a proliferation of terms used to capture the behaviours defined by the concepts of hate crime, hate incidents and hate speech. First, many scholars and practitioners do not want to use the term hate to describe the prejudice motivation of the behaviour, because of its fundamental ambiguity (Perry, Reference Perry2001). Hate is an emotive and conceptually ambiguous label that can mean different things to different individuals and communities, and for this reason many organisations decided to adopt a different connotative term to decribe the prejudice motivation of the behaviour. For example in the Australian context, police, government and communities tend to avoid using the term hate crime: rather, in the state of Victoria, most stakeholders use the term prejudice-motivated crime (Mason et al., Reference Mason, Maher, McCulloch, Pickering, Wickes and McKay2017), and in New South Wales they use the term bias crime (Mason, Reference Mason2019). A second issue is the conceptual ambiguity around the characteristics of targets of hate (Perry, Reference Perry2001). Most definitions embrace a list of characteristics that identify groups that have historically been subject to discrimination and hate, such as race, religion, sexual orientation, transgender status, and disability. Others also include homelessness status, age, sex, body image, among others. This reflects a proliferation of terms used to capture the activities and target populations of organisations tackling hate: examples are ‘isms’, such as sexism, racism, ageism, ableism, antisemitism, and ‘phobias’, such as Islamophobia, sinophobia, homophobia, transphobia, and xenophobia, among others. These terms are used broadly to refer to both negative attitudes and prejudice-motivated malicious behaviours against an out-group, which include hate crimes, hate incidents and hate speech.
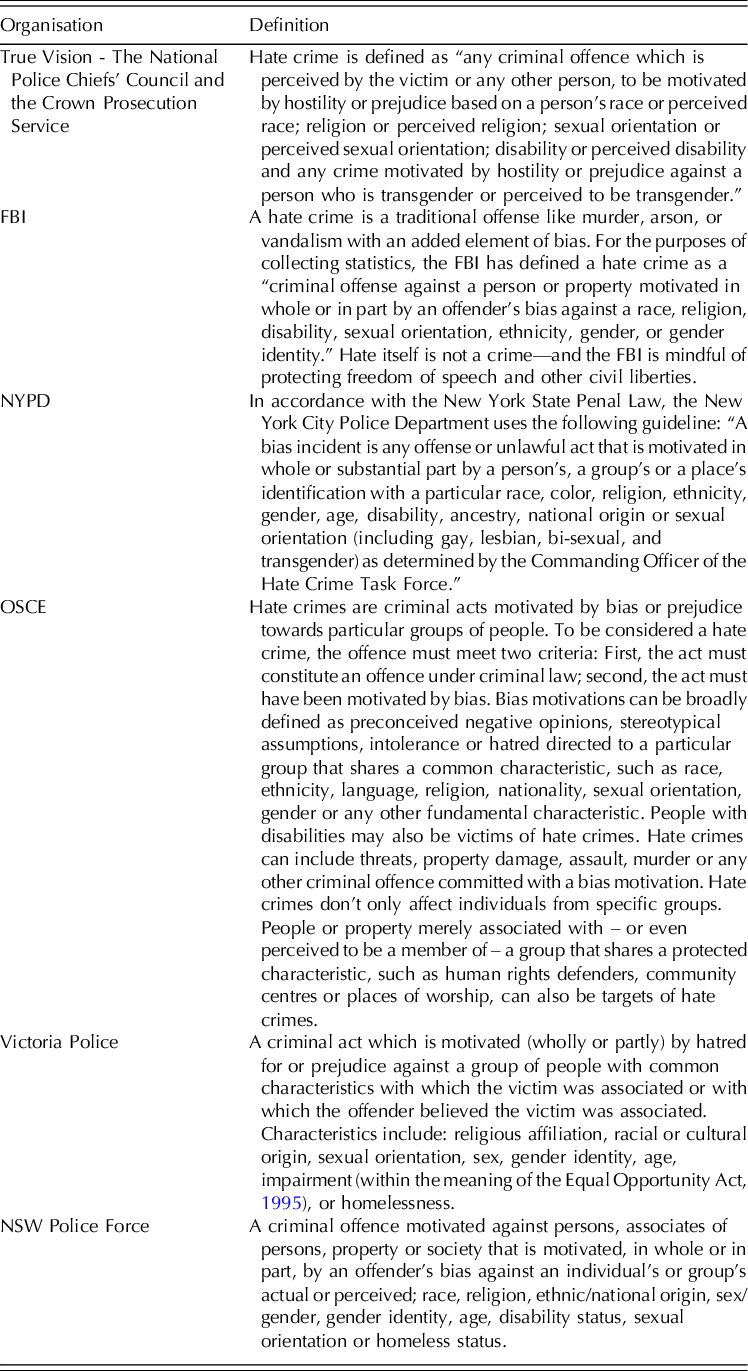
To display the diversity of terms used to define prejudice motivation, behaviours and protected characteristics, Table 1 provides a short list of selected definitions of hate crime used by governmental organisations in Europe, Australia and North America. By analysing the definitions in Table 1, we propose that there are at least five blocks that make up any definition of a hate behaviour, which are: 1- the attribute defining the behaviour (e.g. hate, prejudice-motivated, bias); 2- the noun defining the behaviour (i.e. incident, crime, speech); 3- the noun defining the target of hate (e.g. a person, a property, an organisation); 4- the indicators qualifying the behaviour (e.g. a target believes, a witness believes, any person believes, there is evidence that); 5- the protected characteristics (e.g. race, religion, nationality, gender, trans status, disability, homeleness status). Understanding how the five blocks underpin the definition of hate behaviours is important to devise a search strategy and systematic procedure to map anti-hate efforts in a country, because it points to potential variations in language and terminology that must be considered.
Selected definitions of hate crime used in Europe, Australia and North America.

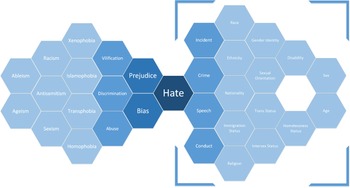
Figure 1 visualises the variety of concepts relevant to our conceptual framework. The notion of hate is at the centre of the figure. To its left are concepts of prejudice and bias, which are key elements of our understanding of hate. To their left are terms that feature in relevant pieces of legislation across Australian states and territories, such as vilification, discrimination and abuse. Further to the left is a non-exhaustive list of terms that capture forms of hate against specific target groups: racism, ableism, ageism, antisemitism, Islamophobia, xenophobia, sexism, transphobia and homophobia. On the right side of the figure is the particular focus of this article, hence the frame. We distinguish between hate incident, hate crime, hate speech and hate conduct as four manifestations of hate. Further to the right is a list of characteristics that are protected in relevant federal and state legislation.
A visualisation of the theoretical framework underpinning the mapping of policy responses to hate in Australia.

Methods and procedures
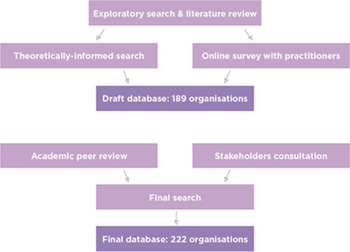
The aim of this section is to operationalise our conceptual framework into a systematic procedure to map anti-hate efforts in the Australian context in order to identify gaps and needs in this policy area, and consequently orient governmental and non-governmental resources where necessary. The proposed systematic procedure includes a mixed-methods, inductive and iterative exploratory approach that included three sets of Google searches, a literature review, an online survey, consultations with key stakeholders and an external review by a reference group of academics. The steps are detailed in Figure 2.
A graphical overview of the data collection process.

The first step of our mapping of anti-hate efforts in Australia was an exploratory search using Google. It was based on a list of thirty keywords we identified based on our understanding of the field, and a selective review of relevant Australian articles on the topic (see, for example, Poynting and Noble, Reference Poynting and Noble2004; Asquith, Reference Asquith, Bartkowiak-Théron and Asquith2012; Benier et al., Reference Benier, Wickes and Higginson2016; Wickes et al., Reference Wickes, Pickering, Mason, Maher and McCulloch2016; Benier, Reference Benier2017; Mason, Reference Mason2019; Mason and Moran, Reference Mason and Moran2019). The keywords were based on our focus on hate crime, hate speech and hate incidents in Australia, as well as on related concepts, such as the various ‘isms’ and ‘phobias’ – for example, ageism, ableism, (anti) racism, homophobia and transphobia. These keywords feature on the left side of our conceptual framework (see Figure 1). For each keyword, we explored at least four pages of search results for relevant results. The number of pages that we explored for each search was based on ad-hoc observations of the number of potentially relevant search results on each page; once we started to observe that a page did not contain any potentially relevant search results, or that particular search results were the same as those we had obtained through previous searches, we regarded that search as complete and moved on to the next one. The number of pages explored ranged from four to ten. This first search allowed us to understand the range and diversity of activities and organisations operating in this field. This first, exploratory search allowed us to incorporate inductive bottom-up findings into our framework.
Our first exploratory search informed a larger systematic and inductive search based on our theoretical framework described in Figure 1. Using Google, we combined the term hate with terms indicating minorities (e.g. religion, race, ethnicity) and geographical markers (i.e. Australia and Australia’s eight states and territories). These keywords feature on the right side of our conceptual framework (see Figure 1). In total, we carried out 234 searches, exploring the first three pages of search results for relevant hits (representing thirty results per search). We decided to limit our review of search results to the first three pages in order to keep the overall number of search results for screening (a maximum total of 7,020 search results, including duplicates, across all 234 searches) manageable and feasible within the scope of our resources. In parallel with the second search, we designed an online survey for a selected group of government and civil society practitioners, asking them to name all the organisations and activities they knew of, related to different aspects of tackling hate in Australia. Between March and June 2020, we collected twenty-eight questionnaires. From these questionnaires, we extracted sixty-two organisations that fit our criteria. We then sent a draft database of 189 organisations that combined the results of the first two Google searches and the online survey for review to eight key experts in the field, including three academics, two government practitioners, and three civil society organisation practitioners with more than 10 years of experience. Their suggestions allowed us to include an additional thirty organisations in the database.
In parallel with the stakeholder consultations, we contacted three academics with expertise in researching hate and political violence, who agreed to review our theoretical framework and search strategy. They suggested adding five search terms: sexism, xenophobia, misinformation, disinformation and conspiracy theories. Following the consultations, we carried out a third and final search for combinations of the term ‘hate’ with each one of the additional search terms – sexism, xenophobia, misinformation, disinformation and conspiracy theories – and each of the nine geographical markers, resulting in a further forty-five searches. For consistency, we explored the first three pages of search results for relevant hits. We exclude the terms ‘misinformation’, ‘disinformation’ and ‘conspiracy theories’ from the present study because they are conceptually inconsequential (not all conspiracy theories are necessarily hateful or informed by hostility and prejudice towards people of visible difference), and empirically irrelevant, because using these terms we did not identify any relevant organisations in our searches that we had not already found. Only counting relevant organisations that led activities that ended in 2019 or later, we included 222 organisations in our final version of the database.
Inclusion/exclusion criteria
We adopted a narrow approach using a standard procedure to test whether the organisations that appeared in our searches explicitly focused on tackling hate: we searched the organisation’s website, where possible, for any of the words included in our theoretical framework to the left of centre (Figure 1). If any of these words appeared in relation to a current activity run by the organisation, we included it in our database. Otherwise, the organisation was excluded. This means that organisations running activities relating to inclusion, multiculturalism, harmony and dialogue, were excluded, although their activities could be seen as addressing hate. Similarly, we excluded mental health, youth and social services with clients from communities at high risk of hate victimisation unless they offered specialised services addressing hate behaviours or hate targets.
Coding
Our unit of analysis was organisations running activities that aim to tackle hate in Australia. For each organisation, we coded whether it was a governmental or non-governmental organisation, and if it belonged to a sub-category, including: police, human rights commissions, universities, other research institutions (for example, think tanks), legal services, health services, religious services, other social services, media, sport organisations, and museums (the list is non-exhaustive). To identify policy gaps and needs, we focused on three main dimensions: geographical coverage, target population, and focus area. First, geographical coverage was coded as federal, online, or the particular states and territories in which an organisation operates. Second, target population comprised the protected characteristic an organisation focuses on (racial and ethnic, religious characteristics, age, disability, homelessness status, sexuality, gender identity, trans and intersex status, or general, if covering all of these categories). In addition to protected characteristics, we recorded whether organisations targeted Aboriginal and Torres Strait Islander people, Jews, Muslims or Asian minority groups. Third, we coded three focus areas: awareness raising and education, victim support and data collection. Activities that primarily aim to raise awareness of and educate on specific issues relating to hate are diverse in the range of issues they seek to address, their target audiences and their scope. These activities included public messaging campaigns to raise awareness of a specific issue, submissions to governmental agencies to advocate for law reform, police force liaison officers and similar programs to improve relations with communities at high risk of victimisation, educational resources and training modules for schools, and training and professional development packages for organisations and businesses. Activities classified as victim support specifically assist people that have been victimised on the grounds of one or more protected characteristics. These activities include legal assistance, counselling and other mental health services, assistance services for reporting an incident to police or human rights organisations, and peer support services. They do not include general health, aged care or disability related services, including referral services, unless these specifically relate to experiences of hate victimisation. Activities classified as data collection gather data on various manifestations of hate. Data collection activities vary in terms of which manifestations of hate are recorded – criminal activities in the case of police forces, less severe discriminatory unlawful incidents as in the case of human-rights bodies, or any kind of incident targeted at particular minority groups as in the cases of the Islamophobia Register and antisemitism reports. The same organisation can engage in multiple focus areas.
Results
Our database included a total of 222 organisations running activities focusing on tackling hate in Australia. About three out of four of these organisations (76.6 per cent, N = 170) conducted activities focused on awareness and education, 33.3 per cent (N = 74) on victim support, and 27.9 per cent (N = 62) on data collection. About one in five (21.2 per cent, N = 47) were governmental organisations, and the remainder (78.8 per cent, N = 176) were non-governmental organisations. Among the governmental organisations, there were seven police forces, nine human rights commissions, and a range of other governmental departments and services, including federal, state and local governments. Among the non-governmental organisations, there were thirty-four universities, five research centres and think tanks, twenty-nine faith-based organisations, thirty-one organisations focusing on LGBTIQ+ rights, sixteen on disability rights, eight on elders rights, seven on Indigenous rights, and a range of other private sector organisations, including media, museums, legal services, and health services, among others.
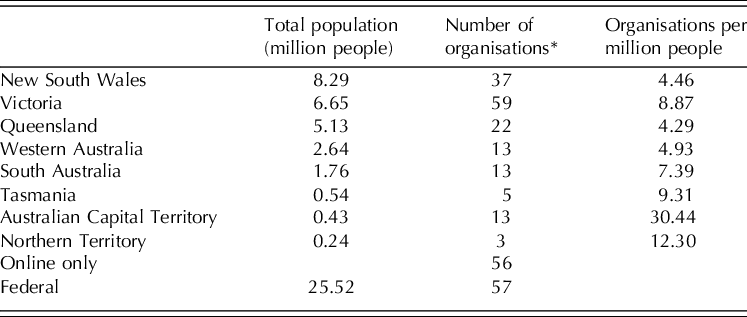
First, to identify gaps in the geographical scope of the responses to hate in Australia, we looked at the number of organisations in each state, as well as activities with a federal reach, and online activities. Table 2 summarises the geographical distribution of organisations. Victoria is the state with the most organisations running hate-tackling activities (fifty-nine), followed by New South Wales (thirty-seven) and Queensland (twenty-two). However, when looking at the number of active organisations per million people, the ACT has the highest number (30.44), followed by Northern Territory (12.30), Tasmania (9.31) and Victoria (8.87). The states with the fewest organisations per million people are Queensland (4.29), New South Wales (4.46), Western Australia (4.93), and South Australia (7.39).
Geographical distribution of organisations by state and territory, N = 222.

* Please note that the total sum is more than 222 because one organisation can work in multiple geographical areas
Second, to look at gaps in terms of target populations, we classified organisations in terms of whether they focus on all groups targeted by hate, or whether they focus on a list of protected characteristics. As one organisation can focus on more than one target group, the total count is more than the total number of organisations in the database. About one in three organisations in our database (31.1 per cent, N = 69) focus on tackling all forms of hate (e.g. generic anti-hate efforts), while 68.9 per cent (N = 153) focus on specific protected characteristics. Of the latter, the largest group focuses on racial or religious hate (43.1 per cent, N = 66), 17.6 per cent (N = 27) focus on LGBTIQ+ hate, 13.1 per cent (N = 20) on intersectional or multiple identities (for example, racial and sexual hate), 11.8 per cent (N = 18) on ableism, 7.8 per cent (N = 12) on ageism, and 6.5 per cent (N = 10) on other forms like sexism and hate against people experiencing homelessness. Among the organisations addressing hate against LGBTIQ+ communities, thirty-nine organisations focus on gender, thirty-nine on sexual orientation, thirty-seven on transgender status and thirty-four on intersex status. Thirty-three organisations focus on all four characteristics together, one on intersex status only, one on transgender status only, one organisation on sexual orientation only, and the remaining three on a combination of three or less of these characteristics.
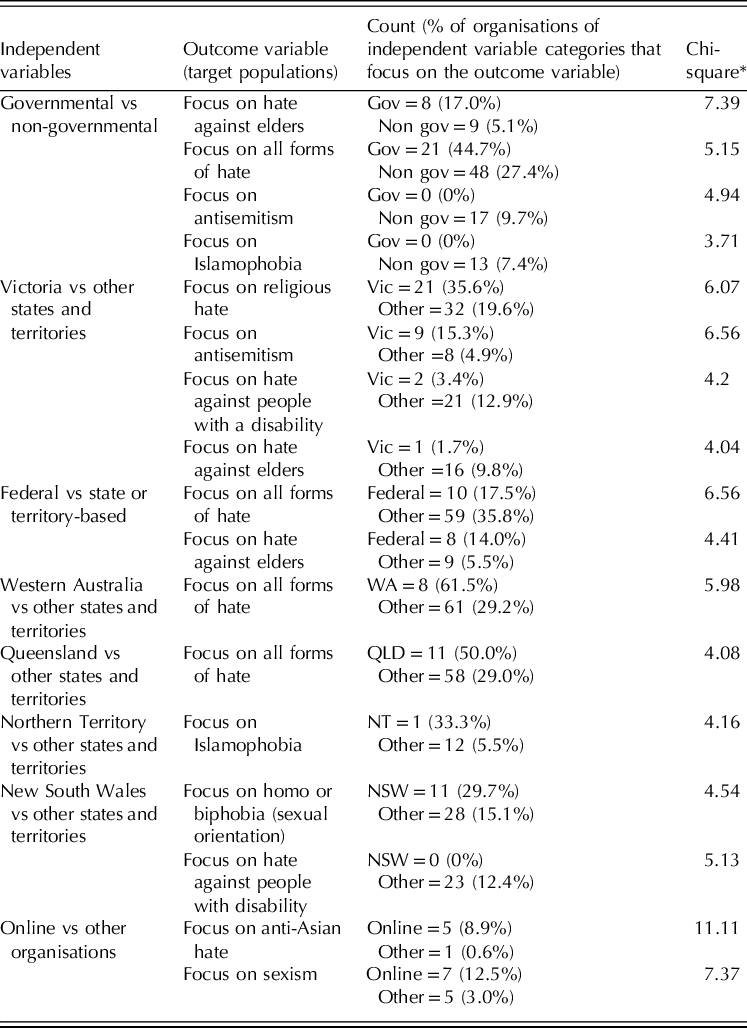
We found significant differences in terms of target populations between non-governmental and governmental organisations, and across geographical areas (see Table 3). Governmental organisations were more likely to focus on hate against elders than non-governmental organisations, and to focus on generic anti-hate efforts than non-governmental organisations. Conversely, non-governmental organisations were more likely to focus on religious hate, such as antisemitism and Islamophobia, than government. Focus on protected characteristics vary significantly across different states and territories, and online. In Victoria significantly more organisations focus on religious hate and antisemitism, and fewer focus on hate against people living with a disability and elders, than in other states and territories. Federal organisations were significantly more likely to focus on tackling all forms of hate and hate against elders. Organisations in Western Australia and Queensland were significantly more focused on tackling all forms of hate. Online organisations were significantly more focused on tackling anti-Asian hate.
Chi-square test results: differences in target populations by organisation types and geographical areas.

* All reported Chi-square test are based on the full dataset (N = 222), with degrees of freedom (df) = 1 and Chi-square values significant at p = 0.05
Finally, we looked at the activities of organisations in our database. About three out of four of the organisations in our database (76.6 per cent, N = 170) conducted activities focused on raising awareness and education among members of the public about harms associated with hate. Of these, 124 (72.9 per cent) were non-government organisations, and forty-six (27.1 per cent) were government organisations. About three-quarters (N = 133) of organisations running awareness and education activities focus on specific protected characteristics, as opposed to addressing all forms of hate; about one in three focus on race or religion only (32.9 per cent, N = 56). Awareness and education activities focusing on the LGBTIQ+ community were comparatively fewer in South Australia (9.1 per cent), Victoria (8.9 per cent) and Queensland (7.7 per cent), with more in New South Wales (25 per cent) and ACT (22.2 per cent). We found no awareness and education activities addressing hate against LGBTIQ+ communities in Northern Territory or Tasmania. Overall, organisations that address hate targeting LGBTIQ+ people and the elderly focus less on awareness-raising and education activities than organisations working with other minority groups.
About one third of the organisations in our database (33.3 per cent, N = 74) focus on supporting targets of hate. Of these, 24.3 per cent (N = 18) were government organisations, and 75.7 per cent (N = 56) non-government organisations. Only 38.3 per cent of government organisations focus on victim support. More than half (59.5 per cent, N = 44) of the organisations focusing on victim support address all forms of hate. The largest share of organisations working on victim support focus on hate against people with disability (10.8 per cent, N = 8). About two in three federal victim support programs address people living with a disability and elders. Victoria has a comparatively higher proportion of victim support programs offered to targets of religious and racial hate (27.8 per cent, N = 5).
Data collection is the focus for 27.9 per cent (N = 62) of organisations in our database. Of these, twelve (19.4 per cent) are governmental and fifty (80.6 per cent) non-governmental. The majority of the organisations collecting data, as in the case of victim support, focus on all forms of hate (69.4 per cent, N = 43). Of the governmental organisations, human rights commissions and police forces are the main ones collecting data (although we found public evidence that only three police forces – Victoria Police, News South Wales Police and Queensland Police – collect data about the prejudice motivation of crimes). Data collection is comparatively underdeveloped among organisations working with LGBTIQ+ communities (N = 5), the elderly (N = 3), and people with disability (N = 1). It is more developed among organisations working on race, ethnicity and nationality (N = 8, of which three are for the Asian community and three for Indigenous Australians) and religion (N = 13, of which five are for the Jewish community and five for the Muslim community).
Discussion and conclusion
This article proposes a new conceptual framework and a standard procedure to map whole-of-society efforts to tackle hate crime, hate speech and hate incidents. This conceptual framework is used in the Australian context to create a database of 222 organisations, which is analysed to identify gaps and needs in this important policy area, with the aim to guide policymakers and non-governmental stakeholders in their efforts to address hate crime, hate incidents and hate speech. Our results show an uneven distribution of efforts across different geographical areas, types of activities and target groups. Firstly, there is a geographical disproportion in the number of hate-tackling organisations in states like Victoria and the ACT compared to other states like Queensland and New South Wales. This finding calls for assessing the needs of communities facing hate victimisation in states with comparatively fewer organisations working in this field. Secondly, the majority of the efforts, especially from government organisations, focus on raising awareness and education activities, and less on improving victim support and data collection. This finding points to an important gap and the need for governmental and non-governmental organisations to shift their focus to these areas where more work is needed, and for government organisations to coordinate with community organisations already collecting data to ensure consistency. Thirdly, racial and religious hate are the main focus of awareness raising and education activities, especially in Victoria. This finding demonstrates the need to develop parallel activities to tackle other forms of hate, such as LGBTIQ+ hate, ableism, and ageism, among others.
The conceptual framework that we propose and use to map anti-hate efforts in Australia should be adapted before use in different country contexts. In particular, keywords and concepts that are relevant to the historical and geographical context should be added – or removed – to account for specific local issues: for example, anti-Indigenous hate might not be an issue in most European contexts, while anti-Roma hate might be. Also, we would expect that in the context of the 2020 presidential elections in the United States, a specific focus should be on hate against ideological groups, given the severity of hate crimes, hate incidents and hate speech between left wing and right wing supporters. Also, in a given country context, hate behaviours might be referred to using terms that are absent from the framework presented in this article: for example, Klansmen violence or anti-Hispanic crime.
We acknowledge that our framework could be more sensitive to capture a wider range of organisations tackling hate. It is possible that organisations were excluded from our study because they describe their work in terms that are different from the terms that inform our theoretical framework (e.g. harmony, inclusion). While we acknowledge that this possibility does exist, we believe that our criteria are broad enough to have allowed for the inclusion of a comprehensive range of relevant organisations.
Future research should focus more directly on capturing anti-hate activities undertaken by private companies. There are likely a significant number of companies that collect workplace discrimination data among their employees. Many of these companies may have guidelines for addressing workplace discrimination targeting protected characteristics. Scoping what type of data is available among private companies, and assessing strengths and weaknesses of this data, will be an important area for future research, because it will allow adding further information to our understanding of hate in Australia
In conclusion, we propose that our framework and procedures to map anti-hate efforts in a country will contribute to the harmonisation and coordination of government and non-government efforts in this fragmented policy area, improving the assessment of gaps and needs, and the allocation of resources where needed. By proposing a unified conceptual framework that embraces all concepts and target groups of hate, this article also aims to promote a new culture among researchers and practitioners that seeks to provide holistic and harmonised responses to different forms of hate (i.e. hate crime, hate speech and hate incidents), and to hate against different target groups. This translates into enhanced collaborations between governmental organisations tackling criminal (i.e. law enforcement) and noncriminal (i.e. human rights commissions) behaviours, as well as non-government organisations like watch-group and community organisations, which possess key knowledge and community trust to collect data and support targets of hate. Overall, better coordination of policy responses to hate will make it easier for targets to navigate the system, policymakers and practitioners to have a clear picture of hate and responses to hate in one country, and researchers to evaluate the effectiveness of policies and programs, and to understand the true prevalence of hate behaviours in different communities.
Acknowledgments
This work was funded by the Centre for Resilient and Inclusive Societies. We also thank the anonymous reviewers for their supportive and helpful feedback.