



1. Introduction
The flow past bluff bodies of various geometries in unbounded domains remains a classical yet perpetually significant research topic in fluid dynamics, as evidenced by extensive experimental and numerical investigations. Representative studies include the wake development behind impulsively started plates of different geometric shapes (Taira & Colonius Reference Taira and Colonius2009; Caverly & Nedić Reference Caverly and Nedić2025), the flow characteristics around different cylindrical bluff bodies in steady uniform streams (Thompson et al. Reference Thompson, Radi, Rao, Sheridan and Hourigan2014; Lekkala et al. Reference Lekkala, Latheef, Jung, Coraddu, Zhu, Srinil, Lee and Kim2022), and the vortex dynamics of polygonal and curved plates at fixed incidence (Humphries & Vincent Reference Humphries and Vincent1976; Moffatt Reference Moffatt2013; Nedić et al. Reference Nedić, Ganapathisubramani and Vassilicos2013). In particular, the wake behaviour of fixed planar bluff bodies with varied geometries subjected to axial steady flow has attracted sustained attention due to its fundamental implications in vortex formation mechanisms, and practical relevance to aerodynamic applications.
Among various geometric configurations, the circular disk – serving as a prototypical axisymmetric bluff body – has been extensively studied through both experimental (Marshall & Stanton Reference Marshall and Stanton1931; Willmarth et al. Reference Willmarth, Hawk and Harvey1964; Kuo & Baldwin Reference Kuo and Baldwin1967; Roos & Willmarth Reference Roos and Willmarth1971; Roberts Reference Roberts1973; Berger et al. Reference Berger, Scholz and Schumm1990; Fernandes et al. Reference Fernandes, Risso, Ern and Magnaudet2007; Zhong & Lee Reference Zhong and Lee2012; Kuraan & Savaş Reference Kuraan and Savaş2024) and numerical (Michael Reference Michael1966; Rimon Reference Rimon1969; Rivet et al. Reference Rivet, Henon, Frisch and d’Humieres1988; Fabre et al. Reference Fabre, Auguste and Magnaudet2008; Shenoy & Kleinstreuer Reference Shenoy and Kleinstreuer2008; Chrust et al. Reference Chrust, Bouchet and Dušek2010; Auguste et al. Reference Auguste, Fabre and Magnaudet2010; Yang et al. Reference Yang, Liu, Wu, Liu and Zhang2015) approaches, with consensus emerging on its characteristic transition scenarios in normal flow. It is well established that the wake behind a circular disk undergoes a complex transition process – evolving from a steady state to an unsteady, chaotic regime as the Reynolds number increases. There are many parameters affecting the flow around the circular disk, such as the Reynolds number
 $Re$
and the diameter–thickness aspect ratio
 $\chi$
. Here, the Reynolds number is defined as
 $Re = U_\infty D/\nu$
, where
 $D$
is the nominal characteristic length,
 $U_\infty$
is uniform flow velocity, and
 $\nu$
is the kinematic viscosity of the fluid. The diameter–thickness aspect ratio is defined as
 $\chi = D/t_d$
, based on the thickness of the plate
 $t_d$
.
The flow is steady and axisymmetric with a constant drag force when the Reynolds number is sufficiently low. This state is named the ‘steady axisymmetry flow’ by Shenoy & Kleinstreuer (Reference Shenoy and Kleinstreuer2008), or the ‘trivial state’ by Auguste et al. (Reference Auguste, Fabre and Magnaudet2010). With the increase of Reynolds number, the first bifurcation is observed for all different aspect ratios. Following the primary bifurcation, the flow evolves into a steady reflectionally symmetric state, distinguished by the emergence of a counter-rotating vortex pair aligned streamwise. The orientation of the symmetry plane is governed by initial perturbations rather than deterministic flow constraints (Chrust et al. Reference Chrust, Bouchet and Dušek2010). This bifurcation, which breaks the axisymmetry, produces persistent non-zero lift forces perpendicular to the freestream direction, identified as the steady state in Fabre et al. (Reference Fabre, Auguste and Magnaudet2008) and Meliga et al. (Reference Meliga, Chomaz and Sipp2009), and termed the ‘steady asymmetric’ state by Shenoy & Kleinstreuer (Reference Shenoy and Kleinstreuer2008). The critical Reynolds number
 $Re_{c1}$
of the first bifurcation can be approximated by a function
 $116.5(1+\chi ^{-1})$
(Fernandes et al. Reference Fernandes, Risso, Ern and Magnaudet2007). For a flat disk (
 $\chi = \infty$
), reported values of
 $Re_{c1}$
exhibit a narrow spread, with the established literature converging on a range of 115 to 117 (Natarajan & Acrivos Reference Natarajan and Acrivos1993; Fabre et al. Reference Fabre, Auguste and Magnaudet2008; Meliga et al. Reference Meliga, Chomaz and Sipp2009; Chrust et al. Reference Chrust, Bouchet and Dušek2010). For a disk with
 $\chi =10$
,
 $Re_{c1}$
is found to be 135 by Shenoy & Kleinstreuer (Reference Shenoy and Kleinstreuer2008), and 129.6 by Chrust et al. (Reference Chrust, Bouchet and Dušek2010). For a disk with
 $\chi =3$
,
 $Re_{c1}$
rises further, to approximately 159.4 (Auguste et al. Reference Auguste, Fabre and Magnaudet2010).
A further increase in the Reynolds number triggers a secondary bifurcation, consistently identified as a Hopf type. This bifurcation marks the onset of a periodic state characterised by regular vortex shedding. For a disk with
 $\chi =10$
, the flow transitions to a three-dimensional periodic pattern featuring a regular rotation of the separation region (Shenoy & Kleinstreuer Reference Shenoy and Kleinstreuer2008). Loss of reflection symmetry leads to the two axial vorticities twisting each other in the near wake. This dynamical regime is referred to in various ways across the literature: ‘reflectional symmetry breaking’ (RSB) by Fabre et al. (Reference Fabre, Auguste and Magnaudet2008), ‘mixed mode with phase
 $\pi$
’ (
 $MM_\pi$
) by Meliga et al. (Reference Meliga, Chomaz and Sipp2009), and ‘yin-yang’ by Auguste et al. (Reference Auguste, Fabre and Magnaudet2010). The critical Reynolds number
 $Re_{c2}$
for the Hopf bifurcation follows the scaling
 $125.6(1+\chi ^{-1})$
according to Fernandes et al. (Reference Fernandes, Risso, Ern and Magnaudet2007). For a flat disk (
 $\chi =\infty$
), a consensus value for
 $Re_{c2}$
falls within the narrow interval
 $121{-}125.6$
(Natarajan & Acrivos Reference Natarajan and Acrivos1993; Fabre et al. Reference Fabre, Auguste and Magnaudet2008; Meliga et al. Reference Meliga, Chomaz and Sipp2009; Chrust et al. Reference Chrust, Bouchet and Dušek2010). For a disk with
 $\chi = 10$
, reported values range between 136.3 and 138.7 (Chrust et al. Reference Chrust, Bouchet and Dušek2010), although Shenoy & Kleinstreuer (Reference Shenoy and Kleinstreuer2008) report a higher value, 155. The sequence of bifurcations depends on the disk’s thickness. For a disk with
 $\chi \geq 4$
, the RSB mode is always the secondary bifurcation (Chrust et al. Reference Chrust, Bouchet and Dušek2010). Instead, for a thicker disk with
 $\chi =3$
, the RSB is the fourth bifurcation, and there are two exclusive bifurcations previous to it, namely ‘zig-zig’ and ‘knit-knot’ modes (Auguste et al. Reference Auguste, Fabre and Magnaudet2010). The ‘zig-zag’ mode is characterised by planar symmetry with the lift force oscillating around a non-zero mean. The ‘knit-knot’ mode is characterised by the breaking of the reflectional symmetry and a secondary frequency.
At higher Reynolds numbers, the flow undergoes a third bifurcation, distinguished by the spontaneous restoration of reflectional symmetry. This transition triggers periodic vortex shedding in the direction orthogonal to the symmetry plane, generating oscillatory lift forces around a zero mean value. In the literature, this regime is denoted variably as ‘a standing wave mode’ in Fabre et al. (Reference Fabre, Auguste and Magnaudet2008), ‘unsteady with planar symmetry and zero lift force’ in Shenoy & Kleinstreuer (Reference Shenoy and Kleinstreuer2008), and ‘zig-zag’ mode in Auguste et al. (Reference Auguste, Fabre and Magnaudet2010). A comparable flow pattern was earlier identified in sphere wakes by Fabre et al. (Reference Fabre, Auguste and Magnaudet2008), who classified it as the ‘reflectional symmetry-preserving (RSP) mode’. For a flat disk (
 $\chi = \infty$
), the critical Reynolds number
 $Re_{c3}$
for this bifurcation is consistently reported within the interval
 $140{-}143$
(Fabre et al. Reference Fabre, Auguste and Magnaudet2008; Meliga et al. Reference Meliga, Chomaz and Sipp2009; Chrust et al. Reference Chrust, Bouchet and Dušek2010). In the case of a thicker disk with
 $\chi = 3$
, a pre-chaotic, quasi-periodic state emerges prior to the onset of full chaos (Auguste et al. Reference Auguste, Fabre and Magnaudet2010; Chrust et al. Reference Chrust, Bouchet and Dušek2010). This state is characterised by the persistence of the reflectional symmetry and emergence of a secondary frequency close to one-third of the leading frequency of the previous regimes.
Beyond the canonical axisymmetric disk, polygonal plates – geometries defined by the number of vertices
 $N$
(see figures 1 and 3 for geometric definitions), such as squares, triangles and ellipses – frequently occur in natural and engineered systems. The wake dynamics of various specific geometries have been examined in the literature.
Focusing on elliptical disks (
 $N=2$
) aligned normal to the freestream, Kuo & Baldwin (Reference Kuo and Baldwin1967) employed wind tunnel experiments at aspect ratios
 $AR$
(major axis length/minor axis length) 1.67 and 5.0, revealing the distinctive vortex axis-switching phenomenon where the major axis of the wake is aligned with the minor axis of the body. Building on this, Kiya & Abe (Reference Kiya and Abe1999) conducted investigations using water tunnel dye visualisation at
 $Re=200$
and direct numerical simulations (DNS) at
 $Re=200$
to investigate elliptical disks of 3 mm thickness with aspect ratios
 $AR=2.0$
–
 $3.0$
. Their validated results demonstrate persistent axis-switching accompanied by dual-frequency vortex shedding and low-frequency global instability, with spectral signatures arising from two distinct mechanisms: high-frequency periodic roll-up of hairpin vortices alternating from minor-axis planes, and low-frequency large-scale wake meandering along the major-axis direction.
For a normal thin equilateral triangular plate (
 $N=3$
), flow visualisations by Higuchi et al. (Reference Higuchi, Anderson and Zhang1996) in the starting flow regime revealed that the vortex sheet rolling up from each edge arches strongly in the streamwise direction, producing concentrated streamwise vorticity at the corners, and pronounced deformation of the near wake. Gursul et al. (Reference Gursul, Gordnier and Visbal2005), in a review of non-slender delta wing aerodynamics, noted that the leading-edge geometry plays a decisive role in such flows: blunt leading edges promote attached vortical flow, whereas sharp edges fix the separation points, yielding more predictable vortex structures, but triggering earlier separation.
For flat plates (
 $N=4$
), numerical investigations employing two-dimensional approximations (Dennis et al. Reference Dennis, Qiang, Coutanceau and Launay1993; Thompson et al. Reference Thompson, Hourigan, Ryan and Sheard2006; Saha Reference Saha2007), modelling the plate as an infinitely thin segment, reveal distinct wake transitions in normal flow: at
 $5 \leq Re \leq 20$
, the near wake maintains steady symmetry (Dennis et al. Reference Dennis, Qiang, Coutanceau and Launay1993); DNS analyses demonstrate that the first bifurcation to two-dimensional vortex shedding (characterised by a von Kármán street) occurs at
 $Re = 30$
–
 $35$
, where both near and far wake become unsteady (Saha Reference Saha2007); three-dimensional instability emerges at
 $Re \approx 105$
–
 $110$
, evolving through the longer wavelength and shorter wavelength modes (Thompson et al. Reference Thompson, Hourigan, Ryan and Sheard2006); large-scale low-frequency vortical structures dominate the far wake for
 $Re \geq 145$
(Saha Reference Saha2007).
Extending to three-dimensional squares (
 $N=4$
) aligned normal to flow, numerical investigations reveal distinct transition sequences at low
 $Re$
. Initially, symmetric steady wakes with closed recirculation bubbles persist (Marquet & Larsson Reference Marquet and Larsson2015; Zhao et al. Reference Zhao, Gao, Zhang, Guo, Li and Tian2021; Zampogna & Boujo Reference Zampogna and Boujo2023). Beyond the primary bifurcation at
 $Re_{c1}\approx 120$
, square plates with diameter–thickness ratio
 $\chi =6$
lose dual-axis symmetry and develop asymmetric steady wakes (Marquet & Larsson Reference Marquet and Larsson2015). In contrast, thinner plates with
 $\chi =50$
maintain steady wakes preserving single-axis planar symmetry (Zhao et al. Reference Zhao, Gao, Zhang, Guo, Li and Tian2021). Subsequent Hopf bifurcation at
 $Re_{c2}=132{-}135$
triggers periodic vortex shedding (RSB mode), followed by symmetry restoration at
 $Re_{c3}=145{-}147$
forming standing waves at
 $St=0.113$
. Quasi-periodic states with preserved reflectional symmetry emerge at
 $Re=200{-}225$
, then degenerate into chaotic flows losing both periodicity and symmetry at
 $Re=230{-}240$
(Zhao et al. Reference Zhao, Gao, Zhang, Guo, Li and Tian2021). Notably, Najjar & Balachandar (Reference Najjar and Balachandar1998) identified a low-frequency unsteadiness at
 $Re=250$
where the lift/drag coefficients exhibited a period approximately 10 times that of the primary shedding period, while Hemmati et al. (Reference Hemmati, Wood and Martinuzzi2016) demonstrated that sharp edges on square plates (
 $AR=3.2$
,
 $Re=1200$
) pin separation points, suppressing stochasticity inherent to disk wakes to generate axis-aligned vortex loops.
The influence of perimeter geometry on wake dynamics has been hinted at by studies in related configurations. In starting-flow visualisations behind triangular, square, hexagonal and octagonal plates, Higuchi et al. (Reference Higuchi, Anderson and Zhang1996) observed that the initial vortex sheet rolls up into an arched structure because of non-uniform self-induced velocity, generating pairs of counter-rotating streamwise vortices at the corners. The longitudinal vorticity produced by this arching effect was identified as the primary factor of wake deformation and eventual breakdown. Vortex distortion was most pronounced for plates with sharp corners, whereas the near wake of an octagonal plate already began to resemble that of a circular disk. Miller et al. (Reference Miller, Madnia and Givi1995) numerically demonstrated that non-unity aspect ratio jets and equilateral triangular jet produce large-scale coherent structures and exhibit axis-switching.
Although these studies were conducted in starting flows or jet configurations rather than in the low-
 $Re$
uniform-flow normal-plate problem of interest here, they collectively indicate that vertex count and local edge curvature are key parameters controlling the generation of streamwise vorticity and the subsequent evolution of the wake. However, neither these nor the existing body of work on canonical geometries provide a systematic account of how these geometric factors dictate the sequence of bifurcations that a wake undergoes as the flow becomes unsteady. The low-
 $Re$
regime is of particular physical interest because the principal qualitative changes – steady symmetric, reflection symmetric, symmetry breaking, symmetry preserving and chaotic states – occur within a compact parameter space (Fabre et al. Reference Fabre, Auguste and Magnaudet2008; Shenoy & Kleinstreuer Reference Shenoy and Kleinstreuer2008). High Reynolds number experiments necessarily average over these transitions, obscuring the underlying bifurcation structure. A low-
 $Re$
parametric study can therefore isolate the role of geometry in triggering symmetry breaking and determining the route to chaos. Recent work has emphasised that large-scale asymmetric states in turbulent separated flows may be associated with lower-Reynolds-number global instability modes whose characteristics are determined by geometry and flow conditions (Williams & Smits Reference Williams and Smits2025). Multiple unstable modes may coexist and interact in turbulent flows, while the symmetry of the geometry can constrain the available symmetry breaking modes and associated wake states. These observations motivate the use of canonical, low-Reynolds-number configurations as controlled model systems in which the geometric mechanisms governing symmetry breaking can be isolated from the additional complexity of high-Reynolds-number turbulence.
A question posed by Moffatt (Reference Moffatt2013) is whether a wavy edge of a circular disk alters the wake transition scenario. Although the present study considers regular polygonal plates with a finite number of straight edges, rather than a continuous waviness, it addresses the same fundamental issue: how does a departure from the circular perimeter alter the wake transition scenario? By varying the vertex count
 $N$
and the compression ratio
 $k$
, we effectively control the sharpness of the corners and the local curvature of the perimeter, thereby providing a systematic framework to probe the edge-governed wake physics raised by Moffatt. Against this background, the present work seeks to answer three questions. (i) How do regular polygonal plates dictate wake transition sequences as the Reynolds number increases? (ii) What roles do the vertex count and the distribution of curvature play in governing wake dynamics? (iii) How do these transition scenarios differ from the well-documented disk paradigm?
Schematic representation of how the basic circle is transformed into a disk-like plate with the parameters
 $N = 3$
and
 $k = 0.5$
. Point
 $A$
is located on the reference circle. The perpendicular line is drawn from
 $A$
to the nearest side of the inscribed polygon, defining the foot point
 $H$
. The compression ratio
 $k = |HB|/|HA|$
then determines the final point
 $B$
on the plate geometry. Dashed lines are the reference circle (
 $k=1$
) and the inscribed regular polygon (
 $k=0$
); the solid line is the designed thin plate.

Motivated by these fundamental questions, we employ DNS (Kim et al. Reference Kim, Moin and Moser1987) to investigate flow past disk-like plates aligned normal to the freestream, with all plates maintaining a diameter–thickness aspect ratio
 $\chi = 50$
. Two geometric parameters, the vertex count
 $N$
and the compression ratio
 $k$
, govern the plate morphology. These parameters generate a spectrum of shapes spanning regular polygons to disks, enabling systematic quantification of geometric effects on wake transitions. Figure 1 shows how we get a disk-like plate with
 $N = 3$
and
 $k = 0.5$
. First, a reference circle with diameter
 $D$
and the corresponding inscribed
 $N$
-sided regular reference polygon are made. Then a perpendicular line
 $AH$
is constructed from an arbitrary point
 $A$
on the reference circle to the nearest side of the reference polygon. Finally, a compression ratio defined as
 $k = |HB|/|HA|$
determines the position of point
 $B$
, which is on the designed thin plate. Through systematic variation of
 $N$
and
 $k$
, we generate thin plates with controlled curvature distributions along their perimeters, subsequently applying isotropic scaling to ensure identical projected area to the reference circular disk. The parametric study encompasses
 $N = 2, 3, 4, 5$
and
 $k = 0, 0.3, 0.4, 0.5, 0.8, 1$
. For
 $N = 2$
, the circular reference geometry compresses into an elliptical profile, though configurations with
 $k \leq 0.3$
degenerate into quasi-linear segments excluded from analysis due to their non-bluff-body characteristics. Crucially, for the
 $N = 3$
,
 $k = 0$
case, the design reduces to an isosceles triangular plate with base angles
 $62.09^\circ$
(apex angle
 $55.82^\circ$
), constrained to have the same projected area as the reference disk. This shape possesses a single reflectional symmetry plane (through the apex and base midpoint) but no rotational symmetry, allowing us to isolate the effect of broken rotational symmetry on the wake dynamics.
The remainder of the paper is organised as follows. The numerical methods and studies of convergence are presented in § 2. The flow regimes observed in flow normal to a disk-like plate are presented in § 3. The influence of plate geometry on wake stability and vortical structure is analysed in § 4. Concluding remarks are provided in § 5.
2. Numerical simulations
2.1. Mathematical formulations and numerical methods
The numerical simulation employs a cylindrical computational domain with diameter
 $24D$
, where the distances from the plate to the inlet and outlet boundaries are
 $8D$
and
 $30D$
, respectively, as shown in figure 2(a). The origin
 $O$
of the coordinate system
 $(Ox,Oy,Oz)$
is located at the centre of the disk, and the direction of the
 $x$
-axis coincides with the direction of the incoming flow. The computational domain is discretised using hexahedral elements, with mesh refinement concentrated near the plate surface to enhance resolution of the surrounding flow, as depicted in figures 2(b,c). All meshes employed in this study are derived from these baseline configurations via a mesh deformation approach that preserves both the mesh topology and the frontal area. Some examples of the transformed meshes of disk-like plates are shown in figure 3.
Schematic diagrams of the computational domain and grid structures: (a) computational domain with boundary conditions, (b) side view and (c) back view of the grid topology and structures.

Deformed computational meshes for disk-like plates at two representative compression ratios
 $k$
, covering all vertex numbers
 $N$
: (
 $a{-}c$
)
 $k=0.3$
for
 $N=3, 4, 5$
; (
 $d{-}g$
)
 $k=0.5$
for
 $N=2, 3, 4, 5$
. Meshes maintain topology while adapting to curvature variations.

The Cartesian coordinate system is used in the present study. These coordinates could be uniformly denoted as
 $x_i$
, where
 $i = 1,2,3$
, and the velocity component in the
 $x_i$
direction could be denoted as
 $u_i$
. Then the Navier–Stokes equations can be written as
 \begin{equation} \frac {\partial u_i}{\partial x_i} = 0, \end{equation}
 \begin{equation} \frac {\partial u_i}{\partial t} + u_{\!j}\frac {\partial u_i}{\partial x_{\!j}} = -\frac {1}{\rho }\frac {\partial p}{\partial x_i} + \nu \frac {\partial ^{2} u_i}{\partial x_{\!j}\,\partial x_{\!j}}, \end{equation}
where
 $p$
is the pressure, and
 $\rho$
is the density of the fluid.
Based on the open-source computational fluid dynamics code OpenFOAM, the finite-volume method is performed to discretise the equations that characterise the problem. The pressure implicit with splitting of operators (PISO) scheme is used to iteratively deal with the unsteady state. Besides, the integral term is discretised by the standard method of applying Gauss’ theorem to the volume integral, and then the volume and surface integral are linearised by appropriate schemes. The spatial schemes of interpolation, gradient, Laplacian and divergence are all linear and of second order. The time derivative is integrated over a control volume by the second-order Crank–Nicolson scheme. For clarity, more information of the method and these schemes is available in OpenFOAM (2021).
The boundary conditions at the plate surface are imposed as no-slip impermeable wall, where the velocity of the fluid is equal to that of the wall itself with fixed value
 $(0, 0, 0)$
, and the pressure is specified zero gradient since the flux through the wall is zero. At the inlet boundary, the velocity field is supplied by a uniform flow
 $(U_\infty , 0, 0)$
, and for consistency, the boundary condition on pressure is zero gradient. At the outlet boundary, the pressure field is fixed at zero, and a zero gradient boundary condition on velocity is specified. At the freestream boundary, the velocity and pressure are set to free-slip and zero normal-gradient boundary conditions, respectively.
Statistical values of the drag coefficient
 $C_x$
and the lift coefficient
 $C_l$
of three configurations
 $(N, k, Re)$
and the Strouhal number
 $St$
obtained by three cases with different spatial and temporal resolutions. Here,
 $n_1 / D$
defines the dimensionless size of the smallest cells near the plate surface,
 $\Delta t\, U_\infty / D$
is the dimensionless time step, the lift coefficient is defined as
 $C_l=\sqrt {C_y^2+C_z^2}$
, and the Strouhal number is defined by the frequency of vortex shedding
 $f$
as
 $St = fD/U_\infty$
. The symbol
 $\langle \cdot \rangle$
represents the time-averaged value.

Table 1. Long description
A table comparing statistical values of drag and lift coefficients for three configurations and Strouhal numbers across different cases.
The non-dimensional force coefficients in three directions are defined as
 \begin{equation} (C_x, C_y, C_z) = \frac {(F_x, F_y, F_z)}{\frac {1}{8}{\rho }U_\infty ^2{\pi }D^2} , \end{equation}
where
 $F_x$
,
 $F_y$
,
 $F_z$
are the force components acting on the plate in the
 $x$
,
 $y$
and
 $z$
directions, respectively, and they are directly calculated by integrating the pressure and viscous shear force over the plate surface. The drag force coefficients are the corresponding dimensional force coefficients in the
 $x$
,
 $y$
and
 $z$
directions. The vorticity component in the streamwise direction is defined as
 \begin{equation} \omega _x = \frac {\partial u_z}{\partial y} - \frac {\partial u_y}{\partial z}. \end{equation}
The three-dimensional vortical structures are identified by the
 $Q$
-criterion proposed by Hunt et al. (Reference Hunt, Wray and Moin1988), using the strain tensor
 $\boldsymbol{S}$
and the rotation tensor
 $\boldsymbol{\varOmega }$
:
 \begin{equation} Q = -\frac {1}{2}(\|\boldsymbol{S} \|^2-\|\boldsymbol{\varOmega } \|^2). \end{equation}
2.2. Convergence studies and code validations
Convergence studies are conducted to evaluate the effects of the spatial and temporal resolutions on the numerical simulation results. As shown in table 1, three cases with different numbers of grid elements and time steps are adopted, i.e. cases S1, S2, S3. Three distinct flow configurations of disk-like plates – parametrised by vertex number
 $N$
, compression ratio
 $k$
, and Reynolds number
 $Re$
– are investigated. The lift coefficient is defined as
 $C_l = \sqrt {C_y^2 + C_z^2}$
. The mean values of the force coefficients
 $C_x$
and
 $C_l$
for three configurations
 $(N, k, Re)=(3, 0.8, 100)$
,
 $(4, 0.5, 150)$
and
 $(5, 0.3, 200)$
are presented for each case. For the three configurations examined, the Strouhal number is
 $St = fD/U_\infty$
(where
 $f$
is the vortex shedding frequency), and the statistical force coefficients
 $\left \langle C_x \right \rangle$
and
 $\left \langle C_l \right \rangle$
demonstrate consistent agreement across all cases. In addition, for the flow configuration
 $(N, k, Re)=(4, 0.5, 150)$
, the mean pressure coefficient
 $\langle C_p \rangle$
and mean streamwise velocity
 $\langle U_x \rangle$
along the centreline (
 $y/D=0,\ z/D=0$
, i.e. the
 $x$
-axis) are shown in figure 4. Pressure coefficient
 $C_p$
is defined as
 $C_p=(p-p_\infty )/(0.5\rho U_{\infty }^2)$
, where the reference pressure
 $p_\infty$
is measured at the centre of the inlet boundary. The distributions of
 $C_p$
and
 $U_x$
exhibit consistent agreement across the three validation cases, confirming adequate spatial and temporal resolution convergence. Considering the optimal balance between computational cost and solution accuracy, the mesh time step configuration of case S2 (905 300 grid elements, dimensionless time step 0.002) is consequently employed for all subsequent simulations reported in § 3.
Critical Reynolds numbers (
 $Re_{ci}$
) and Strouhal numbers (
 $St_i$
) at the onset of distinct wake states for flow normal to a disk. Subscripts
 $i=1,2,3,4$
denote the onsets of the steady state, RSB, RSP and CS, respectively. Here,
 $St_2$
and
 $St_3$
represent the Strouhal numbers associated with the oscillations at the corresponding bifurcation thresholds. The parentheses denote the bistability interval; the square brackets delimit the error margin.

Table 2. Long description
The table presents critical Reynolds numbers and Strouhal numbers at the onset of distinct wake states for flow normal to a disk. It includes data from various studies, with subscripts denoting the onsets of the steady state, RSB, RSP, and CS. The table has 6 rows and 7 columns. Column headers are Chi, Rec1, Rec2, Rec3, Rec4, St2, and St3. Row labels include Disk and specific studies. The values in the table represent the critical Reynolds numbers and Strouhal numbers, with parentheses denoting the bistability interval and square brackets indicating the error margin. The studies listed include Fabre et al. 2008, Meliga et al. 2009, Chrust et al. 2010, Gao et al. 2018, Ouyang et al. 2022, and Present. Each row provides specific values for the critical Reynolds numbers and Strouhal numbers, showing variations and comparisons across different studies.
Profiles of (a) mean pressure coefficient
 $\langle C_p \rangle$
and (b) mean streamwise velocity
 $\langle U_x \rangle$
along the centreline (
 $z/D=0,\ y/D=0$
) for the
 $(N, k, Re) = (4, 0.5, 150)$
configuration.

Quantitative comparison of time-averaged drag coefficient
 $C_x$
for normal disk flow against established literature values.

In the scenario, i.e. the flow normal to a fixed circular disk
 $(\chi = 50)$
, the validity of the numerical method is assessed using the selected configuration of case. The Reynolds number is considered over the range
 $20\leq Re \leq 250$
. Through extensive simulations, five characteristic flow regimes are captured: axisymmetric state, steady state, RSB, RSP and chaotic state (CS). This sequence exhibits strong concordance with established bifurcation progressions in the literature (Fabre et al. Reference Fabre, Auguste and Magnaudet2008; Shenoy & Kleinstreuer Reference Shenoy and Kleinstreuer2008; Meliga et al. Reference Meliga, Chomaz and Sipp2009; Chrust et al. Reference Chrust, Bouchet and Dušek2010). As summarised in table 2 for the disk, critical Reynolds numbers
 $Re_c$
and Strouhal numbers
 $St$
at various bifurcation points converge consistently to established literature values. Quantitative validation is further provided in figure 5, comparing the drag coefficient
 $C_x$
of disk-like plates against published data. For
 $Re \leq 100$
in the steady state, the drag coefficient
 $C_x$
is in good agreement with the reports (Roos & Willmarth Reference Roos and Willmarth1971; Shenoy & Kleinstreuer Reference Shenoy and Kleinstreuer2008; Tian et al. Reference Tian, Hu, Lu and Yang2017; Ouyang et al. Reference Ouyang, Tian, Zhao, Wen, Li, Li, Peng and Peng2022). Based on the good agreement, the numerical method is able to simulate the flow normal to a stationary thin plate reliably.
Although quasi-periodic states with low-frequency oscillations are known to occur in related systems (Gao et al. Reference Gao, Tao, Tian and Yang2018; Zhao et al. Reference Zhao, Gao, Zhang, Guo, Li and Tian2021; Ouyang et al. Reference Ouyang, Tian, Zhao, Wen, Li, Li, Peng and Peng2022), the present analysis defines the onset of chaos specifically by the loss of symmetry and periodicity. Given that the transition from quasi-periodicity to chaos is gradual and lacks a definitive threshold, we group the quasi-periodic state within the broader chaotic regime to maintain a clear and consistent classification.
3. Results
The DNS of flow normal to a disk-like plate are performed for 387 groups of
 $(N, k, Re)$
with the parameter space
 $2 \leq N \leq 5$
,
 $0 \leq k \leq 1$
and
 $100 \leq Re \leq 300$
, which are represented by coloured symbols presented in figure 6. Five flow regimes are observed in the considered parametric space and denoted as steady geometric-symmetric (SG), steady reflectional-symmetric (SR), RSB, RSP and CS. The thresholds between different regimes are identified by the dashed lines.
Flow regime classification in the wake of disk-like plates across the investigated parametric space, depicting the Reynolds number
 $Re$
versus compression ratio
 $k$
phase diagrams for vertex counts
 $N = 2, 3, 4, 5$
. The following flow regimes are identified: SG, SR, RSB, RSP and CS. The pink
 $+$
symbols mark the elliptical plate (
 $N=2$
), which exhibits the unusual RSP state (uRSP). The critical transition lines between regimes are indicated by dashed curves. Selected cases that are analysed in detail in figures 7, 8, 9, 12, 14 and 16 are highlighted by black circles. For each such case, the corresponding vortical structure is visualised by streamwise vorticity isosurfaces (
 $\omega _x = \pm 0.15U_\infty /D$
or
 $\pm 0.2U_\infty /D$
or
 $\pm 0.3U_\infty /D$
) overlaid with semi-transparent
 $Q$
-criterion isosurfaces (
 $Q=0.15$
or 0.3), as indicated in the figure. These visualisations are inset within the blank regions of the phase diagram, and enclosed by a coloured rounded rectangle that matches the flow regime colour of the respective case.

Figure 6. Long description
Panel A: A scatter plot shows the relationship between Reynolds number (Re) and compression ratio (k) for vertex count N = 2. The x-axis represents the Reynolds number ranging from 95 to 305, and the y-axis represents the compression ratio ranging from 0 to 1. Different symbols and colors represent various flow regimes: CS, RSP, uRSP, RSB, SR, and SG. Selected cases are highlighted with black circles, and corresponding vortical structures are visualized by streamwise vorticity isosurfaces overlaid with semi-transparent isosurfaces. Panel B: A scatter plot shows the relationship between Reynolds number (Re) and compression ratio (k) for vertex count N = 3. The x-axis represents the Reynolds number ranging from 95 to 305, and the y-axis represents the compression ratio ranging from 0 to 1. Different symbols and colors represent various flow regimes: CS, RSP, uRSP, RSB, SR, and SG. Selected cases are highlighted with black circles, and corresponding vortical structures are visualized by streamwise vorticity isosurfaces overlaid with semi-transparent isosurfaces. Panel C: A scatter plot shows the relationship between Reynolds number (Re) and compression ratio (k) for vertex count N = 4. The x-axis represents the Reynolds number ranging from 95 to 305, and the y-axis represents the compression ratio ranging from 0 to 1. Different symbols and colors represent various flow regimes: CS, RSP, uRSP, RSB, SR, and SG. Selected cases are highlighted with black circles, and corresponding vortical structures are visualized by streamwise vorticity isosurfaces overlaid with semi-transparent isosurfaces. Panel D: A scatter plot shows the relationship between Reynolds number (Re) and compression ratio (k) for vertex count N = 5. The x-axis represents the Reynolds number ranging from 95 to 305, and the y-axis represents the compression ratio ranging from 0 to 1. Different symbols and colors represent various flow regimes: CS, RSP, uRSP, RSB, SR, and SG. Selected cases are highlighted with black circles, and corresponding vortical structures are visualized by streamwise vorticity isosurfaces overlaid with semi-transparent isosurfaces.
In general, as the Reynolds number increases, disk-like plates of varying geometries all undergo transitions from steady to turbulent wakes. Nevertheless, their specific transition pathways exhibit distinct characteristics influenced by vertex count and compression ratio. As shown in figure 6(a), the flow transition for disk-like plates with
 $N = 2$
exhibits considerable complexity. At
 $k = 0.4$
and
 $0.5$
, the SG state persists as the exclusive flow regime prior to loss of stability, with both SR and RSB states absent from the transition sequence. Following the loss of stability, the RSP state persists over a wide parameter range, exhibiting both periodicity and reflection symmetry. In particular, for the elliptical plate with
 $k = 0.4$
, within the range
 $170 \leq Re \lt 200$
(the pink ‘+’ in figure 6
a), an unusual RSP (uRSP) state emerges, characterised by the maintenance of constant drag on the basis of periodic vortex shedding, accompanied by a vortical structure distinct from that of the typical RSP regime. At
 $k = 0.8$
, the sequence of flow transitions converges towards that of a circular disk.
For disk-like plates with
 $N = 3$
in figure 6
 $(b)$
, the case
 $k=1$
corresponds to a circular disk. The other plates (
 $k \lt 1$
) exhibit a relatively direct transition sequence. The RSB state persists over a wide parameter range, while the RSP state is notably absent. This indicates that the flow maintains a periodic asymmetric state until the periodicity terminates, without symmetry recovery. For disk-like plates with
 $N = 3$
and
 $k = 0$
, the wake bypasses the initial SG state, starting directly in the SR state before transitioning to the RSB state.
For disk-like plates with
 $N = 4$
and
 $5$
in figures 6(c,d), the wake transition characteristics align with those of a circular disk. Additionally, the wakes of square plates with
 $N=4$
and
 $k=0$
exhibit the RSP state over a wide range of Reynolds numbers, indicating that the wake maintains good symmetry. With the plate geometry approaching a circular disk as
 $N$
and
 $k$
increase, the wake undergoes a full transition sequence from steady to chaotic flow, ultimately converging towards the behaviour of a disk. In the following subsections, we examine representative wake dynamics across distinct flow regimes to elucidate the transition behaviour behind disk-like plates.
3.1. The SG state
Five distinct flow regimes emerge during flow normal to a circular disk. For the reference case of a circular disk, the flow retains axisymmetric and steady state with a toroidal vortex (trival state, Auguste et al. Reference Auguste, Fabre and Magnaudet2010), when the Reynolds number is sufficiently low. For disk-like plates, however, the wake evolution shares the characteristic of steady drag force but lacks axisymmetry, exhibiting only rotationally symmetric recirculation zones. This flow regime is referred to as an SG state, as illustrated in figure 7. In this state,
 $N$
(
 $N = 2, 3, 4, 5$
) pairs of counter-rotating vortices – each associated with a symmetry plane – stably attach to the vertices of disk-like plates. Flow separation at each vertex forms vortex pairs of equal vorticity strength, as evidenced by the
 $\omega _x$
contour and
 $Q$
-criterion isosurfaces in figures 7(
 $a{-}d$
). This observation is consistent with the conclusion of Hemmati et al. (Reference Hemmati, Wood and Martinuzzi2016) that vortex shedding is constrained to the sharp corners of the plate. These visualisations reveal a non-uniform toroidal vortex structure exhibiting distinct contraction at the vertices. This contrasts sharply with circular disk flows, where separation generates an axisymmetric, uniformly distributed toroidal vortex (Shenoy & Kleinstreuer Reference Shenoy and Kleinstreuer2008). The spatial organisation and multiplicity of wake symmetry planes are exclusively dictated by the inherent geometric properties of the plate. In the
 $x/D = 0.5$
plane of the
 $N$
-sided disk-like plates, the axial vorticity distribution exhibits characteristic
 $N$
-fold rotational symmetry. Crucially, this replaces the stable axisymmetric wake structure typical of circular disks with a geometrically constrained symmetric topology. The transition from axisymmetry to inherent geometric symmetry demonstrates that the flat-plate geometry governs vortex organisation at sufficiently low Reynolds numbers, establishing plate vertices as primary determinants of vorticity distribution.
Vorticity isosurfaces characterising the SG state for four parameter sets:
 $(N, k, Re) = (2, 0.4, 120), (3, 0.3, 100), (4, 0.4, 125), (5, 0, 110)$
. (
 $a{-}d$
) Streamwise vorticity
 $\omega _x$
contours at thresholds
 $\pm 0.3U_\infty /D$
(red/blue for positive/negative values) overlaid with semi-transparent grey
 $Q$
-criterion isosurfaces (
 $Q = 0.3$
). (
 $e{-}h$
) Streamwise vorticity distributions in the cross-sectional plane at
 $x/D = 0.5$
, employing solid lines for positive vorticity, and dashed lines for negative vorticity. The grey block represents the disk-like plate geometry within the computational domain.

Figure 7. Long description
Panel A: A 3D plot showing vorticity isosurfaces for N = 2, k = 0.4, Re = 120. The axes are labeled x/D, y/D, and z/D. Panel B: A 3D plot showing vorticity isosurfaces for N = 3, k = 0.3, Re = 100. The axes are labeled x/D, y/D, and z/D. Panel C: A 3D plot showing vorticity isosurfaces for N = 4, k = 0.4, Re = 125. The axes are labeled x/D, y/D, and z/D. Panel D: A 3D plot showing vorticity isosurfaces for N = 5, k = 0, Re = 110. The axes are labeled x/D, y/D, and z/D. Panel E: A 2D plot showing streamwise vorticity contours in the y-z plane for N = 2, k = 0.4, Re = 120. The axes are labeled y/D and z/D. Panel F: A 2D plot showing streamwise vorticity contours in the y-z plane for N = 3, k = 0.3, Re = 100. The axes are labeled y/D and z/D. Panel G: A 2D plot showing streamwise vorticity contours in the y-z plane for N = 4, k = 0.4, Re = 125. The axes are labeled y/D and z/D. Panel H: A 2D plot showing streamwise vorticity contours in the y-z plane for N = 5, k = 0, Re = 110. The axes are labeled y/D and z/D.
3.2. The SR state
After the first regular bifurcation, the flow behind a disk-like plate developed to an SR state. Meanwhile, the wake behind a stationary circular disk exhibits a double-threaded structure with a single plane of symmetry. The orientation of this symmetry plane is arbitrary, being dictated by initial conditions (Chrust et al. Reference Chrust, Bouchet and Dušek2010), which corresponds to one of the disk’s infinite symmetry axes. In this state, the hydrodynamic force acting on the disk-plate remains consistent with the SG state, yet the symmetry plane multiplicity reduces to 1. As figure 8 demonstrates, the wake vortex structure exhibits pronounced symmetry aligned with one geometric symmetry plane of the plate. The selection of this specific symmetry plane is influenced by initial conditions, mesh distribution irregularities, and numerical methodology. Crucially, the vertex number
 $N$
fundamentally constrains the available symmetry plane orientations. Streamwise vorticity analysis reveals
 $N$
vortex pairs forming in the near-wake region (
 $x / D \lt 0.5$
), each anchored at plate vertices. Compared to the SG state, the SR state exhibits marked vorticity amplification: axial vorticity undergoes significant enhancement on both sides of the symmetry plane, with positive vorticity dominating one side, and negative vorticity intensifying on the opposite side. This asymmetric amplification triggers the formation of counter-rotating streamwise vortex pairs, ultimately inducing geometric symmetry breakdown.
Vorticity isosurfaces characterising the SR state for three parameter sets:
 $(N, k, Re) = (3, 0.4, 135), (4, 0.3, 140), (5, 0.5, 125)$
. (a–c) The
 $\omega _x$
isosurfaces at
 $\pm 0.15U_\infty /D$
overlaid with
 $Q$
-criterion isosurfaces of
 $Q=0.15$
. (d–f,g–i) Streamwise vorticity
 $\omega _x$
in the
 $x/D = 0.1$
and 0.5 planes, respectively.

Figure 8. Long description
Panel A: A 3D plot showing vorticity isosurfaces for N = 3, k = 0.4, Re = 135. The axes are labeled x/D and z/D. Panel B: A 3D plot showing vorticity isosurfaces for N = 4, k = 0.3, Re = 140. The axes are labeled x/D, y/D, and z/D. Panel C: A 3D plot showing vorticity isosurfaces for N = 5, k = 0.5, Re = 125. The axes are labeled x/D and z/D. Panel D: A 2D plot showing streamwise vorticity in the y-z plane for N = 3, k = 0.4, Re = 135. The axes are labeled y/D and z/D. Panel E: A 2D plot showing streamwise vorticity in the y-z plane for N = 4, k = 0.3, Re = 140. The axes are labeled y/D and z/D. Panel F: A 2D plot showing streamwise vorticity in the y-z plane for N = 5, k = 0.5, Re = 125. The axes are labeled y/D and z/D. Panel G: A 2D plot showing streamwise vorticity in the y-z plane for N = 3, k = 0.4, Re = 135. The axes are labeled y/D and z/D. Panel H: A 2D plot showing streamwise vorticity in the y-z plane for N = 4, k = 0.3, Re = 140. The axes are labeled y/D and z/D. Panel I: A 2D plot showing streamwise vorticity in the y-z plane for N = 5, k = 0.5, Re = 125. The axes are labeled y/D and z/D.
3.3. The RSB state
The second bifurcation is of the Hopf type, following which the hydrodynamic forces acting on the plate become unstable but periodic. In the wake of the circular disk, the periodic shedding of two-sided hairpin vortices and the loss of the plane of symmetry are observed, which is referred to as the RSB mode (Shenoy & Kleinstreuer Reference Shenoy and Kleinstreuer2008; Fabre et al. Reference Fabre, Auguste and Magnaudet2008). Figure 9 shows that reflectional symmetry in the wake of the
 $N$
-sided plate is broken by vortex shedding and the downstream intertwining of counter-rotating vortices, as visualised by the
 $Q$
-criterion and axial vorticity. Figures 9(
 $c{,}g{,}k$
) display the vortex shedding angle, defined as
 $\theta =\text{atan}\,2(C_z,C_y)$
, which corresponds to the instantaneous orientation of the resultant lift force vector in the transverse
 $y{-}z$
plane, measured from the positive
 $y$
-axis. The dashed red lines mark the mean shedding direction about which this angle oscillates. It can be observed that the lift force of the disk-like plate oscillates around the mean direction, which are
 $120^\circ$
,
 $-135^\circ$
and
 $-143.8^\circ$
for
 $N=3,4,5$
, respectively. This confirms that for plates with 3 or 4 vertices, the vortex shedding plane aligns with one geometric symmetry plane. Notably, the
 $N=5$
case exhibits a mean oscillation direction (
 $-143.8^\circ$
) approaching one geometric symmetry plane (
 $-144^\circ$
), suggesting that geometric constraints remain influential even at higher vertex counts. Critically, while Chrust et al. Reference Chrust, Bouchet and Dušek2010 and Gao et al. Reference Gao, Tao, Tian and Yang2018 established that a circular disk’s lift oscillation plane is dictated by primary bifurcation, disk-like plates exhibit fundamentally different behaviour: their SR-state-selected reflection symmetry plane does not necessarily determine the oscillation plane.
Flow state characteristics in the RSB state for three parameter configurations:
 $(N, k, Re) =(3, 0.4, 175), (4, 0.5, 140), (5, 0.3, 145)$
. (
 $a,e,i$
) The isosurfaces of the
 $Q$
-criterion at
 $Q=0.05$
. (
 $b, f, j$
) The axial vorticity
 $\omega _x$
in the plane at
 $x/D = 0.5$
. (
 $c, g, k$
) The vortex shedding angle
 $\theta$
, defined as the direction of the lift force relative to the
 $y$
-axis in the
 $y{-}z$
plane. The mean shedding angle is indicated by the red dashed line. (
 $d, h, l$
) The
 $C_x$
–
 $C_y$
diagrams, indicating the periodicity of the wake.

Figure 9. Long description
Panel A: A 3D plot showing Q-criterion isosurfaces for N = 3, k = 0.4, Re = 175. The axes are labeled x/D, y/D, and z/D. Panel B: A 2D plot showing axial vorticity ωx in the plane x/D = 0.5 for N = 3, k = 0.4, Re = 175. The axes are labeled y/D and z/D. Panel C: A line graph showing the vortex shedding angle θ over time for N = 3, k = 0.4, Re = 175. The mean shedding angle is indicated by a red dashed line. The horizontal axis is time, and the vertical axis is θ. Panel D: A phase diagram showing the Cx–Cy relationship for N = 3, k = 0.4, Re = 175. The axes are labeled Cx and Cy. Panel E: A 3D plot showing Q-criterion isosurfaces for N = 4, k = 0.5, Re = 140. The axes are labeled x/D, y/D, and z/D. Panel F: A 2D plot showing axial vorticity ωx in the plane x/D = 0.5 for N = 4, k = 0.5, Re = 140. The axes are labeled y/D and z/D. Panel G: A line graph showing the vortex shedding angle θ over time for N = 4, k = 0.5, Re = 140. The mean shedding angle is indicated by a red dashed line. The horizontal axis is time, and the vertical axis is θ. Panel H: A phase diagram showing the Cx–Cy relationship for N = 4, k = 0.5, Re = 140. The axes are labeled Cx and Cy. Panel I: A 3D plot showing Q-criterion isosurfaces for N = 5, k = 0.3, Re = 145. The axes are labeled x/D, y/D, and z/D. Panel J: A 2D plot showing axial vorticity ωx in the plane x/D = 0.5 for N = 5, k = 0.3, Re = 145. The axes are labeled y/D and z/D. Panel K: A line graph showing the vortex shedding angle θ over time for N = 5, k = 0.3, Re = 145. The mean shedding angle is indicated by a red dashed line. The horizontal axis is time, and the vertical axis is θ. Panel L: A phase diagram showing the Cx–Cy relationship for N = 5, k = 0.3, Re = 145. The axes are labeled Cx and Cy.
Spectral analyses (fast Fourier transform, FFT) of force coefficients. (a) Strouhal numbers for the force coefficients
 $C_x$
(circles) and
 $C_y$
(triangles) of all
 $N=3$
plates, corresponding to the primary drag frequency and the fundamental vortex shedding frequency, respectively. (
 $b{-}c$
) The FFT spectra for an isosceles triangular plate (
 $N=3,\ k=0$
) at
 $Re=162$
and
 $183$
. Both cases exhibit dual spectral peaks in
 $C_x$
: at
 $Re=162$
, the dominant peak occurs at twice the shedding frequency; at
 $Re=183$
, this reverses, with the dominant peak synchronising to shedding frequency.

Figure 10. Long description
Panel A: A line graph shows Strouhal numbers for force coefficients Cx and Cy of all plates. The x-axis represents the Reynolds number (Re) ranging from 125 to 190, and the y-axis represents the Strouhal number (St) ranging from 0.1 to 0.26. Different colored lines and symbols represent various k values (0, 0.3, 0.4, 0.5, 0.8). The graph shows the primary drag frequency (circles) and the fundamental vortex shedding frequency (triangles). Panel B: A line graph displays the FFT spectra for an isosceles triangular plate at Re = 162. The x-axis represents the Strouhal number (St) ranging from 0.01 to 0.49, and the y-axis represents the FFT values. In the Cx spectrum, the dominant peak occurs at St≈0.234 (twice the shedding frequency), with a secondary peak at St≈0.117 (the shedding frequency). Panel C: A line graph shows the FFT spectra for an isosceles triangular plate at Re = 183. The x-axis represents the Strouhal number (St) ranging from 0.01 to 0.49, and the y-axis represents the FFT values. In the Cx spectrum, the dominant peak now occurs at St≈0.122 (the shedding frequency), while the peak at twice this frequency becomes secondary.
Near-wake vortex characteristics for isosceles triangular plates (
 $N=3,\ k=0$
) at
 $x/D=0.5$
, a streamwise location chosen to capture the vortex formation region where cycle-to-cycle core deformation is most clearly identifiable. Here,
 $T$
denotes the vortex shedding period. (a) Phase-progression of
 $Q$
-criterion isosurfaces at
 $Re=162$
. (b) Corresponding
 $Q$
-isosurface evolution at
 $Re=183$
. The solid line indicates the plate position. Vortex shedding angle (
 $\theta$
) time histories at (c)
 $Re=162$
and (d)
 $Re=183$
, with red dashed lines marking the mean angles. The transition from
 $Re=162$
to
 $Re=183$
is accompanied by an amplified cyclic rescaling of the vortex core and a drift of the mean shedding angle from
 $2.5^\circ$
to
 $13.2^\circ$
.

Figure 11. Long description
Panel A: A series of 2D plots showing Q-criterion isosurfaces at four phases of the shedding cycle (T/4, T/2, 3T/4, and T) for Re = 162. The axes are labeled y/D and z/D. The solid line indicates the plate position. The plots show the cyclic rescaling of the vortex core. Panel B: A series of 2D plots showing Q-criterion isosurfaces at four phases (3T/16, T/2, 13T/16, and T) for Re = 183. The axes are labeled y/D and z/D. The solid line indicates the plate position. The amplitude of the cyclic core rescaling is larger than at Re = 162. Panel C: A line graph showing the vortex shedding angle θ over time for Re = 162. The horizontal axis is time normalized by the shedding period T, and the vertical axis is θ. A red dashed line marks the mean angle at 2.5°. Panel D: A line graph showing the vortex shedding angle θ over time for Re = 183. The horizontal axis is time normalized by T, and the vertical axis is θ. A red dashed line marks the mean angle at 13.2°.
The
 $C_x$
–
 $C_y$
diagrams presented in figures 9(
 $d{,}h{,}l$
) distinctly illustrate a single closed-path butterfly-shaped attractor. This force signature confirms a periodic drag coefficient that oscillates at twice the vertex-shedding frequency, exhibiting a characteristic 2 : 1 lock-in, matching vortex dynamics of circular disks (Fabre et al. Reference Fabre, Auguste and Magnaudet2008). Crucially, this relationship persists across nearly all polygonal plates.
For the representative
 $N=3$
case in figure 10(a), the primary frequency of
 $C_x$
shows a range
 $0.222{-}0.245$
, while the primary frequency of
 $C_y$
range is 0.111–0.122. An anomalous frequency transition occurs exclusively in isosceles triangular plates (
 $N=3,\ k=0$
). As spectrum analyses in figures 10(
 $b{,}c$
) demonstrate, the drag coefficient for this plate exhibits dual dominant frequencies, i.e. the fundamental vortex shedding frequency and its second harmonic. At
 $Re=162$
, the primary drag frequency peaks at 0.234 (maintaining the 2 : 1 ratio), with a secondary peak at the fundamental frequency at 0.117. By
 $Re=183$
, this relationship reverses – the dominant drag frequency shifts to 0.122 (matching the shedding frequency), while the harmonic becomes subdominant. This represents a full transition from harmonic-dominated drag oscillations to those synchronised with the fundamental frequency as the Reynolds number increases.
To investigate the origin of the shift in the dominant drag frequency, the
 $Q$
-criterion isosurfaces are examined at
 $x/D=0.5$
(figures 11
 $a{,}b$
). This location lies within the near-wake vortex formation region where the instantaneous vortex core topology is most clearly resolved. At both Reynolds numbers, the vortex core exhibits a cyclic top–bottom alternation and a periodic rescaling in size, occurring twice per shedding cycle. At
 $Re=183$
, the amplitude of this cyclic core rescaling is notably larger than at
 $Re=162$
, indicating a more pronounced oscillation in the instantaneous lateral position of the shed vortices. This stronger spatial excursion of the vortex cores correlates with the enhanced low-frequency modulation of the drag force and the locking of the dominant
 $C_x$
frequency to the shedding frequency at the higher Reynolds number. Concurrently, the mean vortex shedding angle shifts from
 $2.5^\circ$
to
 $13.2^\circ$
(figures 11
 $c{,}d$
), revealing a progressively asymmetric oscillation of the wake. For an equilateral triangle, the early wake is known to exhibit a geometrically locked, symmetric vortex pattern (Higuchi et al. Reference Higuchi, Anderson and Zhang1996). In the present isosceles configuration, the inequality of the side lengths and apex angles breaks this geometric locking. The resulting asymmetry relaxes the pressure-gradient restoring mechanisms that would otherwise keep the shedding aligned with the symmetry plane of the plate, permitting larger lateral excursions of the vortex cores as the Reynolds number increases. These excursions, captured by the amplified core rescaling at
 $x/D=0.5$
, govern the low-frequency evolution of the drag.
3.4. The RSP state
The third bifurcation emerges with increasing Reynolds number, characterised by reflectional symmetry restoration and persistent periodic oscillations in the wake dynamics behind disk-like plates. This behaviour is similar to the symmetry plane recovery observed in the wake of a disk following the third bifurcation, as described by Shenoy and Kleinstreuer. As shown in figures 12(
 $a{,}e{,}i$
) and 12(
 $b{,}f{,}j$
), the
 $Q$
-criterion isosurfaces and the phase diagrams confirm that the reflectional symmetry plane of the wake is recovered, and the vortices shed alternately in the direction perpendicular to the plane of symmetry. The phase diagrams depicted in figures 12(
 $c{,}g{,}k$
) make the periodic characteristic of the wake clear, and indicate that the lift force is oscillating around mean value zero in this state, the same phenomenon has been reported in the RSP state for a circular disk (Fabre et al. Reference Fabre, Auguste and Magnaudet2008; Shenoy & Kleinstreuer Reference Shenoy and Kleinstreuer2008; Auguste et al. Reference Auguste, Fabre and Magnaudet2010).
Flow state characteristics in the RSP state for three configurations with varying numbers of edges:
 $(N, k, Re) = (2, 0.4, 220), (4, 0.3, 180), (5, 0, 180)$
. (
 $a,e,i$
) The isosurfaces of the
 $Q$
-criterion at
 $Q = 0.01$
, illustrating the symmetric vortex shedding. (
 $b,f,j$
) and (
 $c,g,k$
) The phase diagrams, indicating the periodic nature and symmetry of the wake. (
 $d,h,l$
) The fast Fourier transforms (FFTs) of the force coefficients. Specifically, the FFTs of
 $C_y$
or
 $C_z$
correspond to the vortex shedding frequency, while the FFT of
 $C_x$
corresponds to the drag frequency.

Figure 12. Long description
Panel A: A 3D plot shows isosurfaces of the Q-criterion for a configuration with two edges. The axes are labeled y/D, z/D, and x/D, indicating the spatial dimensions. The plot illustrates symmetric vortex shedding. Panel B: A phase diagram shows the periodic nature of the wake for the same configuration. The axes are labeled C_z and C_y, representing force coefficients. Panel C: A line graph shows the force coefficients over time, with C_y values plotted against C_x values. Panel D: A fast Fourier transform (FFT) graph displays the frequency spectrum of the force coefficients. Peaks are visible at St values of 0.098 and 0.195, corresponding to vortex shedding and drag frequencies. Panel E: A 3D plot shows isosurfaces of the Q-criterion for a configuration with four edges. The axes are labeled y/D, z/D, and x/D. Panel F: A phase diagram shows the periodic nature of the wake for this configuration. The axes are labeled C_z and C_y. Panel G: A line graph shows the force coefficients over time, with C_z values plotted against C_x values. Panel H: An FFT graph displays the frequency spectrum of the force coefficients. Peaks are visible at St values of 0.115 and 0.229, corresponding to vortex shedding and drag frequencies. Panel I: A 3D plot shows isosurfaces of the Q-criterion for a configuration with five edges. The axes are labeled y/D, z/D, and x/D. Panel J: A phase diagram shows the periodic nature of the wake for this configuration. The axes are labeled C_z and C_y. Panel K: A line graph shows the force coefficients over time, with C_y values plotted against C_x values. Panel L: An FFT graph displays the frequency spectrum of the force coefficients. Peaks are visible at St values of 0.115 and 0.229.
Variation of the axial vorticity on the plane at
 $x/D = 0.5$
over one vortex shedding period for the even-sided (
 $N=4,\ k=0.3,\ Re=180$
) and odd-sided (
 $N=5,\ k=0,\ Re=180$
) disk-like plates.

Figure 13. Long description
Panel A: A 2D contour plot showing axial vorticity at the plane x/D = 0.5 at phase T/2 of the shedding cycle for an even-sided plate (N = 4, k = 0.3, Re = 180). The axes are labeled y/D and z/D. Solid lines denote positive vorticity and dashed lines denote negative vorticity. Panel B: A 2D contour plot showing axial vorticity at the plane x/D = 0.5 at phase T for the same plate (N = 4, k = 0.3, Re = 180). The axes are labeled y/D and z/D. Panel C: A 2D contour plot showing axial vorticity at the plane x/D = 0.5 at phase T/2 of the shedding cycle for an odd-sided plate (N = 5, k = 0, Re = 180). The axes are labeled y/D and z/D. Panel D: A 2D contour plot showing axial vorticity at the plane x/D = 0.5 at phase T for the same plate (N = 5, k = 0, Re = 180). The axes are labeled y/D and z/D.
The uRSP state characteristics for
 $N=2$
,
 $k=0.4$
and
 $Re=177$
. (
 $a ,b$
) Vortical structures visualised from two distinct orientations exhibit symmetry about the
 $y=0$
plane via
 $\omega _x = \pm 0.15U_\infty /D$
isosurfaces. (c) Temporal evolution of force coefficients, confirming steady-state drag. (d) The FFT spectrum of
 $C_z$
, revealing the dominant vortex shedding frequency components.

Figure 14. Long description
Panel A: A 3D plot showing vorticity isosurfaces at ωx = ±0.15U∞/D for an elliptic plate (N = 2, k = 0.4, Re = 177), viewed from one orientation. The axes are labeled x/D, y/D, and z/D. Panel B: A 3D plot showing the same vorticity isosurfaces viewed from a second orientation. The axes are labeled x/D, y/D, and z/D. The symmetry about the y = 0 plane is visible. Panel C: A line graph showing the temporal evolution of the force coefficients Cx, Cy, and Cz for the same configuration. The horizontal axis is time, and the vertical axis is the force coefficient. The drag coefficient Cx remains steady. Panel D: A line graph showing the FFT spectrum of Cz. The horizontal axis is the Strouhal number St, and the vertical axis is the FFT amplitude. A dominant peak occurs at St=0.167, corresponding to the primary vortex shedding frequency.
Variation of the axial vorticity on the plane at
 $x/D = 4$
over one period for the disk-like plate at
 $N=2,\ k=0.4,\ Re=177$
, showing a balanced total of positive and negative vortices, with no net change throughout the entire vortex shedding cycle.

Figure 15. Long description
Panel A: A 2D color contour plot showing the variation of axial vorticity on the plane x/D = 4 at t = T/6 for N = 2, k = 0.4, Re = 177. The x-axis is labeled y/D and the y-axis is labeled z/D. The color scale ranges from -0.2 to 0.2, with blue indicating negative vorticity and red indicating positive vorticity. Panel B: A 2D color contour plot showing the variation of axial vorticity on the plane x/D = 4 at t = T/3 for N = 2, k = 0.4, Re = 177. The x-axis is labeled y/D and the y-axis is labeled z/D. The color scale ranges from -0.2 to 0.2, with blue indicating negative vorticity and red indicating positive vorticity. Panel C: A 2D color contour plot showing the variation of axial vorticity on the plane x/D = 4 at t = T/2 for N = 2, k = 0.4, Re = 177. The x-axis is labeled y/D and the y-axis is labeled z/D. The color scale ranges from -0.2 to 0.2, with blue indicating negative vorticity and red indicating positive vorticity. Panel D: A 2D color contour plot showing the variation of axial vorticity on the plane x/D = 4 at t = 2T/3 for N = 2, k = 0.4, Re = 177. The x-axis is labeled y/D and the y-axis is labeled z/D. The color scale ranges from -0.2 to 0.2, with blue indicating negative vorticity and red indicating positive vorticity. Panel E: A 2D color contour plot showing the variation of axial vorticity on the plane x/D = 4 at t = 5T/6 for N = 2, k = 0.4, Re = 177. The x-axis is labeled y/D and the y-axis is labeled z/D. The color scale ranges from -0.2 to 0.2, with blue indicating negative vorticity and red indicating positive vorticity. Panel F: A 2D color contour plot showing the variation of axial vorticity on the plane x/D = 4 at t = T for N = 2, k = 0.4, Re = 177. The x-axis is labeled y/D and the y-axis is labeled z/D. The color scale ranges from -0.2 to 0.2, with blue indicating negative vorticity and red indicating positive vorticity. The plot shows a balanced total of positive and negative vorticity, with no net change throughout the shedding cycle.
Fast Fourier transforms (FFTs) of the force coefficients are shown in figures 12(
 $d{,}h{,}l$
). For all disk-like plates, the transverse force component oscillates at the primary vortex shedding frequency (period
 $T$
), while the persistent
 $2:1$
ratio between drag oscillation frequency and vortex shedding frequency is maintained – a characteristic inherited from preceding flow states. Notably, in pentagonal plates (
 $N=5$
), an anomalous low-frequency mode emerges in the drag coefficient at exactly the fundamental vortex shedding frequency (figure 12
 $l$
). This low-frequency resonance produces a distinct asymmetry in the butterfly-like attractor of the phase portrait. As illustrated in figure 13 for
 $N=4$
and
 $N=5$
at the
 $x/D=0.5$
plane, the parity of the vertex count controls the instantaneous vorticity distribution: plates with an even number of vertices recover an equivalent distribution after one shedding period, whereas plates with an odd number of vertices cannot, giving rise to a subharmonic modulation visible as the low-frequency peak. This mechanism produces a dual-frequency drag signature: the primary peak at twice the shedding frequency (
 $St \approx 0.229$
) coexists with a lower frequency component at the shedding frequency itself (
 $St \approx 0.115$
). This dual-frequency signature is reminiscent of the observations of Fail et al. (Reference Fail, Lawford and Eyre1957) on rectangular plates, where two distinct side lengths produce two different shedding frequencies. In the present pentagonal case, however, the second frequency originates not from multiple length scales, but from an odd–even parity effect that breaks the temporal symmetry of the wake.
For the disk-like plate with
 $N =2$
and
 $k =0.4$
, a uRSP state is observed within the range
 $170 \leq Re \lt 200$
. This state is characterised by periodic vortex shedding and the presence of reflectional symmetry, which is why we classify this state as an RSP flow pattern. As seen in the flow pattern characteristics for
 $Re = 177$
in figures 14(a) and 14(b), two pairs of ribbon-like vortices are shed periodically, and the layered vortical structures are observed. The symmetry plane is located at the
 $y = 0$
plane, which is parallel to the minor axis of the elliptical plate. However, it is noted that the drag remains constant, as depicted in figure 14(c). Despite the periodic vortex shedding in the wake at a constant frequency, there is no corresponding periodic oscillations in drag. To elucidate the mechanism behind this phenomenon more comprehensively, we present the dynamic changes in axial vorticity at the plane
 $x/D=4$
over a complete vortex shedding cycle, as shown in figure 15. It can be observed that during the process of vortex shedding in the wake, the vorticity distribution on this plane maintains an equal quantity of change, resulting in a constant drag force.
3.5. The CS
As the Reynolds number increases, flow past disk-like plates undergoes progressive destabilisation, culminating in the CS, as mapped in figure 7. For all configurations except
 $N=3$
, the system goes through an RSP state that restores both periodicity and reflectional symmetry, then loses both to become chaotic. In contrast, for
 $N=3$
, reflectional symmetry is already absent in the RSB state, so the transition to chaos only needs the loss of periodicity.
The CS flow characteristics demonstrating order–disorder transition: (
 $a,c,d$
) configuration
 $(N, k, Re) = (5, 0, 190)$
; (
 $b,e,f$
) configuration
 $(N, k, Re) = (5, 0, 210)$
. (a,b) Vortical structures of
 $\omega _x = \pm 0.2U_\infty /D$
isosurfaces. (c,e) The
 $C_x$
–
 $C_y$
diagrams. (d,f) The FFTs of
 $C_x$
.

Figure 16. Long description
Panel A: A 3D plot showing vorticity isosurfaces at ωx = ±0.2U∞/D for N = 5, k = 0, Re = 190. The axes are labeled x/D, y/D, and z/D. Panel B: A 3D plot showing vorticity isosurfaces at ωx = ±0.2U∞/D for N = 5, k = 0, Re = 210. The axes are labeled x/D, y/D, and z/D. Panel C: A phase diagram showing the C_x–C_y relationship for N = 5, k = 0, Re = 190. The axes are labeled C_x and C_y. Panel D: A line graph showing the FFT spectrum of C_x for N = 5, k = 0, Re = 190. The horizontal axis is the Strouhal number St, and the vertical axis is the FFT amplitude. Panel E: A phase diagram showing the C_x–C_y relationship for N = 5, k = 0, Re = 210. The axes are labeled C_x and C_y. Panel F: A line graph showing the FFT spectrum of C_x for N = 5, k = 0, Re = 210. The horizontal axis is St, and the vertical axis is the FFT amplitude.
Figure 16 illustrates the vortex structures and phase diagrams of plates in the CS, clearly manifesting their disorder. With the increase in the Reynolds number, the rotational entanglement within the wake vortices becomes increasingly evident (figure 16
b), which could be a precursor of the helical vortex structures observed at higher Reynolds numbers (Berger et al. Reference Berger, Scholz and Schumm1990). Crucially, even after reflectional symmetry breakdown, the drag force retains significant periodic coherence. The quasi-periodicity observed in the phase diagram (figure 16
c) mirrors the behaviour reported by figure 8(a) in Auguste et al. (Reference Auguste, Fabre and Magnaudet2010). As evidenced by the spectral analyses in figures 16(
 $d{,} f$
), the dominant frequencies initially remain consistent with those observed prior to bifurcation (e.g.
 $St=0.115$
and 0.229 for
 $C_x$
in figure 12
k), indicating that the odd-sided plates continue to resonate at the primary vortex shedding frequency. Subsequently, the wake exhibits a wide range of low-frequency oscillations with varying amplitudes (figure 16
f), which collectively form a contiguous spectrum. Gradually, these distributed low-frequency components gain energy and eventually supplant the original dominant modes, reflecting a progressive strengthening of lower frequencies in the wake. This low-frequency unsteadiness aligns with work on vortex shedding unsteadiness in normal flat plates (Najjar & Balachandar Reference Najjar and Balachandar1998), serving as an early precursor to full chaos development.
4. Discussion
The flow characteristics are governed by the Reynolds number
 $Re$
and two geometric parameters: the vertex count
 $N$
, and the compression ratio
 $k$
. For
 $N \leq 3$
,
 $N$
plays a dominant role, directly determining whether intermediate flow states (such as the RSB or RSP regimes) exist prior to the onset of chaos. These geometric influences produce three distinct classes of wake behaviour – elliptic (
 $N=2$
), triangular (
 $N=3$
) and square/pentagonal (
 $N=4,5$
) – which are discussed in turn below. Figure 17 summarises the axial vorticity distributions on the
 $x/D=0.5$
plane for all disk-like plates at several representative Reynolds numbers. The critical Reynolds numbers
 $Re_{c}$
between successive flow regimes are marked by the dashed lines in figure 6 and serve as quantitative references throughout the discussion.
Axial vorticity distributions at
 $x/D=0.5$
for disk-like plates across four different Reynolds numbers. Contour lines denote positive (solid) and negative (dashed) vorticity at levels
 $\omega _x = \pm 0.15U_\infty /D$
; regions with vorticity magnitude below this threshold are not visualised. The grey block represents the geometry and location of the plate. Dashed dividing lines separate distinct flow regimes. For the isosceles triangular plate (
 $N=3,\ k=0$
), the actual Reynolds numbers are slightly different (125, 146, 162 and 177, respectively), and are plotted under the nearest common column for comparison.

Figure 17. Long description
A grid of vorticity distributions for disk-like plates with varying Reynolds numbers and aspect ratios. The grid is divided into sections with different flow regimes. Each cell in the grid shows the vorticity distribution around a plate, with solid lines indicating positive vorticity and dashed lines indicating negative vorticity. The grey block represents the geometry and location of the plate.
4.1. Elliptic plates,
 $N=2$

Pressure coefficient field and streamlines for the elliptic plate at
 $N=2,\ k=0.4,\ Re=177$
in the uRSP state. (a,b) Two phase instants over one shedding cycle in the minor-axis plane (
 $y/D=0$
), showing alternating vortex shedding. (c) Schematic of the plate, with black dashed lines indicating the symmetry planes
 $y/D=0$
and
 $z/D=0$
, where a and b denote the lengths of the major and minor axes, respectively. (d) Time-averaged flow in the major-axis plane (
 $z/D=0$
), which remains nearly steady owing to reflectional symmetry about the minor-axis plane. The wake widths
 $L_b$
and
 $L_a$
, defined as the time-averaged total lateral span of the recirculation zone, are indicated in (a) and (d), respectively.

Figure 18. Long description
Panel A: A 2D filled contour plot showing the pressure coefficient field C_p overlaid with streamlines in the minor-axis plane (y/D = 0) at phase T/2 of the shedding cycle for N = 2, k = 0.4, Re = 177. The axes are labeled x/D and z/D. The color scale ranges from −0.6 to 0.4. The wake width L_b is indicated. Panel B: A 2D filled contour plot showing the pressure coefficient field C_p overlaid with streamlines in the minor-axis plane (y/D = 0) at phase T of the shedding cycle for the same configuration. The axes are labeled x/D and z/D. The color scale ranges from −0.6 to 0.4. The alternating vortex shedding is visible. Panel C: A schematic of the elliptic plate showing the major axis a and minor axis b. Black dashed lines indicate the symmetry planes y/D = 0 and z/D = 0. Panel D: A 2D filled contour plot showing the time-averaged pressure coefficient field and streamlines in the major-axis plane (z/D = 0) for the same configuration. The axes are labeled x/D and y/D. The wake width La is indicated.
The axis switching in the wake observed with parameters
 $N=2,\ k=0.5,\ Re=250$
in the CS. The planes (a)
 $x/D=0.5$
and (b)
 $x/D=6$
are taken from the isosurfaces of
 $\omega _x = \pm 0.15U_\infty /D$
for a elliptic plate. The crossed dotted lines indicate the instantaneous major and minor axes of the vortical structures.

Figure 19. Long description
A 3D plot showing the isosurfaces of vortex structures around an elliptic plate. The axes are labeled x/D, y/D, and z/D. The plot shows red and blue regions indicating different vortex structures. Panel A: A 2D cross-sectional view of the vorticity distribution at the plane x/D = 0.5. The axes are labeled y/D and z/D. Dotted crossed lines indicate the instantaneous major and minor axes of the vortical structures. Panel B: A 2D cross-sectional view of the vorticity distribution at the plane x/D = 6. The axes are labeled y/D and z/D. Dotted crossed lines indicate the instantaneous major and minor axes.
For elliptic plates, the sequence of wake transitions depends sensitively on the compression ratio
 $k$
(figures 6 and 17). At
 $k=0.4$
, the wake evolves as SG
 $\rightarrow$
uRSP
 $\rightarrow$
RSP
 $\rightarrow$
CS; at
 $k=0.5$
, the uRSP state disappears, leaving SG
 $\rightarrow$
RSP
 $\rightarrow$
CS; at
 $k=0.8$
, the sequence becomes SG
 $\rightarrow$
SR
 $\rightarrow$
RSB
 $\rightarrow$
RSP
 $\rightarrow$
CS, closely resembling that of a circular disk.
The key to understanding the appearance or suppression of the uRSP state lies in the competition between the wake spreading along the major and minor axes. We define the wake widths
 $L_a$
and
 $L_b$
as the time-averaged total lateral span of the recirculation zone (see figures 18
 $(a{,}d)$
for illustration) along the major and minor axes, respectively. At
 $Re=177$
and
 $k=0.4$
, the normalised wake widths are
 $L_b/b \approx 1.98$
and
 $L_a/a \approx 1.15$
. The much larger relative width along the minor axis, together with the stronger adverse pressure gradient on the higher-curvature minor-axis edges, promotes earlier separation, and initiates periodic vortex shedding predominantly in the minor-axis plane, while the major-axis wake remains symmetric and attached. This is precisely the uRSP state: alternating shedding along the minor axis, reflectional symmetry about the minor-axis plane, and a drag coefficient that remains essentially steady – the local pressure on the rear surface fluctuates with the alternating shedding, but these fluctuations cancel upon spatial integration, yielding a nearly constant total drag (see figure 15). Figures 18(
 $a{,}b$
) show the pressure field and streamlines in the minor-axis plane at
 $Re=177$
, where the alternating vortex shedding is clearly visible while the centreline streamline remains nearly stationary, consistent with the cancellation of the integrated pressure fluctuations.
As
 $Re$
increases to 200,
 $L_a/a$
grows to approximately
 $1.19$
while
 $L_b/b$
reaches 2.02. Although the normalised wake width along the major axis remains smaller than that along the minor axis, the major-axis wake has acquired sufficient spatial extent to support organised vortex shedding, and the flow enters a transitional regime where shedding occurs in both planes. By
 $Re=220$
,
 $L_a/a$
reaches
 $\approx 1.20$
, and
 $L_b/b \approx 1.93$
, and the major-axis wake supports larger-scale vortex structures that shed alternately and become dominant, establishing the ordinary RSP state. The stabilisation of large-scale alternating vortices along the major axis delays the onset of the CS relative to the circular disk case.
The same logic explains the behaviour at other
 $k$
. At
 $k=0.5, Re=180$
,
 $L_a/a \approx 1.32$
and
 $L_b/b \approx 1.9$
, so the major-axis shedding dominates from the outset, and no uRSP state is observed. At
 $k=0.8,\ Re=160$
, the plate is nearly circular,
 $L_a/a \approx 1.49$
and
 $L_b/b \approx 1.55$
are close, and the wake dynamics becomes dominated by inertial and vortex-induction effects, allowing the SR and RSB states to appear before RSP, as in the circular disk case.
Moreover, axis switching in the wake is observed for the elliptic plate in the CS, as shown in figure 19. In the near wake (
 $x/D=0.5$
, figure 19
a), the major and minor axes of the elliptical vorticity distribution are aligned with those of the body. Further downstream (
 $x/D=6$
, figure 19
b), the vorticity distribution becomes approximately elliptical again, but with the major axis aligned with the minor axis of the body. The streamwise location of axis switching is sensitive to
 $k$
: at
 $k=0.8$
, the cross-over moves upstream to
 $x/D \approx 4$
, while at
 $k=0.4$
, it is delayed to
 $x/D \approx 7$
. This axis switching occurs only in the CS, after the loss of the reflectional symmetry that constrains the wake orientation in the RSP regimes. The switching originates from the non-uniform curvature of the elliptical vorticity distribution in the near wake, which produces non-uniform self-induced velocities that cause the minor-axis extent to grow faster than the major-axis extent with downstream distance, ultimately swapping the wake orientation. Kiya & Abe (Reference Kiya and Abe1999) documented a similar axis-switching for elliptic plates of aspect ratios 2 and 3, occurring at
 $x/D \approx 4.0$
–
 $4.5$
. This mechanism – non-uniform self-induced velocities on a non-circular vorticity distribution – is the same as that responsible for axis switching in non-circular jets (Miller et al. Reference Miller, Madnia and Givi1995), although here it operates in the presence of a solid body and fixed separation edges.
Strouhal number
 $St$
distribution of disk-like plates in the RSB and RSP states. Marker shape indicates vertex count
 $N$
, and marker colour denotes compression ratio
 $k$
. The black dashed rectangle encloses the dense cluster of data points in the region
 $Re \in (125,190),\ St \in (0.105,0.135)$
; a magnified view of this region is provided in the inset. The solid circle markers refer to data from Kiya & Abe (Reference Kiya and Abe1999) for a thick elliptical plate (
 $k=0.5$
,
 $Re=200$
), capturing two frequencies linked to hairpin vortex shedding from the minor axis, and wake meandering along the major axis. The red solid squares represent reference data from Zhao et al. (Reference Zhao, Gao, Zhang, Guo, Li and Tian2021) for flow past a square plate at
 $Re = 150$
and
 $170$
.

The Strouhal numbers of disk-like plates are collected in figure 20. The disk-like plate with
 $N = 2$
exhibits a richer behaviour than the higher-
 $N$
cases. In the uRSP state (
 $k = 0.4$
and 0.5), the Strouhal number is nearly constant at 0.167–0.171. In the ordinary RSP state, the Strouhal number shows a mild variation with
 $Re$
from 0.088 to 0.101. While not strictly independent of
 $Re$
, this variation remains small compared with the abrupt jump in the dominant shedding frequency that separates the RSP and uRSP regimes. Based on the periodic variations in axial vorticity at the
 $x/D=4$
plane as illustrated in figures 15 and 21, we observe that in the uRSP state, the wake vortices exhibit reflectional symmetry about the minor-axis plane. In contrast, in the RSP state, the wake vortices remain symmetric with respect to the major-axis plane. Because the distribution range of the vortex structures in the direction of the minor axis is narrower compared to that of the major axis, the vortex shedding period in the uRSP state is shorter, leading to a higher dominant frequency. Additionally, Kuo & Baldwin (Reference Kuo and Baldwin1967) conducted wind tunnel experiments on the elliptical plate with eccentricity (ratio of minor to major axes) 0.6, and reported Strouhal number 0.168. Notably, at
 $k=0.4$
and
 $Re = 200$
, a transition occurs where both flow states coexist. In a related study, Kiya & Abe (Reference Kiya and Abe1999) described how thick elliptical plates exhibit periodic roll-up of hairpin vortices originating alternately from the minor-axis plane, accompanied by wake meandering along the major-axis direction – each mechanism corresponding to a distinct Strouhal number. The quantitative differences in
 $St$
between these studies are likely attributable to the different diameter–thickness aspect ratios and Reynolds numbers considered.
Evolution of the axial vorticity over one period on the plane at
 $x/D = 4$
for the disk-like plate with parameters
 $N=2,\ k=0.4,\ Re=230$
in the RSP state. The flow preserves reflectional symmetry about the major-axis plane, with vortex structures displaying an extended distribution along this direction, which yields a lower dominant shedding frequency.

Figure 21. Long description
Panel A: A 2D filled contour plot showing the axial vorticity on the plane x/D = 4 at phase T/4 of the shedding cycle for N = 2, k = 0.4, Re = 230. The axes are labeled y/D and z/D. Solid lines denote positive vorticity and dashed lines denote negative vorticity. Panel B: A 2D filled contour plot showing the axial vorticity on the plane x/D = 4 at phase T/2 for the same configuration. The axes are labeled y/D and z/D. Panel C: A 2D filled contour plot showing the axial vorticity on the plane x/D = 4 at phase 3T/4 for the same configuration. The axes are labeled y/D and z/D. Panel D: A 2D filled contour plot showing the axial vorticity on the plane x/D = 4 at phase T for the same configuration. The axes are labeled y/D and z/D.
4.2. Triangular plates,
$N=3$

For
 $N=3,\ k=0$
, the plate is an isosceles triangle possessing only a single reflectional symmetry plane (
 $z/D=0$
). Because the geometry lacks rotational symmetry, the wake cannot support the SG state; instead, it directly enters the SR state, in which the wake retains the same unique symmetry plane as the plate. For
 $k \geq 0.3$
, the plate possesses threefold rotational symmetry, and the wake first passes through the SG state before transitioning to SR. In both cases, as the Reynolds number increases, the wake undergoes a rapid transition to the RSB state. No RSP state is observed for any
 $k \leq 0.5$
; at
 $k=0.8$
, the wake begins to approach the disk RSP structure (see figure 17,
 $Re=160$
), yet a complete recovery of reflectional symmetry is not attained.
Pressure coefficient field in the symmetry plane (
 $z/D=0$
) for the isosceles triangular plate (
 $N=3,\ k=0$
) over one shedding cycle. (a) Four phases at
 $Re=162$
: low-pressure regions form alternately on the base-edge side and the apex side, producing two distinct pulsations per cycle, and a dominant drag response at twice the shedding frequency. (b) Corresponding phases at
 $Re=183$
: the pressure amplitude difference between successive shedding events is much reduced, and the pressure field oscillates predominantly at the shedding frequency itself. The labels ‘base-edge side’ and ‘apex side’ indicate the two sides of the symmetry plane.

Figure 22. Long description
Panel A: Four contour plots showing the pressure coefficient field in the symmetry plane (z/D = 0) for the isosceles triangular plate (N = 3, k = 0) at Re = 162. The four phases are T/4, T/2, 3T/4, and T. The axes are labeled x/D and y/D. The labels ‘base-edge side’ and ‘pex side’ are indicated. Panel B: Four contour plots showing the pressure coefficient field in the same symmetry plane for the same plate at Re = 183. The four phases are 0.16T, 0.46T, 0.76T, and T. The axes are labeled x/D and y/D.
Vortex shedding and directional locking for the triangular plate at
 $N=3,\ k=0.5,\ Re=170$
in the RSB state. (a) Schematic of the plate, with the black dashed line marking the symmetry plane
 $z/D=0$
; the leader lines indicate the apex side and the base-edge side referred to in the pressure contours. (
 $b{-}e$
) Pressure coefficients and streamlines in the plane
 $z/D=0$
at four phases over one shedding cycle, showing alternating vortex shedding from the apex and base-edge sides, and the downstream convection of the low-pressure zone. (f) Streamwise vorticity
 $\omega _x$
and in-plane streamlines at
 $x/D=6$
; the white dashed line marks one geometric symmetry axis of the plate, which coincides with the mean shedding direction.

Figure 23. Long description
Panel A: A schematic diagram of a triangular plate with a black dashed line marking the symmetry plane. Leader lines indicate the apex side and the base-edge side. Panel B: A contour plot showing pressure coefficients and streamlines in the plane at one phase over one shedding cycle, with alternating vortex shedding from the apex and base-edge sides. The x-axis is labeled x/D and the y-axis is labeled y/D. Panel C: A contour plot showing pressure coefficients and streamlines at another phase over one shedding cycle. The x-axis is labeled x/D and the y-axis is labeled y/D. Panel D: A contour plot showing pressure coefficients and streamlines at yet another phase over one shedding cycle. The x-axis is labeled x/D and the y-axis is labeled y/D. Panel E: A contour plot showing pressure coefficients and streamlines at the final phase over one shedding cycle. The x-axis is labeled x/D and the y-axis is labeled y/D. Panel F: A contour plot showing streamwise vorticity and in-plane streamlines at a specific plane. The x-axis is labeled y/D and the y-axis is labeled z/D.
A prominent feature of the isosceles triangular wake is the Reynolds-number-driven shift of the dominant drag frequency. As shown in figures 10(
 $b{,}c$
), at
 $Re=162$
, the drag coefficient oscillates primarily at twice the vortex shedding frequency 0.234, with a secondary peak at the shedding frequency itself 0.117. By
 $Re=183$
, the hierarchy reverses: the dominant frequency becomes the shedding frequency at 0.122, and the second harmonic becomes subdominant. This transition is accompanied by an amplified cyclic rescaling of the vortex core in the near wake (figures 11
 $a{,}b$
), indicating stronger lateral excursions of the shed vortices at the higher Reynolds number.
To further examine this frequency shift, figure 22 presents the pressure coefficient field
 $C_p$
in the symmetry plane
 $z/D=0$
over one shedding cycle for both Reynolds numbers. At
 $Re=162$
, low-pressure regions form alternately on the base-edge side and the apex side; because each side produces one pronounced low-pressure event per shedding cycle, the drag coefficient experiences two distinct pulsations per cycle, producing a dominant response at twice the shedding frequency. At
 $Re=183$
, the pressure amplitude difference between successive shedding events diminishes significantly, and the pressure field oscillates predominantly at the shedding frequency itself, confirming that the drag fluctuation locks to the fundamental shedding frequency at the higher Reynolds number. The wake of the isosceles triangle does not lock to a fixed orientation. As reported in figures 11(
 $c{,}d$
), the mean vortex shedding angle drifts from
 $2.5^\circ$
at
 $Re=162$
to
 $13.2^\circ$
at
 $Re=183$
, and the deviation becomes even larger in the CS, indicating a progressive loss of directional coherence.
Figure 23 examines the case
 $N=3,\ k=0.5,\ Re=170$
in the RSB state. Pressure contours and streamlines in the plane
 $z/D=0$
over one period reveal that vortex shedding occurs alternately from the apex side and the base-edge side. The vortex originating from the apex tends to remain attached to the rear face for a longer portion of the cycle, whereas the vortex from the base-edge side detaches with a wider lateral and downstream extent; the associated low-pressure zone detaches from the rear surface and is carried downstream together with the shed vortex. This behaviour, observed in two of the three symmetry planes of the triangular plate, indicates that the triangular geometry imposes a strong orientational constraint on the generation and release of the shed vortices.
For
 $k=0.3, 0.4, 0.5$
, this orientational constraint leads to a persistent locking of the vortex shedding direction. The mean shedding angle remains confined to approximately
 $\pm 120^\circ$
in both the RSB and CS regimes (see e.g. figure 23
f). At
 $k=0.8$
, the locking disappears and the wake direction becomes more random as the plate geometry approaches that of a circular disk. In contrast, for the isosceles plate (
 $k=0$
), the lack of rotational symmetry prevents any such locking; the mean shedding angle drifts with Reynolds number, and becomes highly variable in the CS.
The absence of a fixed shedding direction in the isosceles case, and the strong
 $\pm 120^\circ$
locking in the equilateral cases, have direct consequences for the wake structure. The persistent directional constraint of the equilateral plates prevents the wake from developing the freely reorientable vorticity distribution required for axis switching. Instead, the sharp corners fix the separation points and stabilise the large-scale vortex orientation, suppressing the lateral spreading mechanism observed in the elliptic wake. Hence no axis switching occurs for any
 $N=3$
plate, regardless of whether the shedding direction is locked or slowly drifting.
Taken together, the behaviour of the
 $N=3$
plates across the studied range for
 $k$
reveals a systematic trend. At
 $k=0$
, the isosceles geometry lacks threefold rotational symmetry, and does not provide equivalent preferred azimuthal directions, resulting in a drifting wake angle with
 $Re$
. For
 $k=0.3$
–
 $0.5$
, the threefold rotational symmetry imposes robust directional locking at approximately
 $\pm 120^\circ$
. At
 $k=0.8$
, this locking is lost as the weakened anchoring effect with the blunted corners is overcome by inertial effects. This geometric control of wake orientation provides a controlled low-Reynolds-number illustration of the broader sensitivity of asymmetric separated flows to geometric perturbations discussed by Williams & Smits (Reference Williams and Smits2025). We therefore emphasise that the present results provide a controlled framework for isolating the geometric origin and selection of asymmetric wake states, while also providing a basis for future studies at higher Reynolds numbers and in more complex turbulent configurations. Whether the specific bifurcation mechanisms identified here persist, or interact with additional instability mechanisms, at higher Reynolds numbers remains an open question.
4.3. Quadrilateral and pentagonal plates,
$N=4, 5$

For quadrilateral (
 $N = 4$
) and pentagonal (
 $N=5$
) plates, the wake transition sequence encompasses all five flow regimes – SG, SR, RSB, RSP, CS – closely following the canonical disk scenario (figures 6
 $c{,}d$
). This contrasts with the elliptic and triangular cases, where at least one regime is skipped, and indicates that for
 $N \geq 4$
, the transition pathway converges towards that of the circular disk.
The spectral content of the drag coefficient, already analysed in figures 12 and 13, exhibits a systematic parity dependence: plates with an even
 $N$
display a single dominant frequency at twice the shedding frequency, whereas those with an odd
 $N$
develop an additional subharmonic component at the fundamental shedding frequency, consistent with the parity-governed vorticity recovery mechanism discussed in § 3.4. The square and pentagonal plates conform to this rule.
As the compression ratio
 $k$
increases from 0 to 1, the square and pentagonal plates become progressively more disk-like: the corners are blunted, the separation points are less firmly pinned, and the critical Reynolds numbers for all transitions decrease (figure 6). This trend mirrors that described for the elliptic and triangular plates, confirming that
 $k$
acts as a secondary modulator of the wake stability for all
 $N$
studied. At
 $k=0.8$
, the symmetry planes of the wake begin to deviate from the geometric symmetry planes of the plate for
 $N \geq 3$
(see e.g. the rotated vorticity distributions in figure 17), indicating that at high compression ratios, the flow symmetry is increasingly self-organised – dominated by inertial effects rather than by the plate geometry.
For
 $N \geq 3$
, the primary shedding frequency in both the RSB and RSP regimes is confined to a narrow band
 $St \approx 0.11{-}0.14$
(see figure 20), irrespective of the vertex count
 $N$
and compression ratio
 $k$
, and Reynolds number
 $Re$
within each regime. This insensitivity is consistent with the experiments of Fail et al. (Reference Fail, Lawford and Eyre1957), who reported Strouhal numbers 0.115 for a normal square plate, and
 $0.115$
–
 $0.117$
for an equilateral triangular plate. More recently, Zhao et al. (Reference Zhao, Gao, Zhang, Guo, Li and Tian2021) measured Strouhal numbers for a square plate at
 $Re = 155$
and
 $170$
, which also align with the current computations, as indicated by the red solid squares in the figure.
The present study was partly motivated by a question posed by Moffatt (Reference Moffatt2013): would a wavy edge of a circular disk alter its transition scenario? Although our study cannot provide a direct answer, the parametric exploration of
 $N$
and
 $k$
indicates that the perimeter geometry can substantially delay the onset of chaos when the departure from the circular shape is sufficiently pronounced – as seen most clearly for the elliptic and triangular plates – while this geometric modulation weakens rapidly as the plate becomes more disk-like. The low-Reynolds-number phase diagrams presented in this work may serve as a reference for future studies on continuously wavy perimeters.
5. Conclusions
The wake transitions of normal disk-like plates are governed by the Reynolds number and two geometric parameters: the vertex count
 $N$
, and the compression ratio
 $k$
. Across the parameter space
 $100 \leq Re \leq 300$
,
 $2 \leq N \leq 5$
,
 $0 \leq k \leq 1$
, five distinct flow regimes – steady geometric-symmetric (SG), steady reflectional-symmetric (SR), reflectional symmetry-breaking (RSB), reflectional symmetry-preserving (RSP), and chaotic state (CS) – are identified and mapped into phase diagrams that delineate the critical boundaries between them.
The vertex count
 $N$
acts as the primary geometric parameter, determining the qualitative structure of the transition pathway. For
 $N=2$
at low to moderate
 $k$
(0.4 and 0.5), the wake can bypass the SR and RSB states entirely, and at
 $k=0.4$
, it develops an unusual RSP state with stable drag and periodic vortex shedding. For
 $N=3$
(triangular plates), symmetry, once broken, does not recover; the RSP state is absent for all
 $k$
studied. For
 $N \geq 4$
, the transition sequence encompasses all five regimes, converging rapidly towards the circular-disk scenario. The compression ratio
 $k$
acts as a secondary modulator: increasing
 $k$
blunts the corners, weakens the edge-anchored vortices, lowers the critical Reynolds numbers, makes the transition pathway increasingly similar to that of a circular disk, and relaxes the orientational locking of the shedding direction.
The drag coefficient exhibits a systematic parity dependence. Plates with an even number of vertices display a single dominant frequency at twice the shedding frequency, whereas those with an odd
 $N$
develop an additional subharmonic component at the fundamental shedding frequency, reflecting the parity-governed recovery of the instantaneous vorticity distribution. For all
 $N \geq 3$
plates, the primary shedding frequency is confined to a narrow band
 $St=0.11$
–
 $0.14$
, independent of
 $N$
,
 $k$
and
 $Re$
within each regime.
Axis switching is observed exclusively for elliptic plates in the CS, driven by the non-uniform self-induced velocity field of the elliptical near-wake vorticity distribution. For triangular plates, the threefold rotational symmetry locks the shedding direction at approximately
 $\pm 120^\circ$
, and suppresses axis switching; the isosceles plate (
 $k=0$
), which lacks rotational symmetry, does not exhibit such locking.
Taken together, the results demonstrate that the perimeter geometry can substantially alter the wake transition pathway when the departure from the circular shape is sufficiently pronounced, but this geometric modulation weakens rapidly as
 $N$
increases or
 $k \to 1$
. The phase diagrams presented here provide a systematic low-Reynolds-number reference for the broader problem of edge-modified bluff-body wakes.
Acknowledgements
The authors would like to thank the Centre for High Performance Computing, Shanghai Jiao Tong University, for its support.
Funding
This work is supported by the National Natural Science Foundation of China (grant nos 52422110 and 42376183).
Declaration of interests
The authors report no conflict of interest.
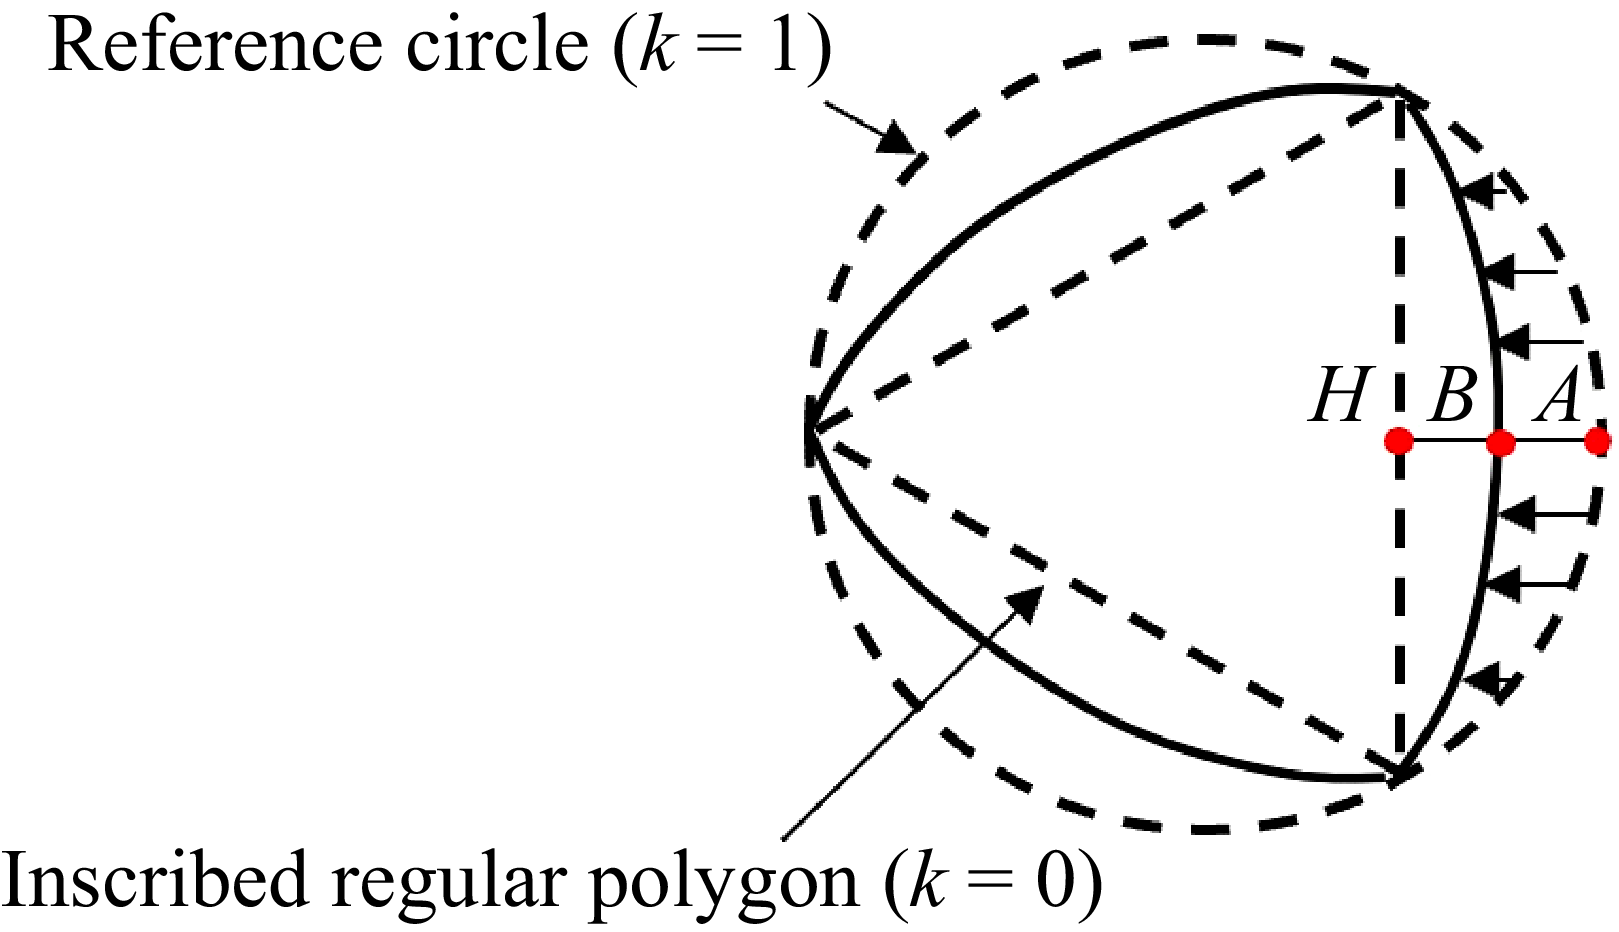
 N=3
 k=0.5
 A
 A
 H
 k=|HB|/|HA|
 B
 k=1
 k=0


 k
 N
 a−c
 k=0.3
 N=3,4,5
 d−g
 k=0.5
 N=2,3,4,5
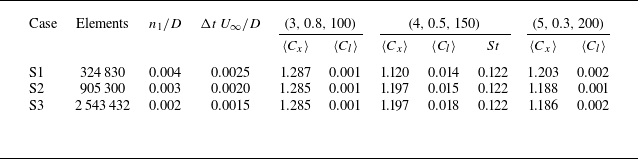
 Cx
 Cl
 (N,k,Re)
 St
 n1/D
 ΔtU∞/D
 Cl=Cy2+Cz2
 f
 St=fD/U∞
 ⟨⋅⟩
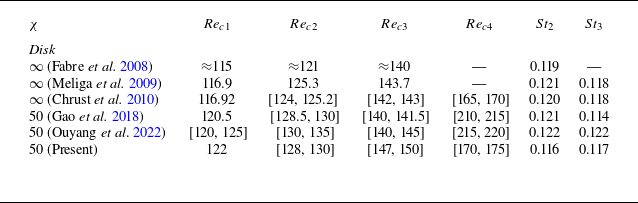
 Reci
 Sti
 i=1,2,3,4
 St2
 St3
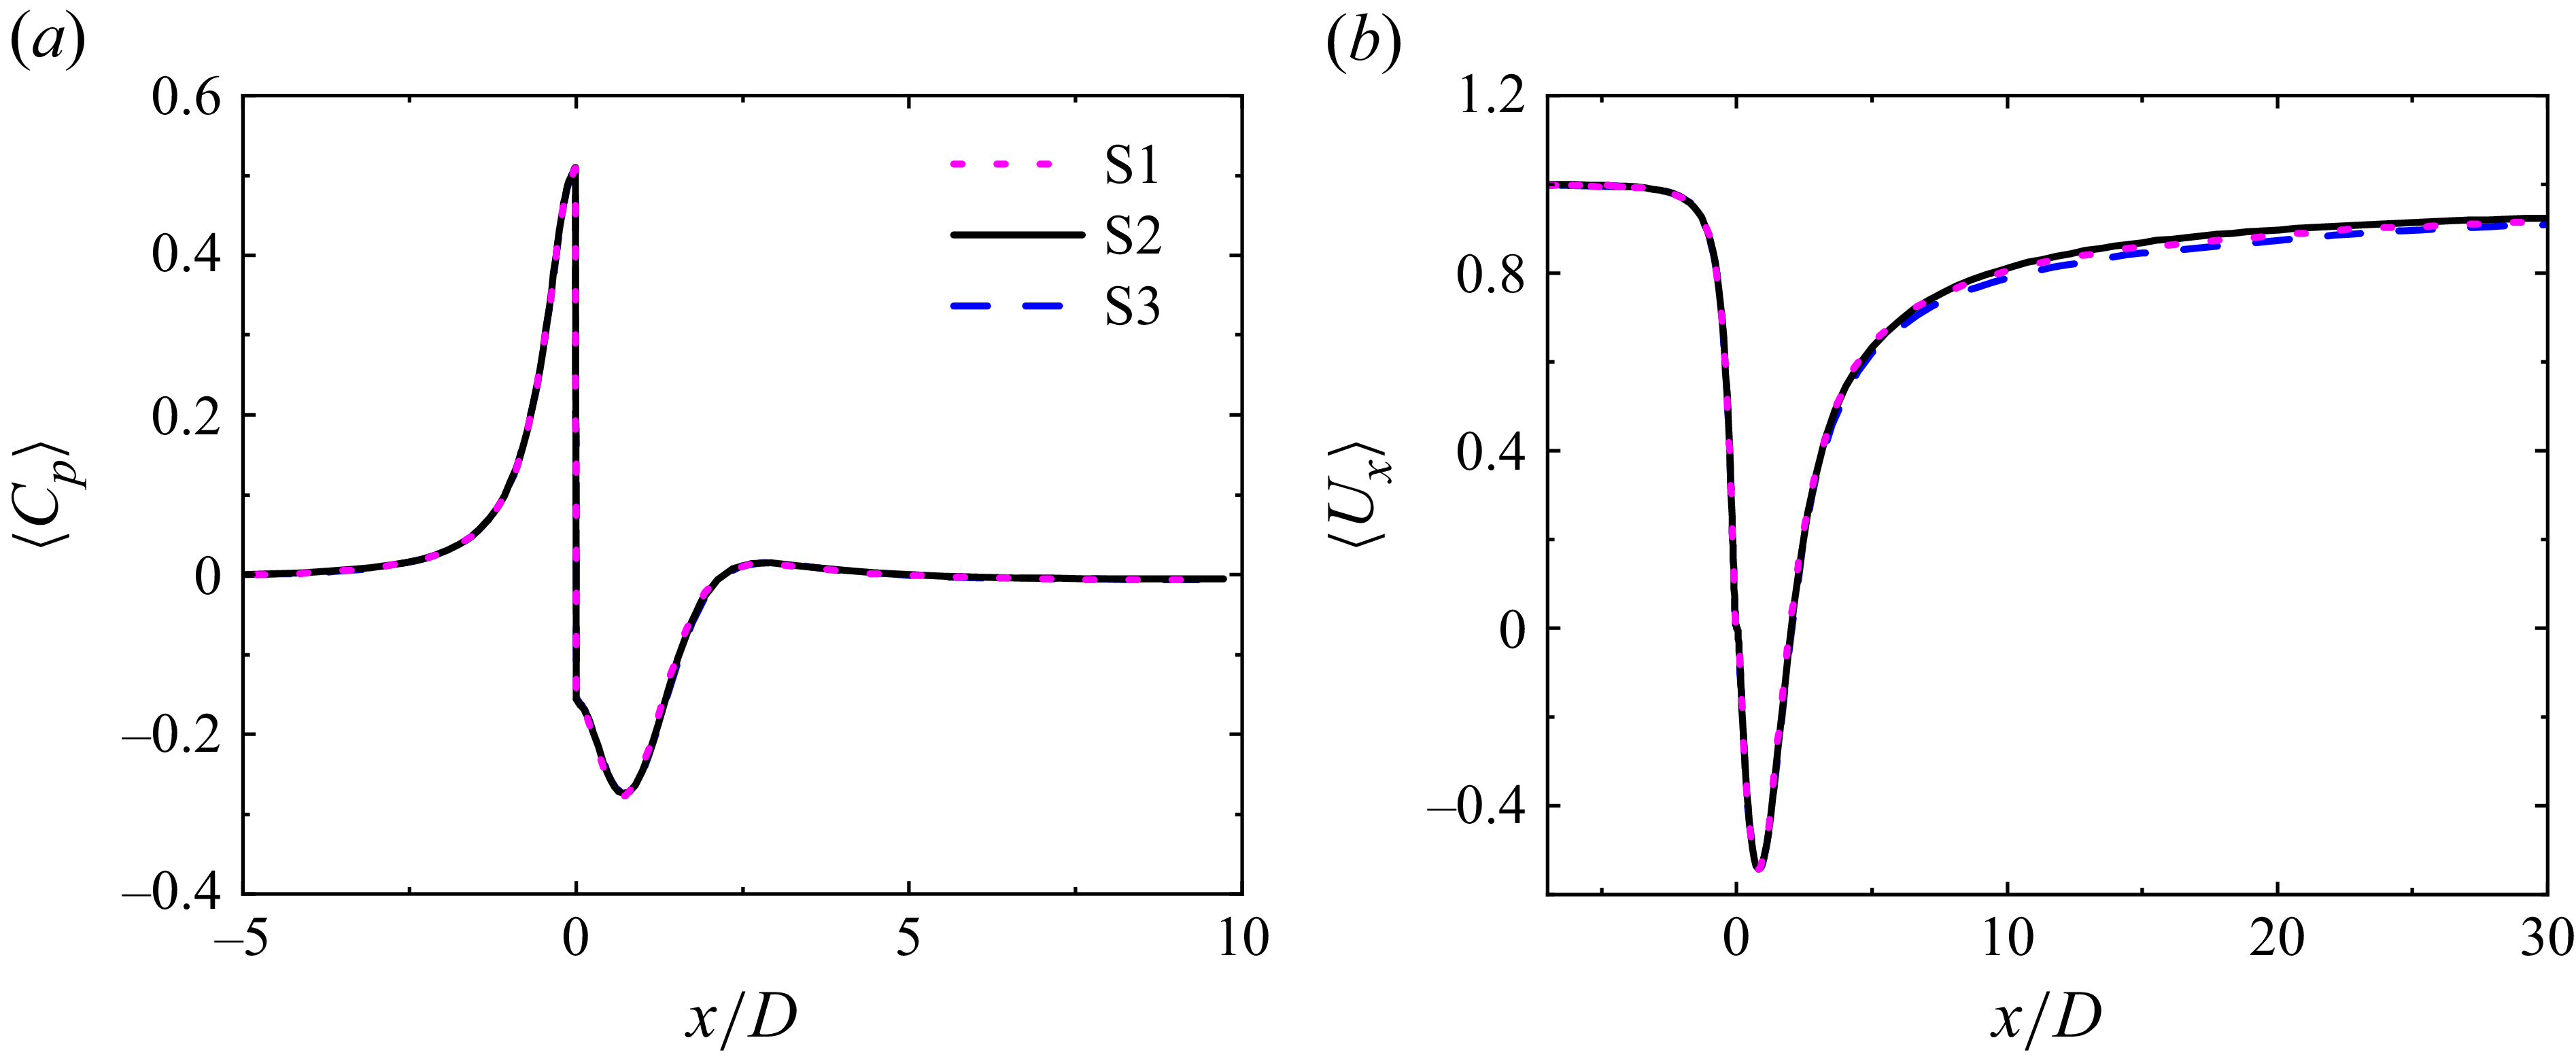
 ⟨Cp⟩
 ⟨Ux⟩
 z/D=0, y/D=0
 (N,k,Re)=(4,0.5,150)
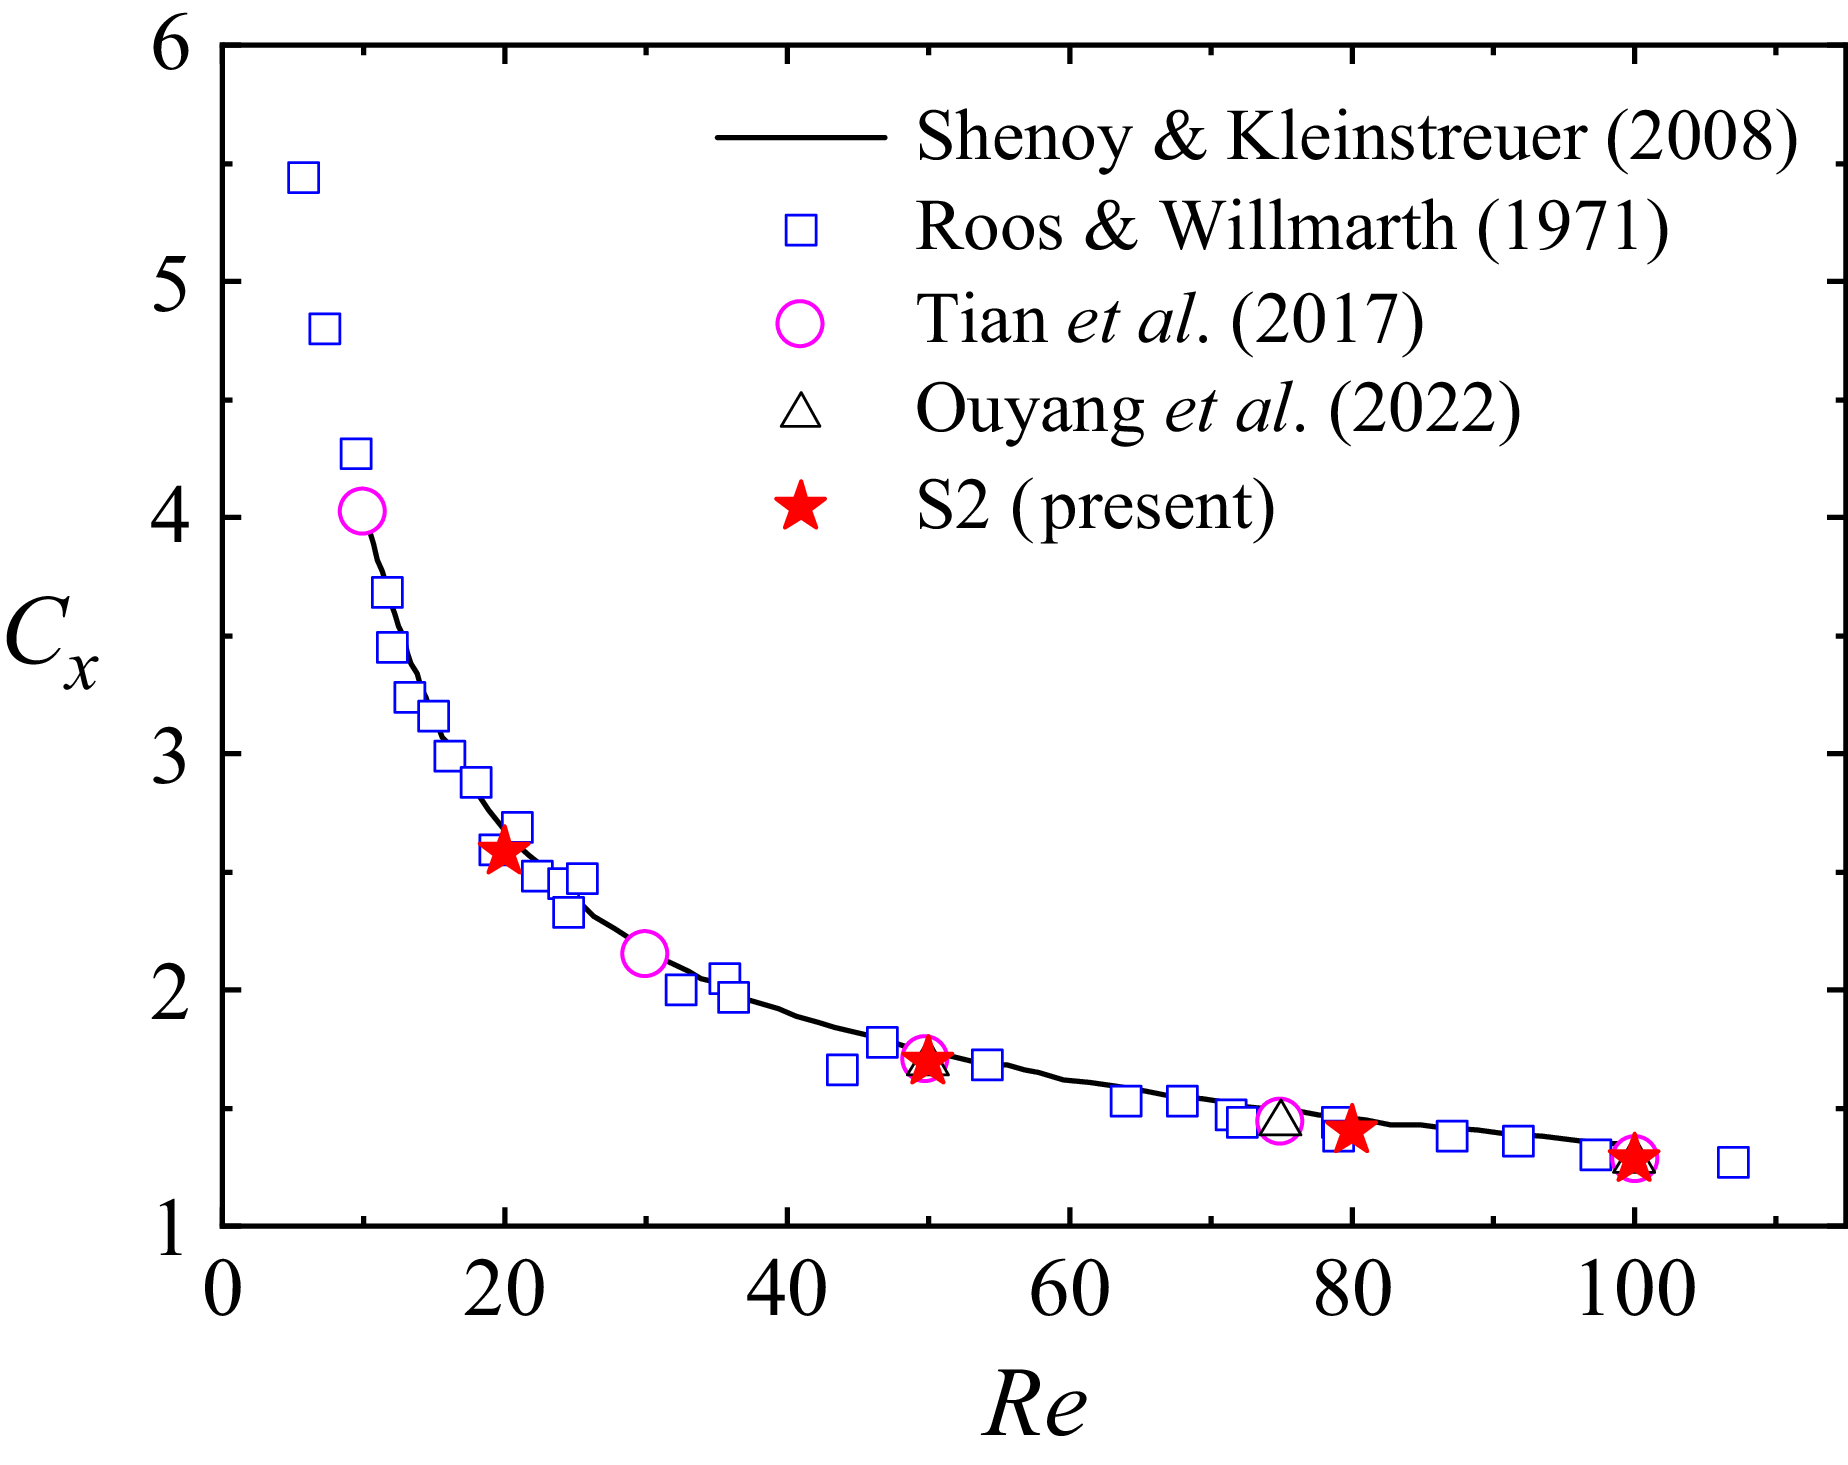
 Cx

 Re
 k
 N=2,3,4,5
 +
 N=2
 ωx=±0.15U∞/D
 ±0.2U∞/D
 ±0.3U∞/D
 Q
 Q=0.15

 (N,k,Re)=(2,0.4,120),(3,0.3,100),(4,0.4,125),(5,0,110)
 a−d
 ωx
 ±0.3U∞/D
 Q
 Q=0.3
 e−h
 x/D=0.5

 (N,k,Re)=(3,0.4,135),(4,0.3,140),(5,0.5,125)
 ωx
 ±0.15U∞/D
 Q
 Q=0.15
 ωx
 x/D=0.1

 (N,k,Re)=(3,0.4,175),(4,0.5,140),(5,0.3,145)
 a,e,i
 Q
 Q=0.05
 b,f,j
 ωx
 x/D=0.5
 c,g,k
 θ
 y
 y−z
 d,h,l
 Cx
 Cy

 Cx
 Cy
 N=3
 b−c
 N=3, k=0
 Re=162
 183
 Cx
 Re=162
 Re=183

 N=3, k=0
 x/D=0.5
 T
 Q
 Re=162
 Q
 Re=183
 θ
 Re=162
 Re=183
 Re=162
 Re=183
 2.5∘
 13.2∘

 (N,k,Re)=(2,0.4,220),(4,0.3,180),(5,0,180)
 a,e,i
 Q
 Q=0.01
 b,f,j
 c,g,k
 d,h,l
 Cy
 Cz
 Cx

 x/D=0.5
 N=4, k=0.3, Re=180
 N=5, k=0, Re=180

 N=2
 k=0.4
 Re=177
 a,b
 y=0
 ωx=±0.15U∞/D
 Cz

 x/D=4
 N=2, k=0.4, Re=177

 a,c,d
 (N,k,Re)=(5,0,190)
 b,e,f
 (N,k,Re)=(5,0,210)
 ωx=±0.2U∞/D
 Cx
 Cy
 Cx

 x/D=0.5
 ωx=±0.15U∞/D
 N=3, k=0

 N=2, k=0.4, Re=177
 y/D=0
 y/D=0
 z/D=0
 z/D=0
 Lb
 La

 N=2, k=0.5, Re=250
 x/D=0.5
 x/D=6
 ωx=±0.15U∞/D

 St
 N
 k
 Re∈(125,190), St∈(0.105,0.135)
 k=0.5
 Re=200
 Re=150
 170

 x/D=4
 N=2, k=0.4, Re=230

 z/D=0
 N=3, k=0
 Re=162
 Re=183

 N=3, k=0.5, Re=170
 z/D=0
 b−e
 z/D=0
 ωx
 x/D=6


