

Introduction
Since the mid-20th century, social, economic and technological forces have disrupted the traditional patterns of family life in advanced industrial societies creating new risks and social policy responses. The challenges of declining fertility and an increasing elderly population are compounded by changing social norms concerning marriage, divorce, sexual mores and the customary gender division of labour in household production and kinship care. These developments, often referred to as the second demographic transition, began in the Western industrialised countries and then spread to other parts of the globe (Lesthaeghe, Reference Lesthaeghe2010; Van de Kaa, Reference Van de Kaa2002). In its most extreme form, the impact has been characterised as the “deinstitutionalisation” of family life, exemplified in individualisation, delayed parenthood, increasing rates of cohabitation, divorce and single parent households (Lundqvist & Ostner, Reference Lundqvist and Ostner2017; Cherlin, Reference Cherlin2004). Beaujot and Zenaida (Reference Beaujot and Zenaida2008), p. 78) note that “the second demographic transition has been linked to secularisation and the growing importance of individual autonomy. This includes a weakening of the norms against divorce, premarital sex, cohabitation and voluntary childlessness.” Overall, these trends have created substantial pressures on modern welfare states to meet the growing needs of aging populations and the childcare needs of dual earner couples and single parent families.
The most significant changes in the formation and functioning of family life have occurred in the wealthy countries represented in the membership of the Organisation for Economic Cooperation and Development (OECD), where fewer people are getting married; those who marry do so later in life, split up more frequently and have less children, whose socialisation and care are increasingly left to outsiders as mothers have shifted their labour from the household to the market economy. Since the 1960s, the upper-income countries in Europe, East Asia and North America have experienced a decline in the total fertility rate (TFR) well below the replacement rate of 2.1. In Japan birth rates fell below population-replacement level by the late 1970s and there has been no sustained recovery since then (Brinton and Oh, Reference Brinton and Oh2019). In Korea, birth rates dropped below replacement level by the mid-1980s and fell to just 1.05 in 2017, rendering Korea a prime example of a “lowest-low” fertility country (Billari and Kohler, Reference Billari and Kohler2010). Much has been written about the family policies in the OECD countries, which have developed in response to the demographic transition and changing patterns of family life (Daly and Ferragina, Reference Daly and Ferragina2018; Da Roit and Le Bihan, Reference Da Roit and Le Bihan2019; Dykstra and Hagestad, Reference Dykstra and Hagestad2016; Daly et al., Reference Daly, Pfau-Effinger, Gilbert and BesharovForthcoming). These demographic and family changes are also emerging in the Middle East and North African (MENA) countries, where social policies in support of family life are less developed. This paper examines the shifting demographics and norms of family life in the MENA region, and their implications for social policy.
Emerging transitions in MENA
Declining fertility
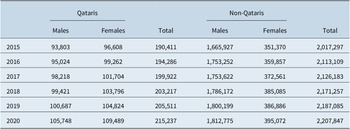
Although with an average TFR of 2.8 the MENA remains well above the standard replacement level of 2.1, over the last 25 years this region experienced a proportional decline in fertility rate of 42 per cent (World Bank, 2017). In interpreting these data, it is important to recognise that the 2.1 replacement level does not account for infant mortality rates, which can vary dramatically among the MENA countries. For example, Qatar’s infant mortality rate of 5.8 is almost nine times lower than Yemen’s rate of 51.7. Moreover, the 2.8 average masks a considerable variance among the countries ranging from the TFR lows of 1.7 in Iran and Lebanon followed by the United Arab Emirate with 1.8 and Qatar with 1.9 to TFR highs of 4.1 in Yemen and 4.7 in the Palestinian territories (World Bank, 2017). In some instances, there are considerable differences even within these countries; in Qatar, for example, the TFR for Qatari citizens is well above 2.1, while it is well below the rate for non-Qatari citizens who constitute a large majority of the population (Gulf Cooperation Council, 2018; PSA, 2020). It is noteworthy to mention that non-Qataris are not eligible for family benefits that Qatari nationals receive. The population in Qatar represents a society of unbalanced demographic structure and gender distribution between males and females (PSA, 2020). The ratio of Qatari nationals to non-Qataris ranges from 8.62 in 2015 to 8.88 per cent in 2020. Gender ratio of non-Qatari ranges from 0.21 in 2015 to 0.22 in 2020 (PSA, 2020) (Table 1).
Qatari and Non-Qatari Populations by Gender 2015-2020

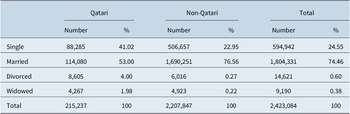
In 2020, Qatari married-couple families made up 53 per cent of all Qatari households. Single never married Qatar is made up 41.02 per cent of all Qatari households (Table 2).
Population by nationality and marital status in Qatar, 2020.

Source: Population Statistics Authority (PSA, 2020).
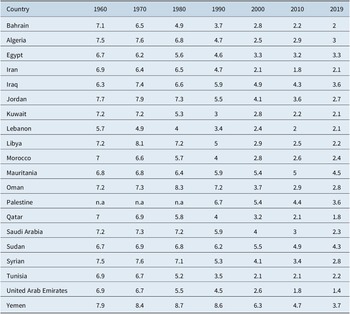
In some countries with the conflicts and high infant mortality rates such as Yemen and the Palestinian territories, high fertility rates can be seen as a demographic battle, necessary for survival (Moghadam, Reference Moghadam2013; United Nations, 2013a) and a contributor to the physical and political strength of the community under threat. Birth rates in Palestine and Yemen varied between 4.1 and 6.5 between 1999 and 2014. However, birth rates declined in 2019 in both countries (PCBS, 2019; UNIGME, 2021) (Table 3).
Total fertility rate in Middle East – North Africa, 1960–2019.

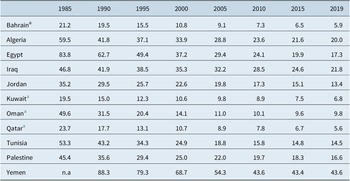
Thus, demographers estimate that actual replacement rates vary between 2.1 and 3.5 depending on factors such as infant mortality (Espenshade, Guzman, & Westoff, Reference Espenshade, Guzman and Westoff2003). The infant mortality rates in Palestine and Yemen declined from 35.6 and 88.3 deaths per 1,000 live births in 1990 to 16.6 and 43.6 deaths per 1,000 live births, respectively (UNIGME, 2021) (Table 4).
Mortality rate, infant (per 1,000 live births) – Middle East and North Africa, 1985–2019.

a Infant mortality rate among nationals.
Female labour force participation
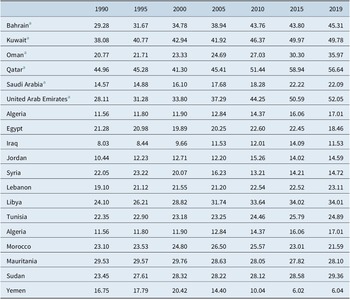
The average fertility rate in the MENA region has been declining with the rising levels of women’s participation in the workforce and higher education (Moghadam, Reference Moghadam2013; United Nations, 2013a). For example, Spierings and Smits (Reference Spierings and Smits2007) find a negative correlation between the number of children and female labour force participation in Egypt, Jordan, Morocco, Syria and Tunisia. Female labour force participation rates among the Arab countries vary from approximately 15–50 per cent, a much wider range than in Western Europe (International Social Security Association, 2017; OECD, 2013; United Nations, 2013b; United Nations Development Programme, 2005) (Table 5).
Female labour market participation in Middle East – North Africa, 1990–2019.

a Data inclusive of both national female and non-national female migrant workers, as per ILO standard definition.
Source: ILOSTAT database, 2021.
Family planning
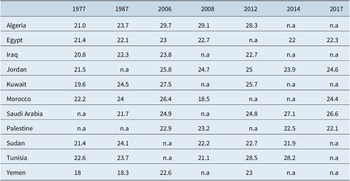
The introduction of family planning programmes and contraceptives in the MENA region is another important factor in the decline of fertility rates. In 2019, the percentage of married women between 15 and 49 years old who use contraceptive methods ranged from 12.2 in Sudan, 37.5 in Qatar to 67.4 in Morocco (PRB, 2019). Moreover, fertility rate in the region has also been declining with a significant increase in women’s age at first marriage. In 1977, the singulate mean age at marriage (SMAM) ranged between 18 years for women in Yemen, 21 years in Algeria and 22.6 years in Tunisia. SMAM increased by 2 years for women in Jordan and Morocco and by 6 years for Tunisian women between 1977 and 2017 (Table 6).
Singulate mean age at marriage (SMAM), Middle East – North Africa, 1977–2017.

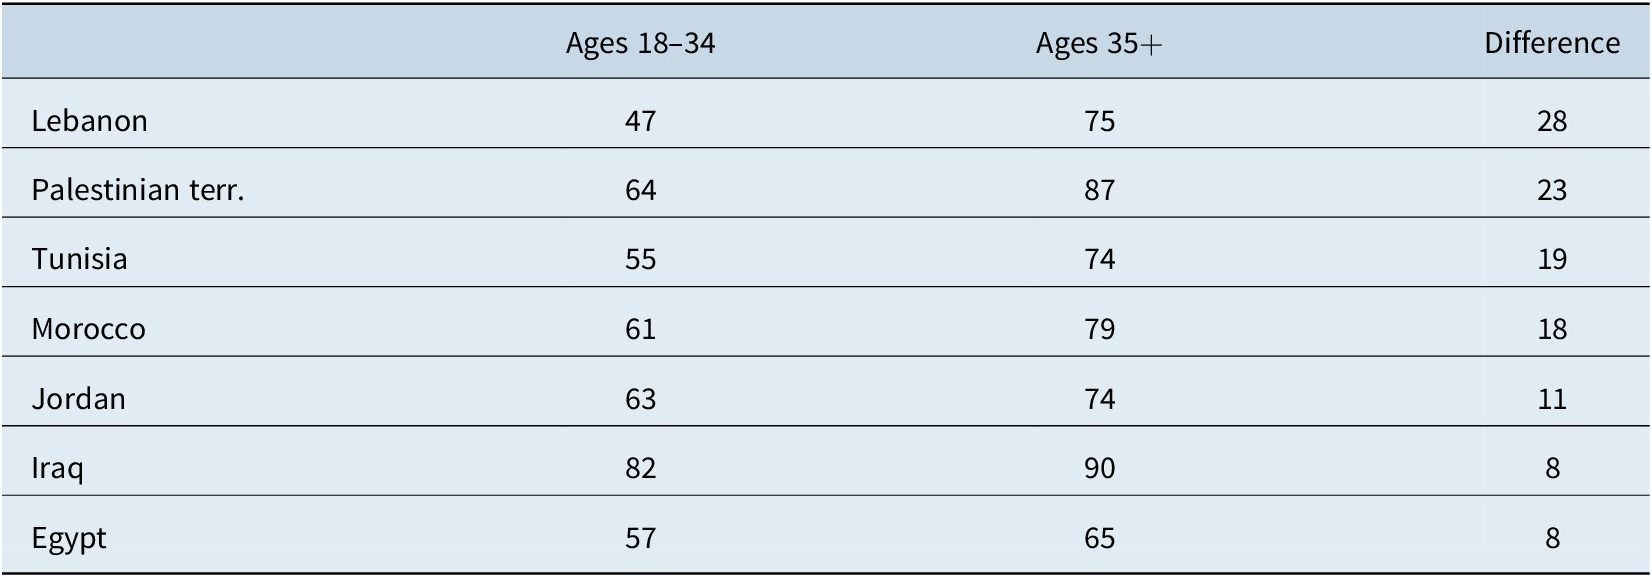
Older generation prays more in Middle East and North Africa: Percent who pray several times a day.

Source: Pew Research Center Q61.
Secularisation
In general, analyses of demographic trends indicate that secular and highly educated segments of the population tend to reproduce at much lower rates than the religious, traditional and conservative segments of the population (Last, Reference Last2014; Longman, Reference Longman2006). There is some evidence that countries in the MENA region (which have practiced more religious observance in the 21st century than the OECD countries) are growing less religious at the same time that there is increasing gender equality in education (Economist, 2017). Although solid majorities of the Muslims in seven MENA countries surveyed by Pew (2012), report that religion is very important the data also suggest that religious observance of the younger generation is weaker than for their elders (Tables 7 and 8).
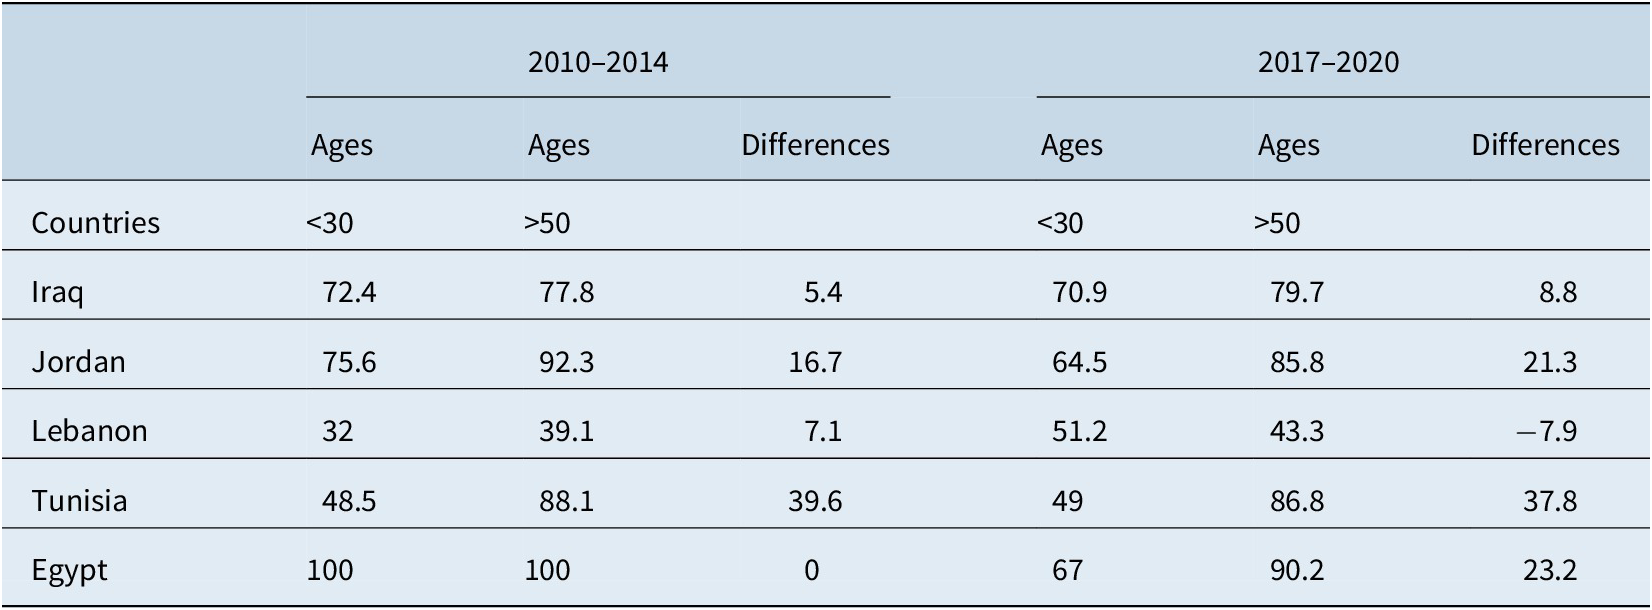
How often do you pray? Percent who pray several times a day, ages under 30 and over 50.

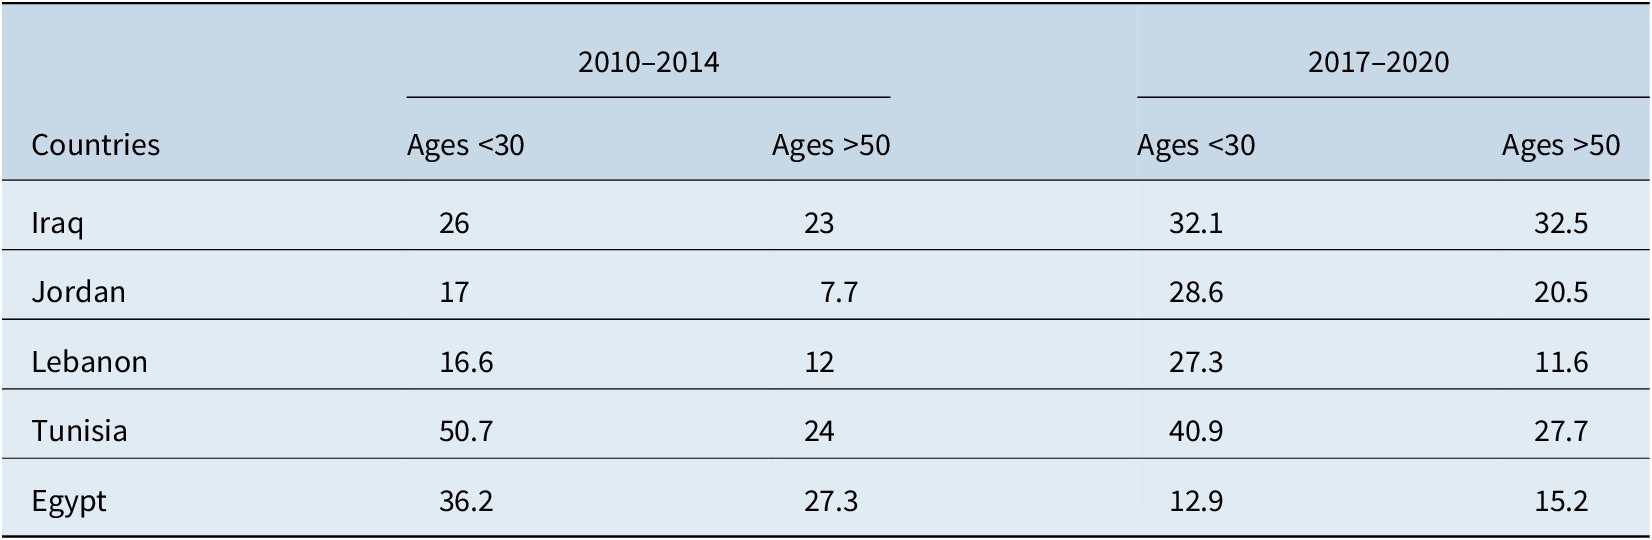
Similar findings of less religious practice among the younger generation are revealed in the 2012–2014 and the 2017–2020 World Values Survey data, which notes that respondents under age 30 were more likely to have reported never attending religious service than those over 50 years of age (Table 9).
How often do you attend religious services? Percent of those who answered never ages under 30 and over 50.

Source: World Values Survey Wave 6: 2010–2014; and Wave 7 (2017–2020) http://www.worldvaluessurvey.org/WVSOnline.jsp
Less religiosity may imply a later age of marital sexual debut and encourage a lower fertility rate. A pattern of late marriage and decline of fertility is thus expected in the region. To sum up, family values, proxied here by religiosity, are important determinants of marriage decisions, fertility and women’s labour market participation. For instance, highly secularised Scandinavian countries, experienced sub-replacement fertility trends (Del Boca and Wetzels, Reference Del Boca and Wetzels2007).
Female education
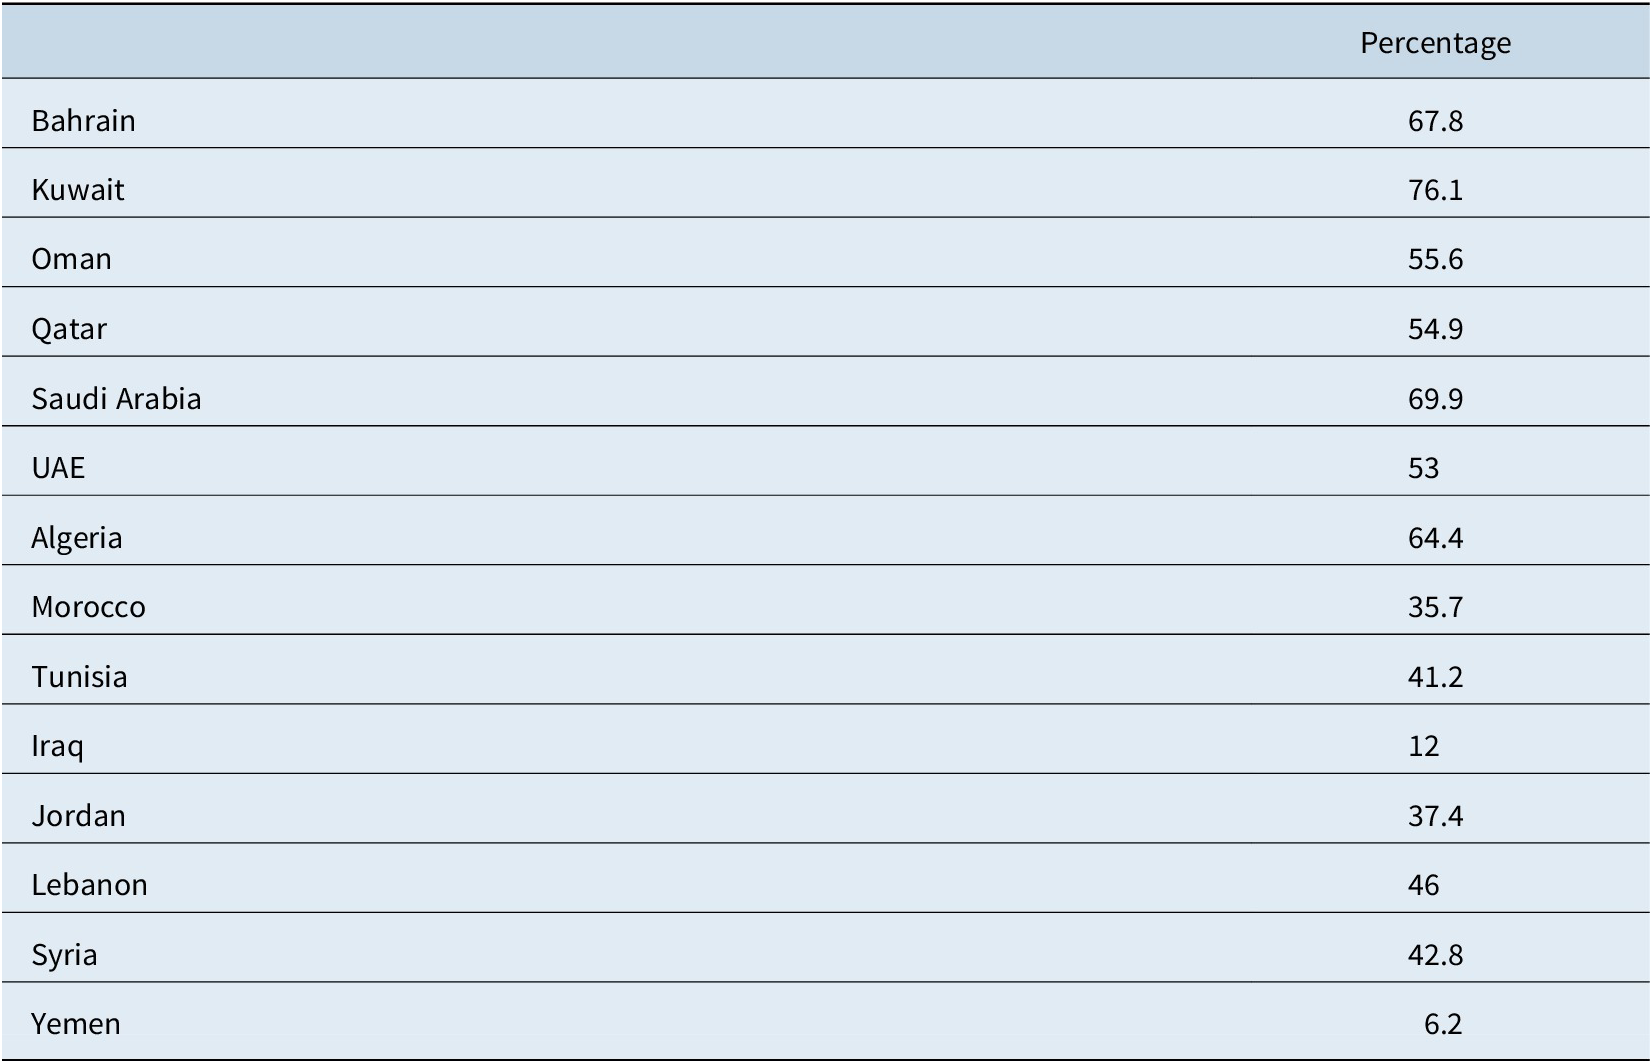
The decline in fertility rate in the MENA region is associated with an increase of female educational attainment. Moreover, the secular tendencies of the younger generation are accompanied by increasing gender equality in education. With the exception of a few countries, female and male enrollments in primary and secondary education have achieved parity. And in most MENA countries, more women than men are enrolled in tertiary education with the level of female enrollment reaching about two-thirds in some gulf states, such as Kuwait and Qatar (ILO, 2012, p.81). Despite these educational gains, the rate of female labour force participation remains relatively low in comparison to the OECD countries. In addition, women’s enrolment in tertiary education ranged from 6.2 per cent in Yemen, 35.7 per cent in Morocco and 76.1 per cent in Kuwait (WEF, 2021). It is worth noting that the low women’s enrolment rate in Iraq (12%) is tragic since Iraq used to have one of the most developed education systems in the Middle East. Iraq’s education system has been affected by the dislocation of people and the destruction of critical infrastructure due to years of crippling economic sanctions and a series of devastating wars. Many universities continued to be impacted by electricity outages and lack of equipment and resources (Al-Shaikhly and Cui, Reference Al-Shaikhly and Cui2017) (Table 10).
Female educational attainment – Enrolment in tertiary education, in Middle East – North Africa, 2021.

If the second demographic transition trends of secularisation, higher education and declining fertility rates can be generalised beyond the OECD countries, then the increasing secularisation and expanded educational opportunities suggest that the relatively high TFRs in the MENA region will continue to decline. Indeed, Eberstadt and Shah (Reference Eberstadt and Shah2011) observe that “there remains a widely perceived notion – still commonly held within intellectual, academic, and policy circles in the West and elsewhere – that Muslim societies are especially resistant to embarking upon the path of demographic and familial change that has transformed population profiles in Europe, North America and other more developed areas.” They argue, however, that these views do not reflect the important new demographic realities. As estimates by the UN Population Division reveals, closely tracking the worldwide trend the average TFR of Arab countries in Western Asia is expected to decline to just below 2 by 2100.
Marriage and sexual revolution
Although many parts of Arab world are experiencing changes in the established patterns of family life the data on family trends are not as readily available as in other regions and the degree of change is open to differing interpretations. Currently, the available data show that it is relatively clear that fertility rates have fallen, and the age of marriage is rising in many Arab countries, significant changes are also taking place in the timing and traditions of marriage (Rashad, Reference Rashad2015). However, analysts sometimes differ in how they characterise the overall degree of change in traditional commitments to family life and living arrangements. Eberstadt and Shah (Reference Eberstadt and Shah2011), for example, claim that in the Arab world “traditional marriage patterns and living arrangements are undergoing tremendous change.” In contrast, Puschmann and Matthijs (Reference Puschmann, Matthijs, Matthijs, Neels, Timmerman, Haers and Mels2015) find that despite some similarities to the experience in many advanced industrialised countries, in the Arab world important features of this change “are (still) absent or are only present in an embryonic phase.” Specifically, they observe that the Arab world has not experienced a weakening of the marriage institution reflected in growing rates of cohabitation, high divorce rates and a climbing number of out-of-wedlock births, which are increasingly common in other regions of the world. Although marriage rates remained fairly constant in many Arab countries, in Qatar, the rate per 1,000 inhabitants fell for males from 29.4 in 2009 to 24.1 in 2015 and for females for from 27.7 in 2009 to 22.2 in 2015 (Ministry of Development Planning and Statistics, 2016).
Unlike the normative shift in the OECD countries, cohabitation and out-of-wedlock births are still taboo in many Arab countries and in some cases can lead to imprisonment, which are reasons to believe that the rates of such behaviours remain relatively rare (Puschmann & Matthijs, Reference Puschmann, Matthijs, Matthijs, Neels, Timmerman, Haers and Mels2015).
However, Puschmann and Matthijs (Reference Puschmann, Matthijs, Matthijs, Neels, Timmerman, Haers and Mels2015), p. 26) suggest it is “perfectly feasible that the next generation of young people in the Arab world will experience a cultural and a sexual revolution similar to Europe in the 1960s.” Indeed, they see some signs of this already underway in the rising ages of marriage, the transition from arranged marriages to free partner choice, the rise of non-conventional marriages, which avoid the costs of a traditional wedding party, a decline in polygamy and more generally in the changing attitudes and behaviour of the younger generation (DIFI, 2019).
As evidence of these changes, Bakass, Ferrand, and Depledge (Reference Bakass, Ferrand and Depledge2013), p. 38) report, for example, that in Morocco, “women’s mean age at marriage rose from 17.5 years in 1960 to 25.8 years in 1994 and 26.2 years in 2004; it has continued to increase since then, especially in urban areas, but now appears to be levelling off at around 26 years.” More generally, (Puschmann & Matthijs, Reference Puschmann, Matthijs, Matthijs, Neels, Timmerman, Haers and Mels2015, pp. 17–18) observe: “Today ages have gone up. In several Arab countries the SMAM among females have risen to around 30, and considerable proportions of women marry in their 30s.” Regarding the rise in nonconventional marriages, Rashad, Osman, and Roudi-Fahimi (Reference Rashad, Osman and Roudi-Fahimi2005), p. 7) suggest that the high costs of Arab marriages and economic difficulties account “for the spread of so-called “urfi” (or common-law) marriages among young urban adults in some countries in the region.” They also find anecdotal evidence of an increase in other forms of nonconventional marriage such as muta’a (temporary marriage) and messyar (an arrangement under which the man does not assume all the financial responsibilities of a standard Arab marriage). Although these latter arrangements apply mostly in cases when men are marrying a second wife, Tabutin et al. (Reference Tabutin, Schoumaker, Rogers, Mandelbaum and Dutreuilh2005), p. 527) find overall that polygyny is showing clear signs of decline with the proportion of women in polygynous unions at around 3–5 per cent in North Africa (Tunisia excluded), Palestine, Iran and Syria with a higher level of around 9 per cent among countries of the Arabian Peninsula.
A serious challenge to traditional attitudes towards sexual relations emanates from the rising age of marriage, which has climbed to a mean of over 25 years for single women in several Arab countries (Table 10). The requirement for women to remain virgins until marriage is considerably more stressful when they first marry on average at age 30 than when they first marry at the age of 18. Restraining their intermingling and sexual behaviour with men for an additional 12 years of adult life places huge pressures on traditional attitudes. Despite the rising age of marriage, Rashad (Reference Rashad2015) identifies seven countries –Mauritania, Sudan, Yemen, Iraq, Palestine, Syria and Egypt – in the Arab region where between 17 and 34 per cent of women are married before their 18th birthday. Without claiming that a sexual revolution is afoot, some evidence suggests that attitudes and behaviours concerning relationships are changing. Although there is strong religious and moral disapproval of sexual relations before marriage in Arab countries, Bakass, Ferrand, and Depledge (Reference Bakass, Ferrand and Depledge2013), p. 39) observe that the rising age of marriage “suggests that first marriage no longer systematically coincides with first sexual intercourse.” They say “suggests” because empirical data on the sexual behaviour of unmarried persons in Arab countries are extremely rare. Among the limited evidence that exists, they cite a Moroccan study, which found that 34 per cent of the young women surveyed reported having their first sexual relations before marriage. In their qualitative study, which included a sample of 50 women Bakass and Ferrand found a consensus for abiding by the rules while secretly evading them, but mainly through nonpenetrative sexual relations. A relaxed attitude towards contact between singles is expressed in survey data from the Arab Human Development Report, which reveal that on average a majority of respondents from Jordan. Lebanon, Egypt and Morocco agreed to the general intermingling of men and women in society and in all stages of education (United Nations Development Programme, 2005). Moreover, scholars have studied sex revolution in Iran (see Afary, Reference Afary2009; Mahdavi, Reference Mahdavi2007; Rahbari, Reference Rahbari2016a; Reference Rahbari2016b). For instance, Afary (Reference Afary2009) argues that among Iranian cosmopolitan middle classes, virginity was no longer crucial. In some instances, young women negotiated to have premarital sex that maintained virginity or had access to safe but expensive hymenoplasty. Contraceptives became widely available, and condoms were sold by vendors in the bazaar and neighbourhood stores (Afary, Reference Afary2009). In addition, Mahdavi (Reference Mahdavi2007), in his paper on sexual revolution in Iran, has showed that many Iranians had casual sex, multiple partners or group sex and, because they did not have access to birth control, they had to rely on abortion if they got pregnant before marriage (Mahdavi, Reference Mahdavi2007).
Nuclearisation of family
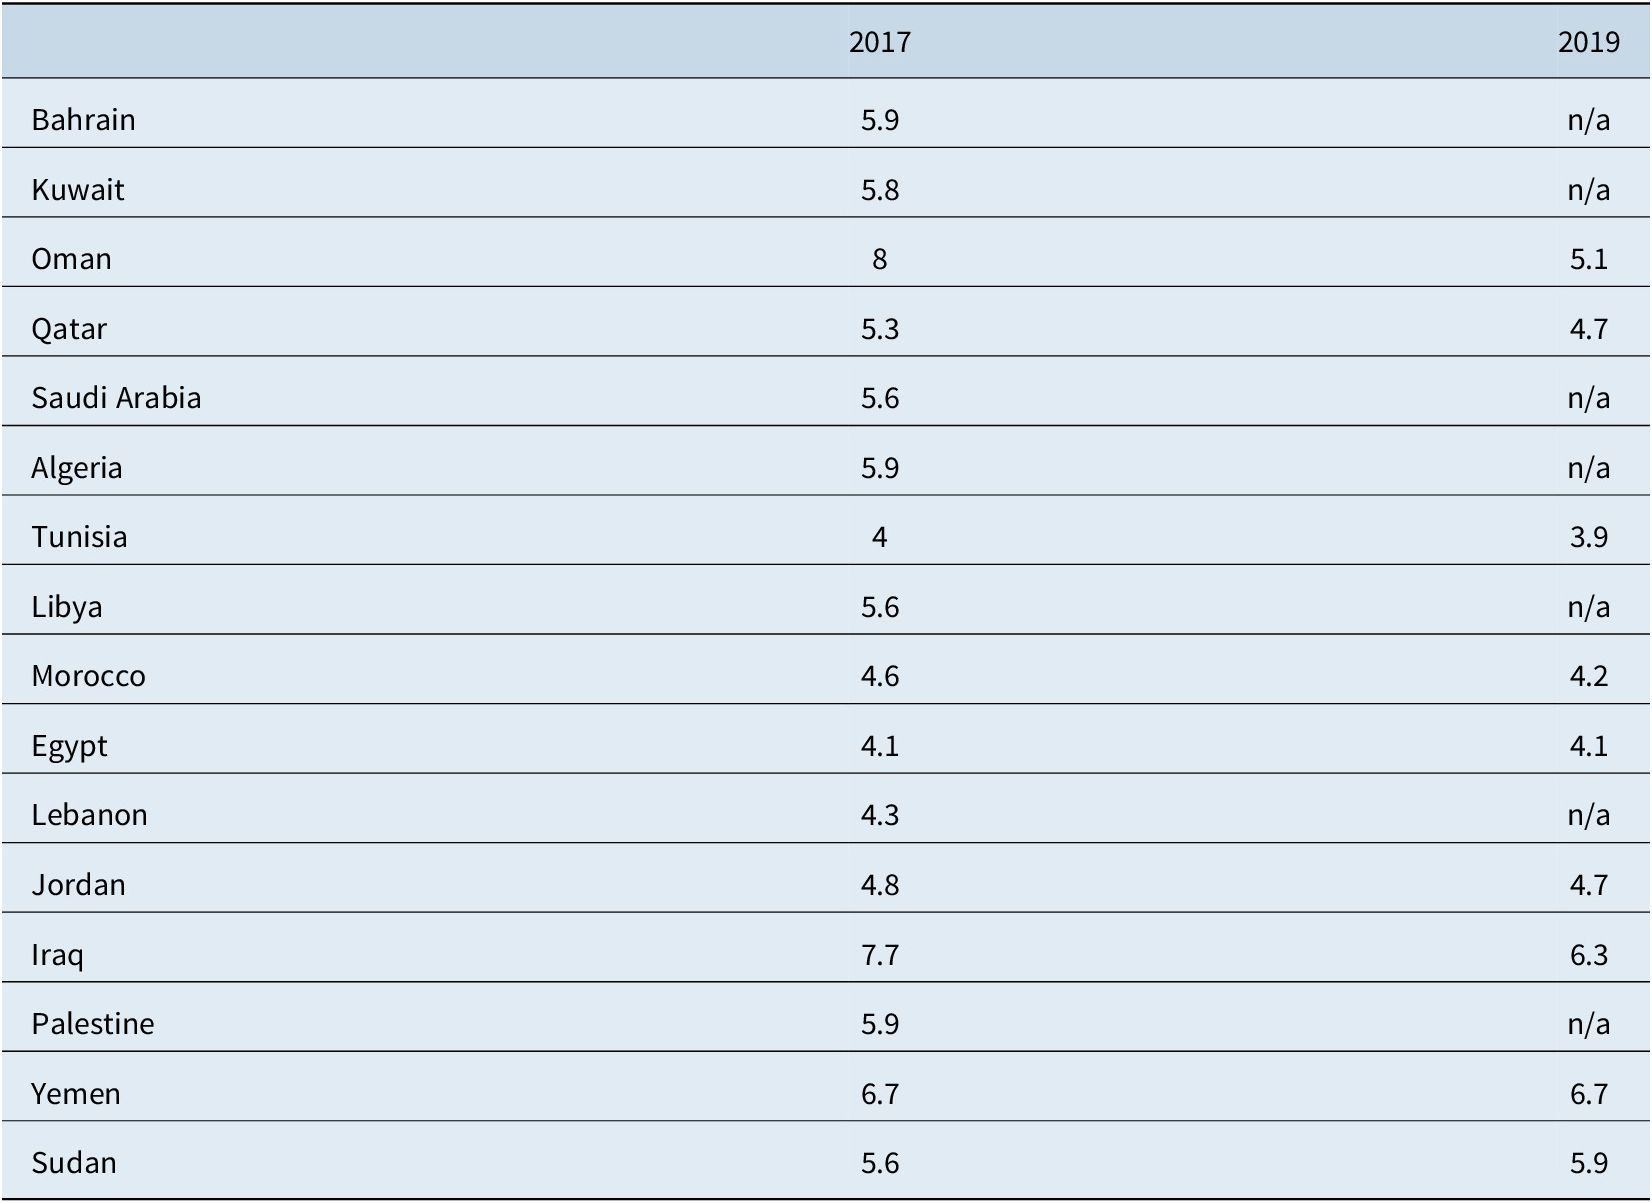
Family size in the MENA has been falling for 15 years among married women aged 15–49 (Tabutin et al., Reference Tabutin, Schoumaker, Rogers, Mandelbaum and Dutreuilh2005). Recent estimates indicate a family size ranging from 4 in Tunisia to 8 in Oman in 2017, (UN, 2017) (Table 11).
Family size Middle East – North Africa, 2017–2019.

Overall, the extended-family model has started to gradually disappear in the MENA region in favour of nuclear families consisting of two parents and their children. However, although the number of people living in the same household is declining, the connection among them remains strong and the value system that governs the extended family is still in action (Al-Ghanim, Reference Al-Ghanim2021). Rural areas of many Arab societies in countries such as Oman, Yemen, Saudi Arabia, Iraq and Syria are still seeing a large and active presence of the extended family. Moreover, the extended family is still present in urban areas such as Cairo and cities in Algeria (Al-Ghanim, Reference Al-Ghanim2021).
Life expectancy
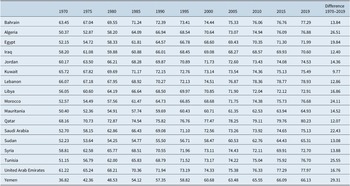
At the same time that family size has contracted due to the declining fertility rate, life-expectancy rates have been rising throughout the world. Since 1960 the average life expectancy rate worldwide has climbed from 53 to 72 years. This increase varies among regions ranging from a high life expectancy of 82 years in the European area to a low of 60 years in sub-Saharan Africa. Life expectancy in the MENA region has increased significantly since 1970. For example, between 1970 and 2019, life expectancy has increased by over 20 years in Algeria, Morocco, Tunisia, Saudi Arabia and Yemen, and by over 15 years in Bahrain, Jordan, Iraq, Lebanon, Qatar, Syria and Sudan (World Bank, 2021) (Table 12).
Life expectancy at birth, total (years) – Middle East and North Africa, 1970–2019.

Ageing and dependency
With fewer children being born as parents are living longer, the old-age dependency ratio is rapidly rising in the MENA region. This ratio represents an indicator of the social and financial burden of elderly dependents on the working-age population and on their family members. Over the next 35 years the number people age 65 years and older as a proportion of the working-age population (15–64 years of age) is expected to climb from 13 to 25 per cent worldwide, a relative increase of 92 per cent. In Western Europe, it is estimated that by 2050 the number elderly will amount to over 50 per cent of the working age population. Although the declining fertility rates and increasing life expectancy are relatively recent trends in Arab countries, the old-age dependency ratio in the Arab world is projected to reach an average of 23 per cent by 2050. But there is considerable variation in the rise of dependency ratios among the countries in this region. For example, by 2050 the ratios in Arab countries are projected to range from a low of 9 per cent in Yemen to highs of 47 per cent in Qatar, 42 per cent in Lebanon and 38 per cent in the United Arab Emirate. The old-age dependency ratio in North African countries is projected to average 19 per cent in 2050, with the highest ratio being 38 per cent in Tunisia (United Nations, 2013a). Projections of the changing age dependency ratio over this period of time require making assumptions about other factors that might come into play such as migration rates of younger people, violent conflicts, changes in life expectancy and fertility rates. The projections cited above are based on the assumption of a medium level of fertility.
Implications for social policy
Intergenerational cohesion and elderly care
The demographic trends above are generating an increasing challenge to both the family’s and the state’s capacity to care for elderly dependents. In addition, developments such as these among the younger generation in the Arab world may be a harbinger of a larger cultural adaptation to the demographic changes and social patterns, which are diminishing the bonds of marriage and family life in many of the advanced industrial countries (Gilbert and Ben Brik, 2020).
Although the Arab family has always played a key role in providing financial and social support to its dependents, Jawad’s (Reference Jawad2014) assessment that in recent years the Arab family has become a less reliable source of support due in part to the break-down of family bonds concurs with the Arab Monetary Fund and World Bank Group’s (2017) analysis. This assessment is further confirmed by Kronfol, Rizk, and Sibai’s (Reference Kronfol, Rizk and Sibai2015) examination of the shifting dynamics of intergenerational cohesion in Arab countries. Among the various factors impacting family solidarity, they note “demographic transitions, shifts in social norms and economic pressures, as well as medical advances and the ensuing changes in health patterns in later life, are triggering various forms of estrangement from the traditional family configuration and have resulted in fundamental changes in old-age care.” This has come to be problematised as “the fraying in the social cohesion between generations. (p. 836).” Moreover, the transition from large extended families to small nuclear ones, accompanied by high rates of immigration among youth seeking better employment opportunities, and the increased entry of women into the labour force have created a relative shortage of family members available for the provision of care (Sibai and Yamout, Reference Sibai and Yamout2012).
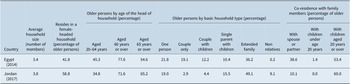
In addition, elderly care in the Arab region is provided by informal care providers, such as family members, mainly women, because of deeply rooted religious and cultural norms that emphasise the duties of younger generations towards their elders (Hoodfar, Reference Hoodfar1997; Rugh, Reference Rugh1997; Sibai and Yamout, Reference Sibai and Yamout2012; Yount and Rashad, 2008). Information on the age structure of informal caregivers in the MENA region is scarce. The UN estimated that 41.8 per cent of the elderly reside in female headed households in Egypt in 2014 and 49.1 per cent of the elderly in Jordan live with extended family and 60 per cent live with children aged 20 years and above in 2017 (UN, 2021) (Table 13).
Households and living arrangements of older persons in Egypt and Jordan.

Although daughters and daughters-in-law have routinely assumed responsibility for the provision of care to the elderly in Arab countries, Kronfol, Rizk and Sibai (Reference Kronfol, Rizk and Sibai2015) observe changes in the traditional nuptial tenets, such as later marriages, less age differences between spouses and increasing labour force participation by women. They suggest that these developments “may contribute towards unravelling the existing multigenerational household pattern and necessitate changes in familial roles, which carry a set of gendered duties and responsibilities for family members, including the young and old” (p. 838). In addition, elderly care is also provided by formal care providers, such as private nursing homes, non-governmental organisations, religious-based organisations, paid care workers and private sector agencies that specialise in social care. For example, in Jordan, there are over 50 private companies registered at the Ministry of Health that provide home care for older persons (Hussein and Ismail, Reference Hussein and Ismail2017). However, within a context of changing family structure, migration of younger people, violent conflicts, changes in life expectancy and fertility rates, mentioned above, there is a need to consider policies for supporting informal elderly care and the reform of the formal long term care provision.
Thus, in low-fertility countries such as Lebanon, a national strategy for older persons has been launched in 2021 (MSA, 2021). The strategy includes six interrelated axes – promoting the physical and mental health of older people; ensuring economic and social safety; enhancing active participation and engagement of older people in society; providing family support and promoting intergenerational solidarity; creating a safe, supportive and age-friendly physical built environment; and preventing violence and supporting victims of violence and those in crisis and conflict situations (MSA, 2021). In addition, there are over 30 nursing homes in Lebanon, with over 6,000 beds (Abyad, Reference Abyad2001). The typical nursing home has 50–100 beds; nursing staff or nuns provide skilled care, and nursing aides provide assistance with daily living activities. Most nursing homes are understaffed and lack a comprehensive team to care for older people. Only three nursing homes (Dar Al Ajaza Al Islami, Rome Nursing home and Ain WaZein Elderly Care Centre) run relatively comprehensive services including rehabilitative, preventive and curative services (Abyad, Reference Abyad2001). In Turkey, the government established nursing homes, care and rehabilitation centres for the elderly to provide services such as shelter, personal self-care, healthcare, social support and counselling, psychological support and counselling, rehabilitation, social activities, nutrition and cleaning for the older persons who are in need of continuous care and psychological, social and physical rehabilitation (UNDESA, 2017). In. addition, Turkey launched in 2016 the “Elderly Support Programme (YADES)” with a view to protecting and supporting older persons who are in need of services, providing home care for those who need physiological or psychological care and hence facilitating their lives, and enlarging these services country wide (Özmete et al., Reference Özmete, Gurboga and Tamkoc2016). In Iran, no formal services are provided to the older adult population (Amini et al., Reference Amini, Chee, Keya and Ingman2021) and only one-third of adults are covered by health insurance (Tajvar et al., Reference Tajvar, Arab and Montazeri2008; Amini et al., Reference Amini, Chee, Keya and Ingman2021).
The declining fertility rates contribute to the climbing dependency ratio that creates immense fiscal pressures on the state’s and the family’s efforts to support a growing elderly population in almost all of the OECD countries (Gilbert, Reference Gilbert2017). But, the social and economic challenges posed by the increasing dependency ratios are not limited to the advanced welfare states. In other regions of the world where publicly supported universal old age pensions are less fully developed than in the advanced industrial welfare states the unmet needs generated by ageing populations are expected to assume major proportions by 2050. In those Arab countries where the dependency ratios are projected to rise well over the world average of 25 per cent, the growing need for elder care, a role traditionally performed by women, is likely to generate tensions as women are increasingly participating in the workforce (De Bel-Air, Reference Bel-Air2016). An analysis by the Arab Monetary Fund and World Bank Group concludes that disproportionate growth of the elderly population anticipated over the next 25 years will put “pressure particularly on the finances of public pensions (and health insurance systems)” (Arab Monetary Fund and World Bank Group, 2017, p. 10). Coverage currently afforded by old age pensions is typically low in Arab countries, with one estimate reporting that approximately 10 per cent of the population aged 60 and older receive a pension (Arab Monetary Fund and World Bank Group, 2017).
In MENA, family support and remittances play an important role as a social safety net for low-income groups and rural populations due to prevalence of informal care and absence of social protection policies (Economic and Social Commission for Western Asia, 2009). The family provides more of a social safety-net than social security systems (Karshenas and Moghadam, Reference Karshenas and Moghadam2001; Olmsted, Reference Olmsted2005; Rashad, Osman & Roudi-Fahimi, Reference Rashad, Osman and Roudi-Fahimi2005). Since Arab families have historically assumed the major responsibility to care for the older generation, the increasing costs of an ageing population will be carried largely by family members (Kárpáti, Reference Kárpáti2011). In 2004, for example, elderly people in Lebanon received 74.8 per cent of their income from their children (United Nations, 2013b). However, in the face of the current economic slowdown, declining remittances and increasing poverty caused by the pandemic, many families face a difficult choice between meeting the basic needs of their households and the needs of their elderly. The United Nations Economic and Social Commission for West Asia (UNESCWA) estimates that the economic slowdown caused by the pandemic will cause an additional 8.3 million people to fall into poverty (UNESCWA, 2020). Moreover, the World Bank estimated that the number of poor people in the region – those making less than the $5.50 per day poverty line – is expected to increase from 176 million in 2019 to 192 million people by the end of 2021 (World Bank, 2021). Because of government policies to combat the COVID-19 pandemic such as lockdown policies and social distancing, many poor households, especially those in the informal sector, were more likely to lose jobs, have pre-existing health conditions, have reduced consumption, and live in crowded conditions with multi-generational households. Moreover, rising food prices, declining remittances and reduced humanitarian assistance in many countries such as Yemen, Palestine, Libya, Lebanon and Syria has pushed their populations into poverty and to the brink of starvation (IPC, 2020). The International Poverty Centre (IPC) estimated that between January and June 2021, the number of people with famine-like conditions could nearly triple from 16,500 to 47,000 people and numbers of people facing emergency food insecurity and risk of famine could increase from 3.6 million to 5 million (World Bank, 2021; IPC, 2020). Moreover, remittances, a vital source of income for many families in the region to help afford food, healthcare and basic needs, fell by about 20 percent in 2020 (World Bank, 2021). For example, in 2020, remittance growth fell by −9 per cent in Egypt, −7 per cent in Lebanon, −12 per cent in Jordan, −5 per cent in Morocco and −15 per cent in Tunisia (World Bank, 2021).
As fertility rates decline, not only will financial pressures challenge the capacity of formal measures of social protection for the aged, but there will be fewer middle-aged family members to provide informal care for their elderly kin. Recognising the impact of these trends on family supports in the MENA region, experts from the World Bank and the Arab Monetary Fund note that most of the older population in the region must rely on family and other types of informal care or state transfers.
However, with falling birth rates, rising life expectancies, changes in urbanisation, migration and family structures the reach and scope of these informal arrangements have been weakening in recent years and will weaken further unless new policies to protect older adults are implemented (Arab Monetary Fund and World Bank Group, 2017, p. 35). A shift is already taking place in this area for those who can afford to outsource elderly care, which in some countries includes lower middle-income households; just as domestic workers are common for childcare; they too assist with at-home care of elderly kin. However, there are major differences in the degree of socio-economic pressure generated by an aging population in the Arab countries. The “good news,” as Puschmann and Matthijs (Reference Puschmann, Matthijs, Matthijs, Neels, Timmerman, Haers and Mels2015, p. 31) explain, “is that during the next decades the richest Arab countries will be most affected by ageing, while the poorest countries, will be least affected. The Gulf States will be most affected, as fertility has declined profoundly and life-expectancy has risen spectacularly.”
Family policy provisions
Among the OECD countries, welfare state policies have been reformed and new policies drafted in response to the challenges posed by the demographic transition’s effects on family life. In efforts to strengthen family bonds and reverse declining fertility rates, diverse public measures have been implemented to incentivise marriage, harmonise work and family life, and assist with the care of the elderly (OECD, 2011). These measures encompass a range of benefits over the life course, particularly in the early stages of marriage and childrearing and the later stages of old age, which includes (1) children’s allowances – that can vary based on the number of children, their age and family income; (2) maternity and parental leave – paid leave from work during pregnancy and early childhood, which varies in length and often include incentives for the participation of fathers; (3) family cash assistance – direct financial aid such as birth grants and housing subsidies and indirect payments via tax credits for children; (4) family services – home visiting nurses for families with infants and prenatal care services; (5) day care – publicly provided care for pre-school children and cash payments for homecare of preschool children and (6) in-home elder care by family members – compensating relatives providing home care to the elderly with cash payments and social security wage credits.
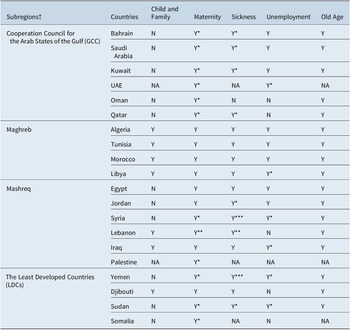
Among the OECD countries, Hungary offers, perhaps, the most extensive bundle of family benefits (OECD 2020). In addition to the standard package of subsidised child care services and universal children’s allowances, in 2019 Hungary introduced a sweeping array of family oriented incentives which included an all-purpose interest-free loan of $34,500 to women under 40 who were in their first marriage and had been employed for at least 3 years, 30 percent of which would be forgiven on the birth of a second child and the whole debt cancelled on the birth of a third child, along with homeowner subsidies of $34,500 and $51,750 to families with two and three children, respectively, and an $8,625 grant to families with three children or more for the purchase of a new 7-seater car (Fidesz, 2019). The emerging social needs in the MENA countries appear to be headed in the same direction as those experienced by the OECD countries. Forward looking MENA policy makers would do well to consider the scope of family-oriented measures employed in the OECD welfare states and their adaptability to the cultural traditions and fiscal capacities of MENA countries. Currently, social policy measures in the MENA region, such as health insurance, old age pension, paid leave/sick leave, maternity benefits and unemployment benefits, remain tied to formal employment in public and private sectors and these benefits are quite limited in range (UNDP, 2021). As illustrated in Table 14, the fewest social provisions are available for child and family needs.
Social protection schemes in the MENA region.

Abbreviations: N, no programme available; NA, data not available; Y, at least one programme available; Y*, programme available with limited provision; Y**, legislation are not yet entered into force; Y***, in-kind benefits only; †, regional classification of Arab countries based on UNDP (2015). Source: UNDP, 2021.
Social protection amid the pandemic
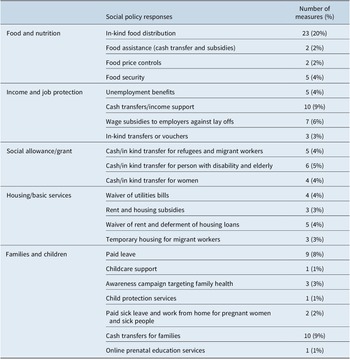
The emerging needs for social protection have been compounded by the COVID-19 pandemic, which has already impacted Arab societies as in much of the rest of the world. Most of Arab countries have struggled to provide adequate health services and social protection to their vulnerable populations. MENA countries in conflict (Libya, Syria and Yemen) are in a particularly precarious situation, as are fragile states such as Iraq, Somalia, Sudan and Palestine. Other countries, such as Lebanon, Iran and Algeria, are experiencing political crises or financial constraints that limit their ability to provide needed public services. Many states also have refugee populations who suffer from gaps in social protection. Even stable countries, such as Egypt, Jordan, Morocco and Tunisia, are struggling to meet public needs. Amidst these travails, as shown in Table 15, a number of measures were initiated in response to the pandemic, a relatively large proportion of which aimed at reducing or diminishing hunger, undernourishment due to food deprivation and malnutrition.
Government responses to the pandemic: February 2020 to February 2021.
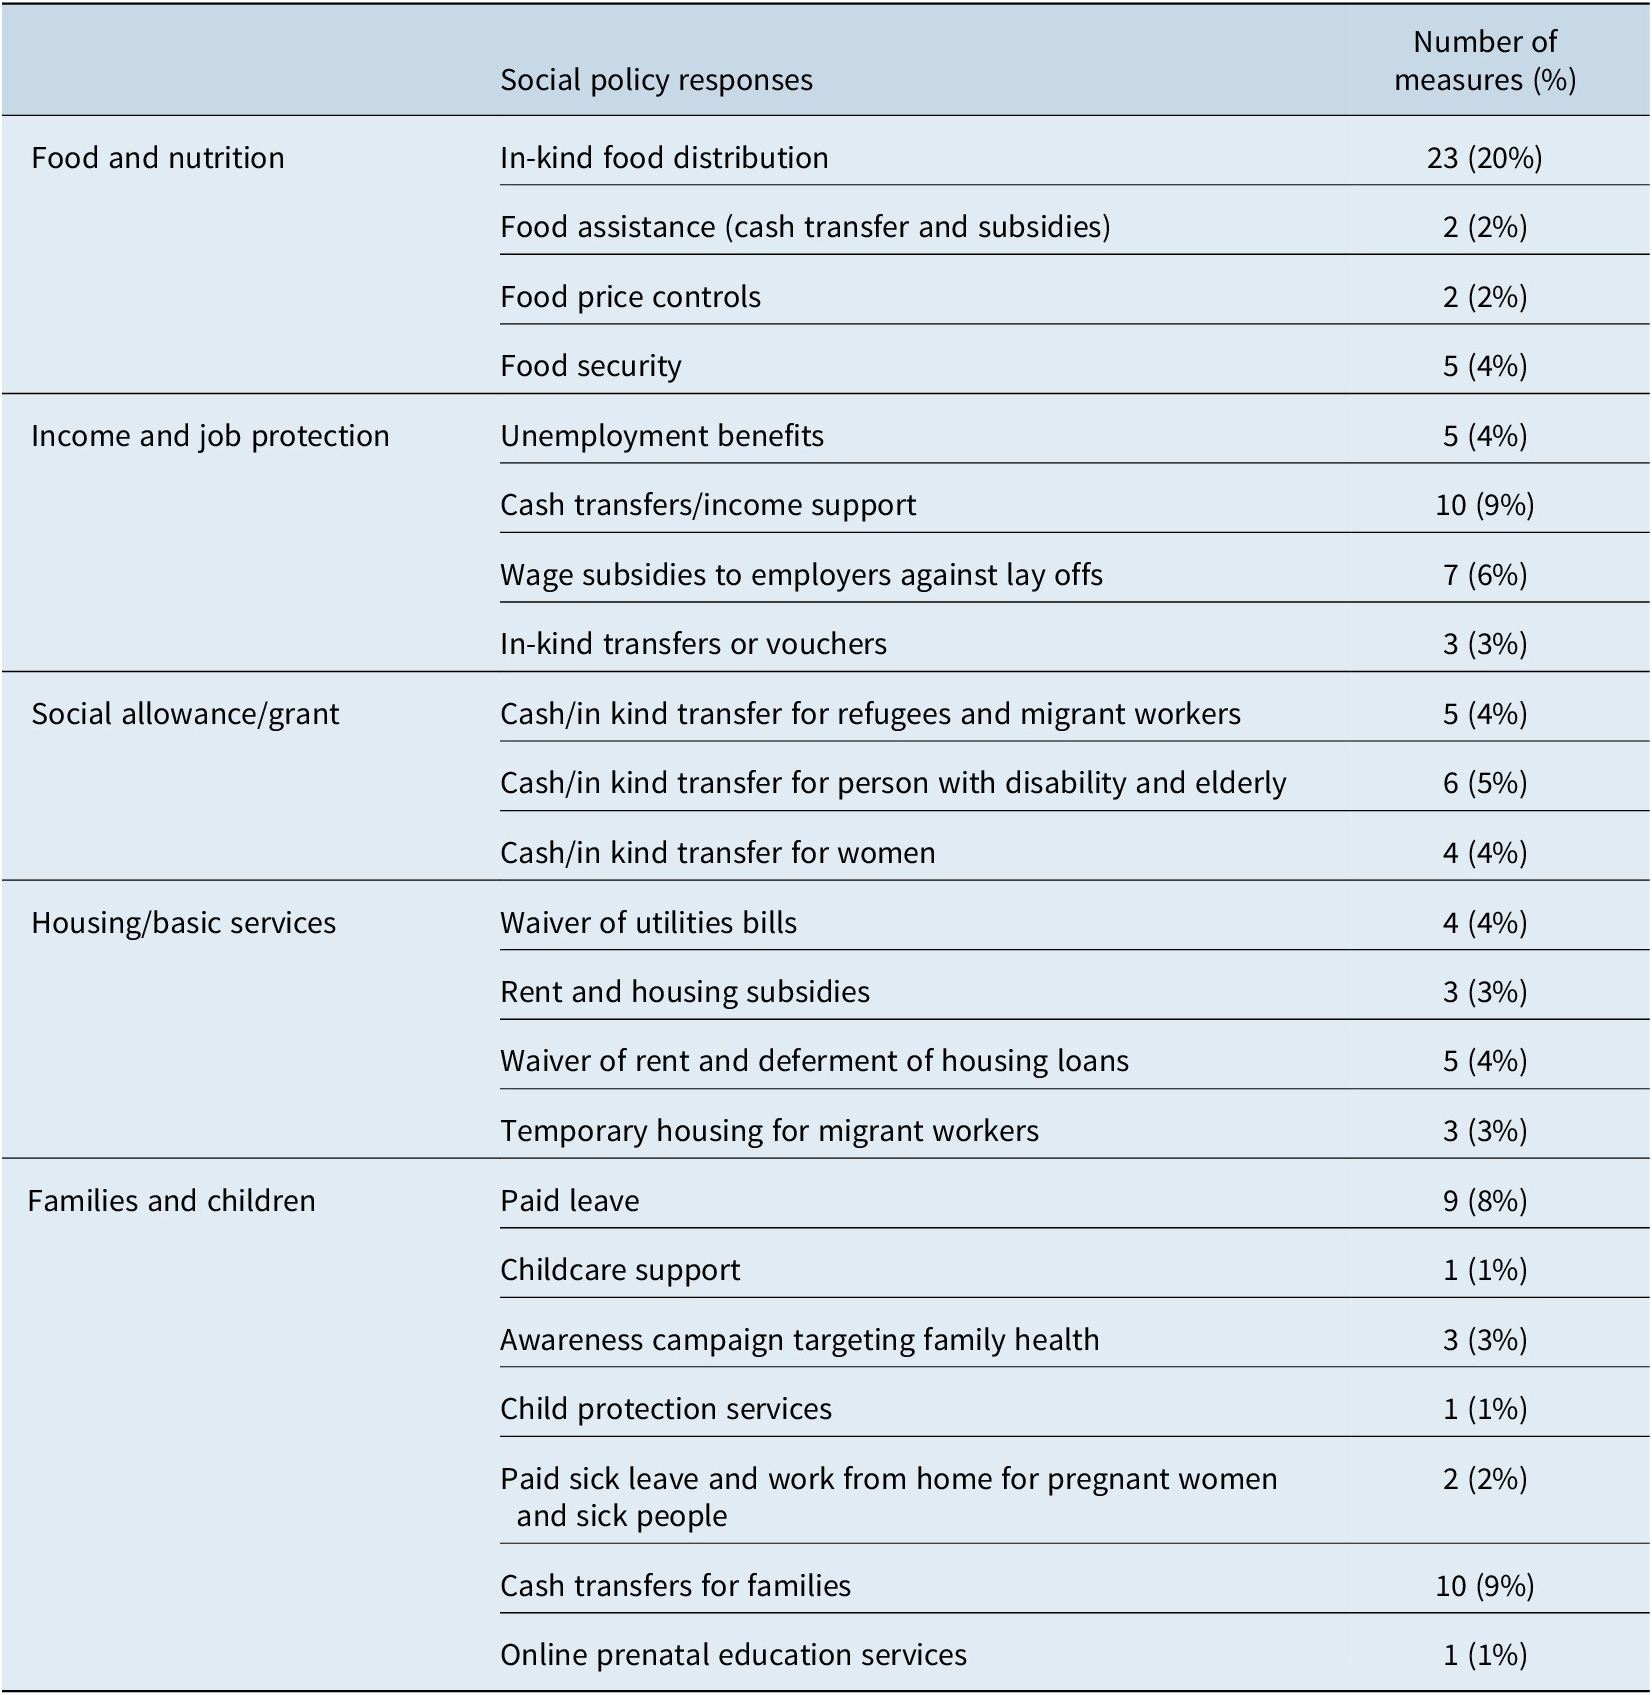
Countries includes: Morocco, Egypt, Jordan, Lebanon, Qatar, UAE, Saudi Arabia, Oman, Kuwait and Bahrain.
Source: Author analysis, authors, based on data in www.Menatracker.org. Mapping 10 MENA governments’ responses to the pandemic between February 2020 and February 2021.
A major need in the context of the pandemic relates to the protection of the families working in the informal economy and precarious forms of employment. Lacking social insurance coverage and too poor to access private insurance, those families are particularly vulnerable in hard times. Social policy responses implemented across the region to contain the spread of the virus such as suspension of schools and universities are disproportionately impacting disadvantaged and underprivileged children and youth who have fewer educational opportunities outside of school, a lack of access to remote learning tools and rely on free or discounted school meals for healthy nutrition. Refugee flows have also placed a tremendous demand on government capacities to respond to the needs of citizens and non-citizens alike.
Conclusion
Coming in a period of demographic and familial transitions, the pandemic has magnified the increasing need to expand social protection in the MENA region, which poses the question of how to pay for such an expansion. The financial options for countries in the MENA region include:
-
• moving towards a more progressive and efficient tax system (particularly personal income taxes), enforcing property taxes, strengthening tax administration and eliminating exemptions, improving efficiency in collecting and managing fiscal resources (Jewel et al., Reference Jewel, Mansour, Mitra and Sdralevich2015; Sarangi and Abu-Ismail, Reference Sarangi and Abu-Ismail2018; Bloch et al., Reference Bloch, Bilo, Helmy, Osorio and Soares2019);
-
• drawing on the sovereign wealth funds in oil-rich countries – although they are not a stable source for fiscal space, they could be used to finance countercyclical measures and ensure that social expenditures remain constant if the macroeconomic situation deteriorates;
-
• emphasising altruistic impulses and traditional duties such as waqf (charitable endowment of personal assets or other belongings made by a donor) and zakat (one of the five pillars of Islam and considered a religious duty for wealthy people to help those in need through financial or in-kind contributions);
-
• prioritising social expenditures relative to private subsidies and military expenditures) and
-
• improving debt management.
The wealthier countries in the MENA region are in the best position to take the lead in exercising these options to increase the social safety net in response to the emerging needs fuelled by the demographic and familial transitions. In so doing, they would set an example for the future development of social welfare in this region.