This article introduces a new measure of social structuration of political parties that allows the researcher to assess the extent to which a political party is socially rooted in a particular constituency and the relative weight of social-structural and behavioral factors for party composition. We first explain our proposed measure and discuss its relevance for understanding cleavage strength in comparison with alternative measures. We then use the measure to compare European parties over the past five decades. We illustrate the decline of the class and religious cleavage among mainstream political parties and reveal how, from the 1990s, education has come to structure the constituencies of green, alternative, libertarian (GAL) and traditional, authoritarian, nationalist (TAN) parties on a transnational cleavage (Bornschier Reference Bornschier2010; Häusermann and Kriesi Reference Häusermann, Kriesi and Beramendi2015; Hobolt, Leeper, and Tilley Reference Hobolt, Leeper and Tilleyforthcoming; Hooghe and Marks Reference Hooghe and Marks2018; Kitschelt Reference Kitschelt1988; Stubager Reference Stubager2010).
Motivation
There is acute awareness that the structure of political conflict has shifted markedly in Western democracies. Up to this time, efforts to assess this development have focused on voters and their electoral choices. In this letter, we turn the tables to compare the social bases of political parties. To what extent do political parties have distinct constituencies? What aspects of social structure are expressed in the composition of which political parties? And how does this reflect the waxing and waning of social conflict over time?
Political parties, as Lipset and Rokkan (Reference Lipset, Rokkan, Lipset and Rokkan1967, 2; 4–5) stressed, are “essential agencies of mobilization [translating] contrasts in the social and the cultural structure into demands and pressures for action or inaction.” The conflicts that are institutionalized in political parties confront voters with a structure of political alternatives in what Rohrschneider and Thomassen (Reference Rohrschneider, Thomassen, Rohrschneider and Thomassen2020, 2ff) call “the chain of representation.” How do some divides, but not others, get expressed in party systems, and what are the “core characteristics of the groups of voters mobilized by each party”? Examining which parties are structured and along which social lines reveals a “hierarchy of cleavage bases” that, to borrow E.E. Schattschneider's (Reference Schattschneider1960, 71) language, illuminates which social conflicts are “organized into” politics and which are “organized out.”
This article has two purposes. The first is analytical: to specify the components of a political party constituency as a contribution to cleavage theory. The second is empirical: to measure the composition of party constituencies as they have developed in Europe over the past five decades. We propose a measure that allows systematic comparison of the social bases of political parties and the extent to which change comes from behavioral sources or from shifts in a country's socioeconomic structure. Using data covering a wide range of countries and political parties, the results presented here confirm a decline of cleavage alignment for some parties, alongside structuration for others.
Before we go any further, it may be useful to illustrate how a party perspective differs from the conventional voter perspective. For most of the 20th century, socialist parties were composed predominantly of industrial workers and firmly based on the worker–employer cleavage, yet most industrial workers actually voted for nonsocialist parties. The logic of the situation is illustrated in Table 1. Here, the probability that a worker votes for the socialist party is just 33 per cent (15/(15 + 30)). However, from the party's perspective, things look very different: workers make up 75 per cent of its electorate (15/(15 + 5)). This is akin to the British Labour Party until the second half of the 20th century: the party was composed predominantly of industrial workers but captured only a minority of the working-class vote. As we will see, the implications are far-reaching. For example, a green political party may be composed predominantly of highly educated voters even if most such people vote for other parties.
A working-class party with minority worker support (cell percentages)

Note: Cell percentages.
A working-class party split evenly between workers and nonworkers (cell percentages)

The voter–party paradox has deep theoretical implications. Studies with their eye on the voter probed the decline of social structure and the rise of values and issues in explaining vote choice. This gave credence to dealignment theory, which suggests a process of destructuration in postwar Europe that has unmoored voters from their social backgrounds.
A party perspective reveals a different dynamic. It suggests that destructuration is part of a process in which some cleavages recede while others come into play (Bornschier Reference Bornschier2010; Caramani Reference Caramani2015; Dalton Reference Dalton2018; Deegan-Krause Reference Deegan-Krause, Dalton and Klingemann2006; De Vries and Hobolt Reference De Vries and Hobolt2020; Kriesi Reference Kriesi1998; Norris and Inglehart Reference Norris and Inglehart2019). Old divides lose the capacity to shape human relations as the socializing effect of prior institutions diminishes across generations. Yet, as a cleavage exhausts its grip, there is the ever-present possibility that a new one arises to overlay the old.
Two problems confront the analyst in detecting such patterns. The greater the number of competing political parties, the more difficult it is to point-predict support for a particular party. The voter–party paradox is exacerbated in proportional representation systems where some parties are close neighbors. Even if each party is composed of voters with a single social characteristic, it is likely than no party will capture a majority of such voters.
Measurement
Since Alford (Reference Alford1962) introduced his classic index, the dominant approach to measuring cleavage strength has been to refine logistic models of vote choice that assess the odds that an individual belonging to a social group chooses a specific party over a reference party (Brooks, Nieuwbeerta, and Manza Reference Brooks, Nieuwbeerta and Manza2006; Elff Reference Elff2007).Footnote 1 Whereas the Alford index distinguishes just two classes, recent measures generalize to all relevant classes weighted by the group's population share (Best Reference Best2011; Goldberg Reference Goldberg2020). The Kappa index provides estimates of cleavage strength for nonbinary social characteristics, whereas the Lambda index does this while taking into account group size and party vote share (Goldberg Reference Goldberg2020; Lachat Reference Lachat2007; Langsæther Reference Langsæther2019). These measures evaluate contending explanations for why vote behavior changes for specific groups of voters, though they do not tell us how shifting loyalties affect party composition. As individual-level measures, both the Kappa and Lambda indices are subject to the voter‒party paradox we laid out earlier.
A second line of inquiry has focused on the group sources of support, beginning with Axelrod (Reference Axelrod1972), who introduces a formula to calculate the percentage of a party's voters coming from a social group. This brings us closer to a party perspective by telling us where parties “get their votes from” (Axelrod, Reference Axelrod1972, 11), though it does not tell us whether a party gets more than its share of support from one social group or another. Zingher (Reference Zingher2014; Reference Zingher2019) applies the Axelrod measure to contemporary US parties, and Best (Reference Best2011) modifies the formula to include turnout in comparing eight European countries.
Our proposed measure adopts a party perspective by estimating the overrepresentation or underrepresentation of a social group in a party relative to its size in the society. This takes us a step closer to Lipset and Rokkan's concern with the social distinctiveness of political parties. Lipset and Rokkan conceive cleavage theory as a model of the sequential development of major political alternatives in a party system. While they expect parties to align voters with a given structural characteristic behind historically given programmatic packages, this does not imply that all voters with that characteristic will vote for the same party. A measure of cleavage strength should be sensitive to the degree of group loyalty to a party, alongside that group's weight in society.
Consider the degree to which the social democratic vote is structured by the working class. We would like to know what fraction of the social democratic vote originates from the working class. However, we would also like to know how prevalent the working class is in the electorate. The difference in these numbers is the difference between a conditional and a marginal probability. That is instructive because basic probability theory states that an equality between those quantities means that being working class contains no information at all about the social democratic vote. That would suggest no social democratic party structuration based on the distinction between the working class and other classes.
Let us formalize the idea. Consider a social characteristic S, and let j denote some category of the characteristic (for example, working class). Further, consider the alternatives (that is, political parties) that structure voter choice in an election; a specific alternative is indicated by i (for example, the social democrats). We now define the social basis of party i with respect to characteristic j as:
 $$P_{i, j}^S = 100\cdot ( {\pi_{\,j\vert i}^S -\pi_{.j}^S } ). $$
In Equation 1,  $\pi _{.j}^S $ is the marginal probability that S takes on the value j. This serves as a measure of the accessibility of some group with characteristic j as the potential electorate for a party. Further,
 $\pi _{j\vert i}^S $ is the group share of the vote for party i. The theoretical range of P is between
 ${-}100\cdot \pi _{.j}^S $ and
 $100\cdot ( {1-\;\pi_{.j}^S } ) $. The lower bound is reached when none of the party's electorate possesses the characteristic in question. The upper bound is reached when the entire electorate of the party consists of voters with the characteristic. One can compute a different value of P for each characteristic and each party, and this is what we do in this letter.
It is important to note some properties of P. First, its close relationship to the idea of statistical independence means that the measure relies only on basic rules of probability theory. This makes the measure simple to compute and means we require few extraneous assumptions.
Secondly, the measure can be reparameterized in terms of more conventional measures of behavior. As Butler and Stokes (Reference Butler and Stokes1971) show, one can measure the relationship between a characteristic (j) and the vote for party i by computing π J|i, as we have done here, or by measuring π i|j. The latter shows group j's propensity to vote for i and is customarily computed in behavior, as well as other indices (for example, Goldberg Reference Goldberg2020). It is easily demonstrated, however, that we can also formulate P as (π i|j − π i.)(π .j/π i.), where π i. is the party's vote share. Our party-centered perspective renders Equation (1) the natural choice of formula, but it is compatible with a voter-centric view.
Thirdly, the measure explicitly responds to both changes in a group's party loyalty (a behavioral effect) and the prominence of that group in the electorate (a structural effect). For example, when the characteristic declines in prominence but the party's vote share due to the group remains the same, then P increases. If the characteristic remains equally prominent but the group's contribution to the party vote share declines, then P decreases. Both the Kappa and Lambda measures face complications in parsing the behavioral or structural sources of change in cleavage strength. The Lambda index addresses this by holding group sizes constant to isolate the behavioral component of change (Goldberg Reference Goldberg2020, 76; Lachat Reference Lachat2007, 18–19). By measuring the overrepresentation and underrepresentation of social groups in a party family's electorate in a given year relative to the composition of society at that time, however, P captures structural and behavioral sources of change in real time.
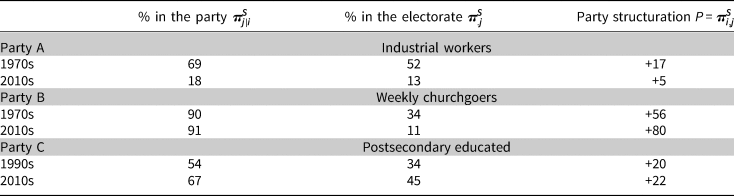
To illustrate how P is computed, we turn to three scenarios (see Table 3). Party A is a social democratic party in which the percentage of industrial workers shrinks even more than the percentage of industrial workers in the workforce and that, as a result, has weaker class structuration in 2010 than in 1970. Party B is a Christian democratic party that is almost exclusively composed of regular churchgoers in a secularizing country. If the proportion of religious voters in the party had shrunk in line with the wider society, we would regard its religious base as constant. However, the gap between the social basis of the party and the wider society has grown, as reflected in its P score. Party C is a green party that has become more educationally structured in a society where the proportion of those with postsecondary education has increased.Footnote 2 In each case, P gauges the increase in the proportion of those with a particular social characteristic in the party relative to the proportion among all voters. Hence, if the tendency of industrial workers to vote for a particular left-of-center party stays the same while the percentage of industrial workers in the electorate shrinks to half its former size, then the proposed measure will register an increase in structuration. The measure allows one to distinguish between the decline of a group in society and the decline of the representation of that group in a party's constituency, and this has the advantage that it becomes possible to detect divergent behavioral responses by political parties to the same exogenous shock.
Three illustrations

Data and Operationalization
Comparative dynamic analysis of cleavages—durable, socially rooted divisions that structure conflict in a society—has been limited to a handful of cases (Best Reference Best2011; Brooks et al. Reference Brooks, Nieuwbeerta and Manza2006; Elff Reference Elff2007; Goldberg Reference Goldberg2020). We extend this to 395 political parties in thirty countries by pooling data from Eurobarometer (1973–2002), the European Election Survey (EES) (1979–2019), and the European Social Survey (ESS) (2002–18).Footnote 3
We also include the emergent education cleavage, not just class and religion. Here, industrial workers are operationalized as manual workers in industry (Eurobarometer) and as production workers (ESS) from Oesch's (Reference Oesch2006) ISCO eight-category schema; religiosity is operationalized as attending religious services at least once a week; and highly educated is operationalized as having completed postsecondary or tertiary education, or as still studying at the time of the survey.Footnote 4
The Transformation of Political Parties in Europe
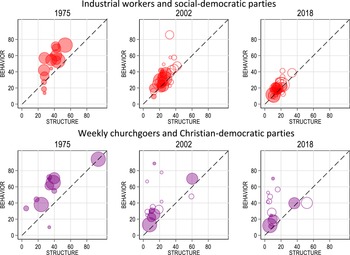
We begin by graphing how the bases of party support have changed since 1975. The panels in Figure 1 for social democratic parties reveal the sharp structural decline of the industrial working class from an average 36.0 per cent of the labor force in the EU-9 in 1975 to 14.0 per cent in 2018. Remarkably, the behavioral decline, estimated as the proportion of industrial workers in social democratic parties, is even sharper—from 49.0 per cent in 1975 to 16.4 per cent in 2018. The result is a reduction in P, the overrepresentation of industrial workers in social democratic parties, from +12.9 per cent in 1975 to +2.4 per cent in 2018. This underpins the observation by Benedetto, Hix, and Mastrorocco (Reference Benedetto, Hix and Mastrorocco2020, 11) that social democratic parties have the support of a decreasing proportion of industrial workers in a declining segment of the workforce (Evans and Tilley Reference Evans and Tilley2017; Gingrich and Häusermann Reference Gingrich and Häusermann2015).
Party composition for class and religion.
Notes: Solid circles denote political parties in the EU-9; hollow circles denote parties in 21 other European countries (see the Online Appendix). Circle size reflects vote share. The x-axis measures structure π .jS, a social category's share in a country; the y-axis measures behavior π j|iS, a social category's share in a party. The vertical distance from the diagonal expresses P, π j,iS, the overrepresentation or underrepresentation of voters with a social characteristic in a party.
Sources: The 1975 Eurobarometer (8 EU countries) and 2002 and 2018 ESS (30 countries).

Comparing  $\pi _{j\vert i}^S $ (behavior) with
 $\pi _{.j}^S $ (structure), we can attribute the lion's share of the shift (59.7 per cent) to behavior and the remaining 40.3 per cent to structural change. The top-right panel in Figure 1 suggests that social democratic parties have lost touch with their traditional industrial worker base across the board. In 2018, industrial workers were barely overrepresented among social democratic parties across 30 European countries.
Christian democratic parties have faced similar structural decline in their core support of weekly churchgoers, from 35.8 per cent in 1975 to 13.1 per cent in 2018. The response of these parties is diverse, and on average, they have not seen a severe reduction in their religious base (1975: P = +19.9; 2018: P = +16.5). However, there is a sharp disparity between Christian democratic parties that gain 20 per cent of the vote or more and that have now almost no churchgoing overrepresentation (P = +1.0), and those gaining a smaller vote share and that remain strongly rooted among churchgoing Christians (P = +31.4).
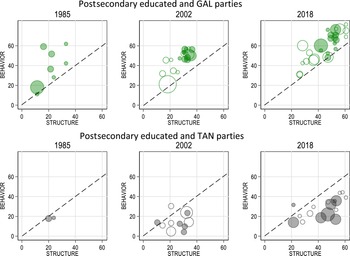
Figure 2 surveys GAL parties and TAN parties on the education divide from 1985. The panels for GAL parties reveal a marked increase in the proportion of those with postsecondary education, from 21.2 per cent in 1985 to 47.3 per cent in 2018. The overrepresentation of highly educated voters in GAL parties has remained stable, with P varying between 14.3 and 19.5 per cent over the period.

Voters with postsecondary education are underrepresented in TAN parties, and increasingly so since 1985. The first such parties that gained national representation, the French Front National and the Italian Movimento Sociale Italiano, had only a slight underrepresentation of highly educated voters (P = −3.7). By 2002, there were five such parties in EU-9 countries with a mean P of −13.6. By 2018, the P for TAN parties in these countries had fallen to −16.7. In 2018, the probability that a TAN voter is highly educated is just 30.6 per cent, compared to 61.6 per cent for a GAL voter. This contrast exists in the context of major structural change, including the rise of mass education, but our measure shows that GAL parties and TAN parties have retained, and even reinforced, their distinctive social composition (Abou-Chadi and Hix Reference Abou-Chadi and Hix2021, 84; Attewell Reference Attewell2021; Marks et al. Reference Marks, Cotta and Isernia2020).
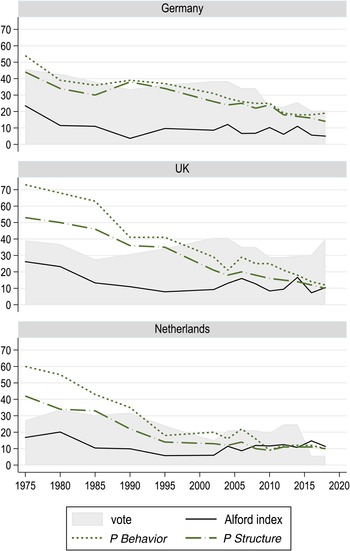
A distinct feature of the P score is that it synthesizes two components—change in social group size (P Structure) and change in a social group's share in a party's constituency (P Behavior)—and we represent these alongside the Alford index for the working class in Figure 3 for Germany, the UK, and the Netherlands from 1975 through 2018.Footnote 5 By (1) considering the two components of P separately and (2) monitoring the distance between the two (which is P), one can shed a more precise light on the forces that produce (de)structuration.
P Behavior, P Structure, and the Alford index for the working class in three countries.
Note: For definitions, see footnote 5.
Sources: Eurobarometer and ESS (1975–2018).

The Alford indices show that industrial workers have become less left-wing oriented. The gap between working-class and middle-class support for left-wing parties is nowadays not much in excess of 10 per cent. The contrast between P Structure and P Behavior reveals that in Germany, the decline in the working-class composition of left-wing parties has been behavioral and structural in about equal measure, whereas in the UK and the Netherlands, the decline has resulted more from the diminishing proportion of left-wing parties' vote share drawn from industrial workers.
Cross-Sectional Comparison
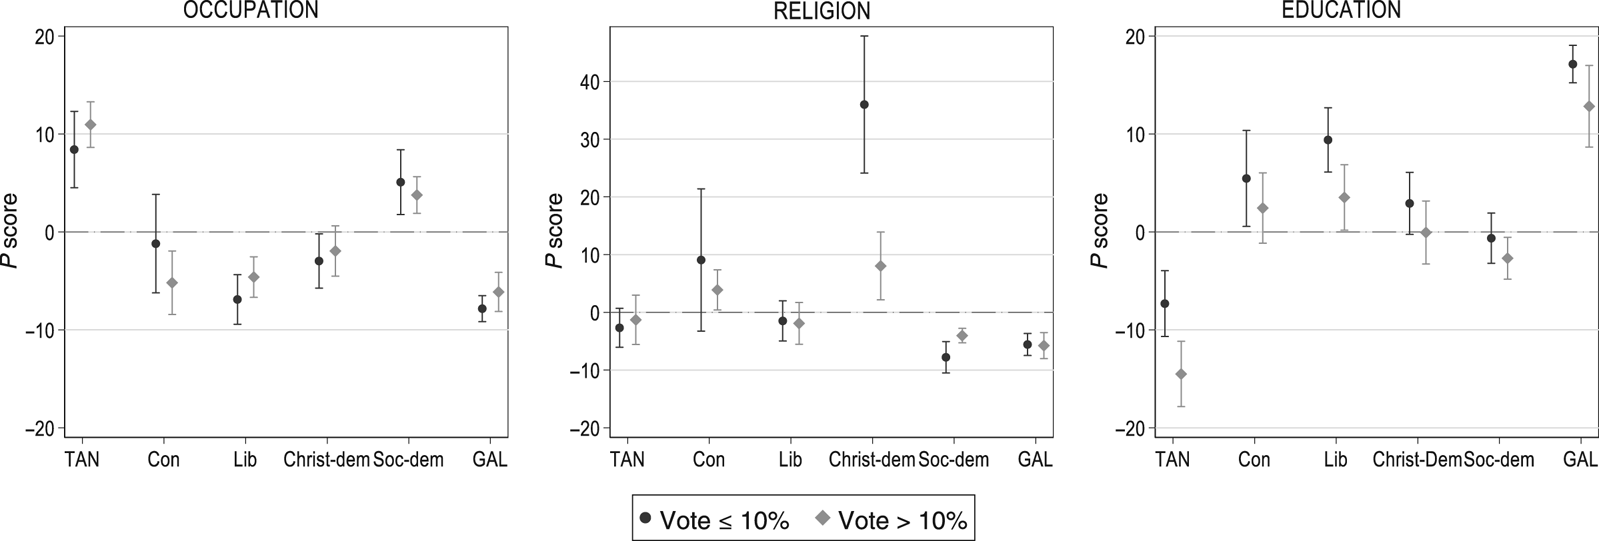
We now use the P measure to compare how electorates of party families are structured on a divide. The panels in Figure 4 predict the overrepresentation or underrepresentation of industrial workers, churchgoers, and the highly educated among party supporters compared to their presence in the population. Party family is a robust predictor of P for each of these characteristics under controls (see Tables D.1–D.3 in the Online Appendix). Figure 4 also illustrates that, with the exception of the Christian democratic family on religion, P scores are not driven by party size.
The effect of party family and party size on the P score.
Note: P for smaller (<+10 per cent) and larger parties, controls for party size, effective number of parties, turnout, country, and year fixed effects; 95 per cent confidence intervals.
Sources: Data from ESS 2002–2018 and EES 2004–2019 for 30 European countries.

The extreme P scores for GAL and TAN parties on occupation and education show that these party families now represent socially distinctive constituencies. The mean difference in P under controls is 28.8 for education and 19.3 for occupation. In contrast, the P scores for conservative, Christian democratic, and social democratic parties on occupation and, even more markedly, on education are close to 0. GAL and TAN parties are now more structured on occupation than party families historically associated with the class cleavage.
Continued religious structuration among Christian democratic parties (P = +20.63) suggests that the decay of cleavages is not an inevitable result of social change and generational replacement. In Europe, religion does not drive a wedge between TAN and GAL parties; on the contrary, these party families tend to share a relatively secular support base.
These observations suggest that the social-structural basis of political parties has shifted rather than receded. Socialist parties have lost the constituency that motivated the class cleavage, and only a subset of Christian democratic parties have retained their religious constituency as “hedgehog” parties of the faithful. The contrasting P scores of socialist and Christian democratic parties reflect the distinctive trajectories of class and religious cleavages (Knutsen Reference Knutsen2018). Moreover, the widening gap in the P scores of emerging GAL and TAN parties on occupation and education throws into sharp relief the social basis of polarization in contemporary Europe.
How central is party family for predicting P scores? To answer this question, we use variable inflation factor analysis, employing a permutation-based approach inspired by machine learning (Breiman Reference Breiman2001). If a variable is important, predictive performance, measured as the root mean squared error (RMSE), should decline if we permutate the values of that variable. The greater the drop in performance, the more important a variable is. By this criterion, party family is by far the most important predictor, regardless of whether we consider structuration on occupation, religion, or education (see Online Appendix F).
Conclusion
We propose a cleavage measure that has distinctive virtues: it focuses on the social structuration of political parties, rather than on individual voting; and it provides a transparent method for assessing the relative weight of social-structural and behavioral factors for party composition. Although we have not done so here, the moorings of our measure in tabular analysis make it possible to generalize the logic to multiple groups and/or political parties.
We apply the measure in temporal and cross-sectional comparisons of political parties in Europe over the past five decades. This confirms prior analyses of the decline of the class and religious cleavages for mainstream parties but differs in detecting stability for some party families and structuration for others. Christian democratic parties have bifurcated in response to secularization, and, most importantly, GAL and TAN parties are polarized on occupation and education.
The proposed measure is directly relevant to questions about the sources and consequences of party strategy. What factors shape the social structuration of a political party (Dalton Reference Dalton2018; Kriesi Reference Kriesi1998)? Does the fate of mainstream parties and their declining P scores reveal the future to challenger parties (De Vries and Hobolt Reference De Vries and Hobolt2020)? How does social structuration play into affective polarization (Gidron, Adams, and Horn Reference Gidron, Adams and Horn2020; Harteveld Reference Harteveld2021; Reiljan Reference Reiljan2020), value change (Knutsen Reference Knutsen2018; Langsæther Reference Langsæther2019), and group identities (Bornschier et al. Reference Bornschier2021)? How much agency do political parties have in shaping the structure of political alternatives in a society (Evans and Tilley Reference Evans and Tilley2012; Green-Pedersen Reference Green-Pedersen2019; Rohrschneider and Whitefield Reference Rohrschneider and Whitefield2009; Rovny Reference Rovny2015)? And how does a measure of cleavage strength shed light on party development beyond Europe (Bornschier Reference Bornschier2019)? By more systematically assessing the social structuration of political parties, the measure proposed here will help advance research agendas at the nexus of party systems, social structure, and party strategy.
Supplementary Material
Online appendices are available at: https://doi.org/10.1017/S0007123421000740
Data Availability Statement
Replication data for this article can be found in Harvard Dataverse at: https://doi.org/10.7910/DVN/TAI0UW
Acknowledgments
We would like to thank Marina Costa Lobo, Ruth Dassonneville, Pedro Magalhães, Emiliano Grossman, Edgar Grande, Swen Hutter, Nicolas Jabko, and Seth Jolly for comments.
Author Contributions
The coauthors contributed equally to this article.
Financial Support
This work was supported by an Advanced ERC Grant TRANSNATIONAL (#885026) and a Horizon 2020 grant EUENGAGE (#649281).
Competing Interests
None.