





As of 2022, the World Food Programme estimated that around 418 million children were receiving meals through school nutrition programmes, up from 388 million children reached before the pandemic in early 2020(1). These initiatives are generally guided by two main goals: (1) alleviating child food insecurity and (2) improving educational outcomes. In the USA, the National School Lunch Program, launched in 1946, exemplifies these efforts to combat hunger and support education through school-based nutrition(2). It was later complemented by the National School Breakfast Program(Reference Tingling-Clemmons and Kittlaus3,4) , introduced permanently in 1975, to ensure students begin their day with adequate nutrition. Initially, both programmes required individual applications based on household income. To broaden access, the Community Eligibility Provision (CEP) was introduced in 2014, allowing high-poverty schools to offer free meals to all students without the need for individual applications(5).
In the past decade, advances in nutrition science linking adequate nutrient intake to various dimensions of health have shifted the conversation around school meals, from a focus on access and calorie sufficiency to a broader emphasis on improving food quality and composition(Reference Gearan and Fox6). This shift has been strongly reinforced by recent federal efforts: in early 2024, the US Department of Agriculture announced a series of initiatives as part of the National Strategy on Hunger, Nutrition and Health, aiming to improve child health through enhanced school meals(7). These include proposals to gradually tighten standards around added sugars, sodium and whole grains. California has also made investments to aid the transition of the state’s school meal programme to real food, including funding School Meals for All and the California Department of Education’s (CDE) Kitchen Infrastructure and Training funding.
In this evolving policy landscape, California’s Eat Real programme (https://eatreal.org/), established in 2019, serves as an example of how school districts can implement higher nutrition standards. Eat Real supports districts in transitioning from ultra-processed foods to minimally processed meals prepared with sustainably sourced ingredients. Its certification standards not only align with but often exceed (Supplemental material 1) recent federal nutrition guidelines(8), positioning Eat Real as a candidate model for advancing meal quality and student well-being nationwide. Although Eat Real shares federal priorities related to fruit, vegetable and whole grain intake, it extends beyond these requirements in several important ways. First, it explicitly targets added sugars and ultra-processed foods. At the time of its initial implementation, federal standards did not yet include limits on added sugars (these were introduced later), and ultra-processed foods remain thus far unregulated. Second, Eat Real incorporates implementation-focused criteria, such as measuring the proportion of staff actively encouraging fruit and vegetable consumption, thereby addressing not only what is served but also the social and behavioural context in which foods are consumed. Third, five standards address broader dimensions of school food systems, including sustainability, responsible protein sourcing, menu variety beyond fruits and vegetables, food waste reduction and nutrition education, domains not captured by federal standards. Together, these distinctions suggest that Eat Real addresses not only nutrient composition but also behavioural, environmental and educational determinants of diet. This more comprehensive, systems-oriented approach may improve students’ dietary quality, including greater intake of nutrients that support brain function, potentially leading to academic and health benefits beyond those achieved through nutrient-based federal standards alone(Reference Mou, Blok and Barroso9–Reference Bronfenbrenner11).
Although Eat Real has conducted internal assessments to strengthen implementation and align with its core standards, its potential to improve academic performance (a key goal of school meal programmes) remains unevaluated. Based on the Social Ecological Model(Reference Bronfenbrenner11), which emphasises how environmental contexts influence individual behaviours and overall health, this study addresses this gap by analysing school-level standardised academic test results in English Language Arts (ELA) and Mathematics (Math) across adoptees of Eat Real v. non-participating schools in California.
Methods
Intervention: the Eat Real programme
Participation in the Eat Real programme begins with a commitment from school districts to adhere to a comprehensive set of ten core standards designed to elevate the quality of food served in school cafeterias (Supplemental material 1). The certification process involves an initial comprehensive evaluation of a school district’s meal practices (up to 6 months), followed by the creation and implementation of an action plan to address any gaps identified (6 months +, Supplemental material 2). The process typically spans 1 or 2 years, with the evaluation conducted before and after implementation of the action plan. Districts are then certified at one of four levels: Green (60 % of standards met) (Supplemental material 3), Silver (80 % of standards met), Gold (85 % of standards met) or Platinum (90 % of standards met) (Supplemental material 4). Upon achievement, Eat Real certification continues for a 3-year period. This process supports the long-term transformation of school food systems.
In California, the Eat Real programme was gradually introduced across ten public school districts between October 2019 and October 2023. These districts included Walnut Creek (October 2019), Capistrano, Morgan Hill, San Luis Coastal, North Monterey County and South Monterey County Joint Union High School Districts (all in October 2021), followed by Pajaro Valley in March 2022, Fresno and Natomas in October 2022 and Western Placer in October 2023.
Starting dates were obtained from Eat Real administrative records, with schools considered ‘adoptees’ (i.e. participating) based on the academic year their district formally entered the programme, beginning at the start of that school year: 2019–2020 (2019 cohort), 2021–2022 (2021 cohort), 2022–2023 (2022 cohort) and 2023–2024 (2023 cohort). This staggered rollout across districts and time created variation in exposure, which we leveraged in our analysis (see the Main Analyses section for details).
Outcomes
Student academic performance was assessed using the Smarter Balanced Summative Assessment in both ELA and Math, administered each spring to students in grades 3 through 8 and 11(12). These assessments are aligned with Common Core State Standards and aim to measure students’ progress towards college and career readiness. Student performance is categorised into four achievement levels: Level 1 (Not Meeting Standards), Level 2 (Nearly Meeting Standards), Level 3 (Meeting Standards) and Level 4 (Exceeding Standards). The primary outcome in our analysis was the school-level percentage of students meeting or exceeding standards (Levels 3 and 4), consistent with California’s accountability reporting, for all grades. These data were obtained from the CDE for both Eat Real-participating and non-participating schools. Annual data from 2017 to 2024 were used, covering 2 years before the first and after the last wave of programme adoption (see the Exposure section for details on timelines). For the 2019/2020 school year, no data were available due to disruptions caused by COVID-19.
Covariates
We controlled our models (refer to the Statistical Analysis section) for school-level characteristics at baseline(Reference Localio, Knox and Basu13) (i.e. 2018, 1 year prior to the programme’s inception), including the percentage of students eligible for free and reduced-price meals and the number of Hispanic and male students enrolled (primary enrolment). Adjusting for the percentage of children eligible for free or reduced-price meals (before 2022, when universal free meals were adopted state-wise) is crucial as it accounts for several external factors that influence academic performance. Higher eligibility typically reflects not only communities/neighbourhoods with greater economic disadvantages but also school CEP participation(Reference Localio, Knox and Basu13) and, more generally, limited school resources, which can affect the quality of education and available support. A county-level indicator was also adjusted for to account for regional differences. These covariates were all sourced from the CDE (Downloadable Data Files - Accessing Educational Data (CA Dept of Education)).
Population
The composition of the participating (adoptee) and non-participating (control) school groups was determined by data availability constraints. To ensure consistent measurement over time, schools missing complete data on test scores and covariates for all study years (2017–2024) were excluded. This resulted in two separate analytic samples: one for ELA, comprising forty-nine Eat Real-participating schools (adoptees) along with 2463 non-participating (control) schools, and another for Math, comprising fifty adoptee schools and 2465 controls. Forty-nine adoptee schools overlapped across both samples, with one additional adoptee school included only in the Math analysis. A total of 2410 control schools were common to both samples. The 2019 and 2023 adoption cohorts (i.e. Walnut Creek and Western Placer district) were excluded due to data completeness issues (lack of participating schools with complete CDE records), leaving only the 2021 and 2022 adoption cohorts in the final analysis. A complete list of the selected adoptee schools and their associated districts is provided in Supplementary Material 5. Among the fifty adoptee schools (forty-nine in both ELA and Math and one additional school in Math only), over half were high schools (62 %), 18 % elementary schools, 4 % middle schools and 16 % mixed-level schools. In comparison, high schools represented 33 % of the ELA control group, while elementary schools accounted for 28 %. For Math, high schools represented 31·3 % of the control group and elementary schools 29·7 %. Of note, none of the participating districts underwent reorganisations between 2017 and 2024.
Statistical analyses
Main analyses
In our primary analysis, we examined the relationship between participation in the Eat Real programme and the school-level percentage of students meeting or exceeding California academic standards using a staggered difference-in-differences (DiD) approach(Reference Callaway and Sant’Anna14). This method accounts for staggered programme rollout across districts and was recently used to assess California’s universal free meals policy on childhood obesity(Reference Localio, Knox and Basu13). Similar to a traditional DiD design, which compares outcomes between participating v. non-participating schools (adoptee v. control groups) before and after programme adoption, this approach estimates the effects separately for each adoption cohort, comparing academic performance during each year of participation to the year before adoption (Fig. 1). The results are then aggregated by both adoption cohort and time since programme adoption. The overall effect is calculated by pooling the estimates from each adoption cohort(Reference Callaway and Sant’Anna14). Our primary approach employed a doubly robust regression model to obtain estimates, adjusting for covariates and clustering by school code, with the models weighted according to school population size at baseline(Reference Localio, Knox and Basu13,Reference Callaway and Sant’Anna14) . This approach integrates propensity score and outcome models, ensuring consistent estimation despite misspecification of either, thereby enhancing robustness and efficiency in staggered DiD analyses.
Illustration of the staggered difference-in-differences design used to evaluate the Eat Real programme. Cohort-specific effects are estimated by comparing each post-adoption year (Year 1, Year 2, etc.) with the year immediately before adoption (baseline), using schools that have never adopted the programme as comparison groups. Estimates are then aggregated across adoption cohorts and event time to obtain the overall treatment effect.

The DiD design is based on the assumption of conditional parallel trends, meaning that while baseline outcomes do not need to be identical across groups, the trends in outcomes prior to the programme adoption should be similar. This assumption is crucial for ensuring that the control groups serve as valid comparison groups, so that any differences observed post-programme can be attributed to the intervention. To validate this, we used the universal approach, fixing a single pre-policy reference year for all groups to provide a consistent baseline for assessing parallel trends. Additionally, we assumed no anticipation effects, meaning that schools did not alter their behaviour in the years leading up to the programme’s adoption.
Sensitivity analyses
To better understand the impact of the intervention across different achievement thresholds, we conducted secondary analyses focusing separately on students who did not meet the standards (Level 1), those who met the standards (Level 3) and those who exceeded the standards (Level 4). We also revised the comparison group to be not-yet-treated schools, including both non-participating schools and those that had not yet started the programme at a given time, even if they adopted it later. We then incorporated a 6-month anticipation period, shifting the reference period to account for potential early programme effects. Importantly, as shown in Supplementary Materials 3 and 4, certification levels showed little variation across included districts (most were Green-certified, with only one Silver), precluding stratified analyses by certification level.
Because the parallel trends test may lack power, we assessed robustness to potential undetected violations using the honest DiD framework for all analyses yielding statistically significant effects (both main and above-mentioned sensitivity analyses)(Reference Rambachan and Roth15). This approach allows post-treatment deviations to vary within bounds anchored in pre-treatment trends. We implemented two complementary strategies: Relative Magnitude, which bounds the overall size of the post-treatment deviation relative to the pre-treatment difference, and Smoothness Restrictions (SR), which bounds how much this deviation can change from 1 year to the next. In short, Relative Magnitude limits how large the overall violation can be, while SR limits how quickly the violation can evolve.
For these analyses, we used the ‘did’ package in R (version 4.3.3).
Results
Descriptive characteristics
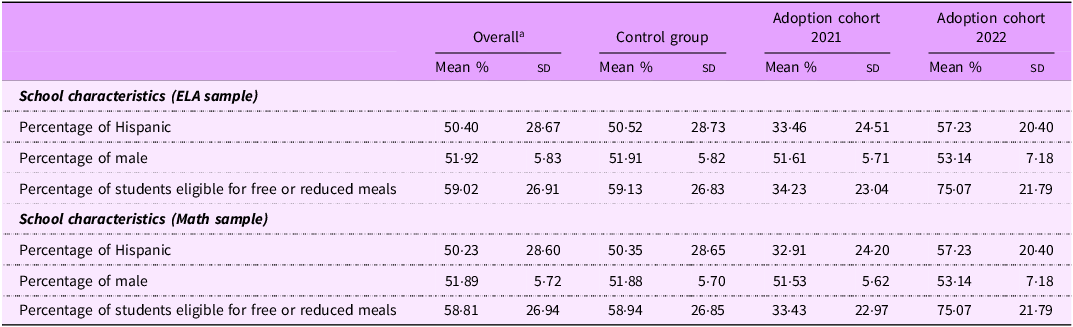
Table 1 presents key school characteristics overall, as well as by adoptee group and separately for the ELA and Math outcome samples. While control schools closely match the overall averages, 2021 adoptee schools had fewer Hispanic students and lower eligibility for free or reduced-price meals. In contrast, 2022 adoptee schools had a higher percentage of Hispanic students and a greater share of students from low-income backgrounds. The proportion of male students remained relatively stable across all groups.
Baseline (2018) school demographic characteristics overall and by adoption cohort

Table 1. Long description
The table presents school characteristics for the ELA and Math samples, comparing overall data, control group, and adoption cohorts for 2021 and 2022. It includes three rows for each sample type, detailing the percentage of Hispanic students, percentage of male students, and percentage of students eligible for free or reduced meals. The table has eight columns: Overall Mean percentage, Overall Standard Deviation, Control group Mean percentage, Control group Standard Deviation, Adoption cohort 2021 Mean percentage, Adoption cohort 2021 Standard Deviation, Adoption cohort 2022 Mean percentage, Adoption cohort 2022 Standard Deviation. For the ELA sample, the percentage of Hispanic students is 50.40 percent overall, with variations across groups. The percentage of male students is relatively stable around 51.92 percent overall. The percentage of students eligible for free or reduced meals is 59.02 percent overall, with notable differences in the adoption cohorts. For the Math sample, similar trends are observed with slight variations in the percentages.
All schools were not exposed at baseline (2018). ELA, English Language Arts.
a Analytic samples include, for ELA, forty-nine Eat Real-participating schools and 2463 non-participating (control) schools and, for Math, fifty participating (adoptee) schools and 2465 non-participating (control) schools.
Figure 2 reveals unadjusted trends in ELA and Math performance by adoption cohort. The mean baseline (2018) of children meeting or exceeding standards for ELA was 49·9 % overall (control and adoptee groups pooled) and 36·0 % for Math.
Unadjusted trends in percentage of children meeting or exceeding standards in English Language Arts (ELA) and Mathematics over time by adoption cohort. Analytic samples include, for ELA, forty-nine Eat Real-participating schools and 2463 non-participating (control) schools, and, for Math, fifty participating schools and 2465 non-participating (control) schools. All schools were not exposed to the programme in 2018. Schools are grouped by the year they began working with Eat Real (i.e. by adoption cohort). Data for the 2019 school year were unavailable due to disruptions caused by the COVID-19 pandemic.

Main analyses
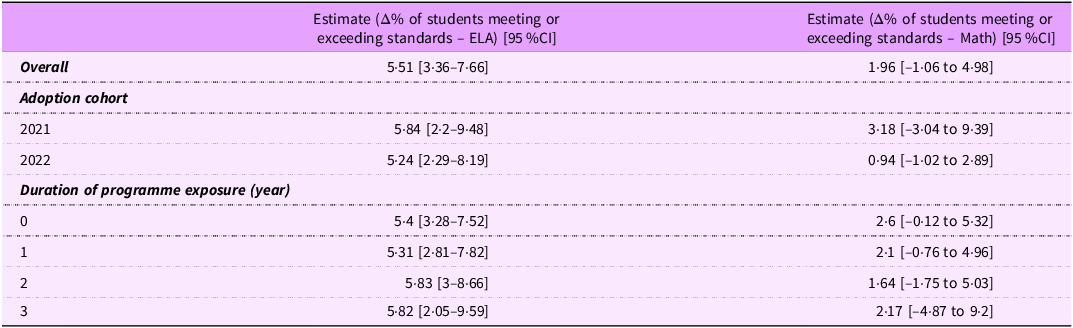
Table 2 and Figs. 3 and 4 present results from the adjusted staggered DiD model. Joint tests for pre-trends were not statistically significant for either outcome (p = 0·33 for ELA; p = 0·41 for Math), supporting the parallel trends assumption. As shown in Table 2, schools adopted under the Eat Real programme experienced an overall +5·51-percentage point (pp) rise in the proportion of students meeting or exceeding ELA standards across all evaluated grades (3–8 and 11), relative to non-participating schools [95 % CI: [3·36–7·66]. While the overall effect for Math was not statistically significant, a positive trend was observed (+1·96 pp, [–1·06 to 4·98]).
Aggregate post-adoption effect of the Eat Real programme on school performance (meeting or exceeding standards)

Table 2. Long description
The table presents the estimated percentage of students meeting or exceeding standards in ELA and Math due to the Eat Real program. It includes overall estimates, adoption cohort estimates for 2021 and 2022, and estimates based on the duration of program exposure (0 to 3 years). The table has 3 groups of rows: Overall, Adoption cohort, and Duration of program exposure. The columns are Estimate (percentage of students meeting or exceeding standards - ELA) and Estimate (percentage of students meeting or exceeding standards - Math). Row 1: Overall, 5.51 [3.36-7.66], 1.96 [-1.06 to 4.98]. Row 2: Adoption cohort, 2021, 5.84 [2.2-9.48], 3.18 [-3.04 to 9.39]. Row 3: Adoption cohort, 2022, 5.24 [2.29-8.19], 0.94 [-1.02 to 2.89]. Row 4: Duration of program exposure, 0, 5.4 [3.28-7.52], 2.6 [-0.12 to 5.32]. Row 5: Duration of program exposure, 1, 5.31 [2.81-7.82], 2.1 [-0.76 to 4.96]. Row 6: Duration of program exposure, 2, 5.83 [3-8.66], 1.64 [-1.75 to 5.03]. Row 7: Duration of program exposure, 3, 5.82 [2.05-9.59], 2.17 [-4.87 to 9.2].
It is important to note that participation in the Eat Real programme usually begins at the start of the academic year, while standardised testing occurs at the end of each school year. As a result, the first year following adoption (labelled as ‘year 0’ in the analysis) represents one full year of exposure to the programme. Accordingly, ‘year 1’ reflects 2 years of participation, ‘year 2’ corresponds to 3 years and ‘year 3’ corresponds to 4 years of participation.
Exposure effects were estimated using the Callaway/Sant’Anna difference-in-differences outcome estimator(Reference Callaway and Sant’Anna14), weighted by school size and conditional on covariates.
ELA, English Language Arts.
Cohort effects of Eat Real adoption on academic performance (meeting or exceeding standards). It is important to note that participation in the Eat Real programme usually begins at the start of the academic year, while standardised testing occurs at the end of each school year. As a result, for the 2021 and 2022 adoption cohorts, the points labelled 2021 and 2022 on the graph, respectively, represent one full year of exposure to Eat Real, with each following year reflecting an additional year of exposure. Difference-in-differences estimates are from the Callaway/Sant’Anna outcome estimator(Reference Callaway and Sant’Anna14). Estimates are grouped by the year schools adopted Eat Real, weighted by school size and conditional on covariates. The reference group is eligible, non-participating schools, and the reference year is 1 year before adoption. Results of the joint test indicated that the pre-adoption effect was not statistically different from zero. Data missing for school year 2019 (COVID-19).

Dynamic effects of Eat Real adoption on academic performance (meeting or exceeding standards). It is important to note that participation in the Eat Real programme usually begins at the start of the academic year, while standardised testing occurs at the end of each school year. As a result, the first year following adoption (labelled as ‘year 0’ in the analysis) actually represents one full year of exposure to the programme. Accordingly, ‘year 1’ reflects 2 years of participation, ‘year 2’ corresponds to 3 years and ‘year 3’ corresponds to 4 years of participation. Pre- and post-adoption difference-in-differences estimates are from the Callaway/Sant’Anna outcome estimator(Reference Callaway and Sant’Anna14). Estimates are aggregated relative to the year schools started to work with Eat Real (time = –1). Results of the joint test indicated that the pre-adoption effect was not statistically different from zero. Data for the 2019 school year were unavailable due to disruptions caused by the COVID-19 pandemic.

Fig. 4. Long description
Two line graphs depict estimates by time since Eat Real adoption in English Language Arts and Mathematics. Panel A: The line graph shows the change in the percentage of students meeting or exceeding standards in English Language Arts over time. The x-axis represents years since adoption, ranging from -5 to 3, and the y-axis represents the change in percentage, ranging from -5 to 10. The graph includes two periods: Before Eat Real (gray circles) and After Eat Real (purple triangles). The data points for the After Eat Real period show an upward trend, indicating an increase in the percentage of students meeting or exceeding standards over time. Panel B: The line graph shows the change in the percentage of students meeting or exceeding standards in Mathematics over time. The x-axis represents years since adoption, ranging from -5 to 3, and the y-axis represents the change in percentage, ranging from -5 to 5*. The graph includes two periods: Before Eat Real (gray circles) and After Eat Real (blue triangles). The data points for the After Eat Real period show a non significant upward trend..
Table 2 and Fig. 3 also show effects by adoption cohort. For ELA, the 2021 adoption cohort exhibited the strongest gains (+5·84 pp, [2·2–9·48]), followed by the 2022 cohort (+5·24 pp, [2·29–8·19]). No significant effects were found for Math in either cohort.
Table 2 and Fig. 4 display dynamic effects by time since the programme adoption. For ELA, gains were consistently positive post-adoption, with statistically significant effects observed over the first four years of participation. In Math, no significant impacts emerged in the first-, second-, third- or fourth-year post-programme adoption.
Sensitivity analyses
Using the honest DiD framework confirmed the robustness of our main analysis: the Eat Real programme’s effect on students meeting or exceeding ELA standards (Supplemental Material 6, Table 1). Under Relative Magnitude, results remained significant for mean values of 0·5–1, indicating that the overall post-adoption violation was at most half to equal the pre-adoption trend. Under SR, the effect persisted even with year-to-year trend shifts of 2·5–3 pp. Of note, sd of year-to-year pp changes across participating and non-participating schools was around 3–4 pp.
As detailed in Supplemental Material 7, ELA experienced a significant increase in the share of students exceeding standards (+4·91 pp [2·81–7·01]), with no analogous change in Math (Supplemental 7 Table 1). Math and ELA did not show significant gains in students meeting (but not exceeding) standards (Supplemental 7 Table 2). Both subjects exhibited declines in the proportion not meeting standards (ELA: –4·64 pp [–6·44 to –2·84]; Math: –2·3 pp [–4·44 to –0·16]) (Supplemental 7 Table 3). Notably, the parallel trends assumption held only for Math (meeting and not meeting) and ELA (exceeding), lending greater credibility to these findings; other results (i.e. Math/exceeding; ELA/not meeting; ELA/meeting) may warrant more cautious interpretation. Nevertheless, our honest DiD analyses indicated that the above-mentioned three significant results were somewhat robust to potential violations of parallel trends. Specifically, under SR, effects remained consistent for moderate trend shifts: up to 2–2·5 pp/year for ELA/exceeding, up to 2–2·5pp/year for ELA/not meeting and up to 0·5–1 pp/year for Math/not meeting (Supplemental Material 6, Tables 2, 3 and 4). Of note, sd of year-to-year pp changes across participating and non-participating schools for these three analyses was around 2–4 pp.
Main results (Table 2) remained stable when varying the comparison group (using not-yet-adopted schools) and adding a 6-month anticipation window. Eat Real’s effect on ELA students meeting or exceeding standards was consistent (+5·51 pp [3·37–7·66] and +5·51 pp [3·36–7·66]), as were the non-significant Math results (+1·95 pp [–1·07 to 4·98] and +1·96 pp [–1·06 to 4·98]). Effects were consistent across cohorts and years post-adoption. Joint tests confirmed no pre-adoption effects, while the honest DiD analyses confirmed the robustness of the ELA results to potential parallel trend violations: under SR, the effects persisted even with a substantial trend shift (up to 2·5–3 pp/year) for both the not-yet-adopted schools and anticipation analyses (Supplemental Material 6, Tables 5 and 6). Of note, sd of year-to-year pp changes across participating and non-participating schools was around 3–4 pp.
Discussion
Among California public schools, those enrolled in the Eat Real programme saw an overall +5·51 pp increase in students meeting or exceeding ELA standards compared with eligible non-participating schools, and dynamic effect estimates revealed sustained improvements over 3 years of programme participation. For Math, an overall small effect among students not meeting (−2·3 pp) standards was observed.
The positive results observed in ELA align with, and may help clarify, the mixed findings reported in prior research on the relationship between school meal programmes and academic performance. While some studies examining the effects of the National School Lunch Program and similar access-focused school meal initiatives have found improvements in student outcomes(Reference Frisvold16–Reference Schwartz and Rothbart21), still others have reported null effects(Reference Gordanier, Ozturk and Williams20,Reference Schanzenbach and Zaki22,Reference Leos-Urbel, Schwartz and Weinstein23) . One possible explanation for this inconsistency lies in the primary focus of many existing programmes on increasing access and caloric sufficiency, rather than on improving the nutritional quality of meals. Simply increasing access to food may not sufficiently address the biochemical processes essential for cognition and learning(Reference Bryan, Osendarp and Hughes24,Reference Taras25) . In contrast, Eat Real’s emphasis on minimally processed, nutrient-dense meals may better support central nervous system mechanisms related to concentration, memory and executive functioning that may be driving the gains seen in ELA scores in this study(Reference Mou, Blok and Barroso9,Reference Cohen, Gorski and Gruber10) . This may occur, in part, through improvements in metabolic health, as prior studies have shown that adolescents with metabolic syndrome exhibit structural and functional brain impairments, including reduced hippocampal volume and executive function(Reference Yates, Sweat and Yau26,Reference Yau, Castro and Tagani27) . Improvements in diet (particularly reducing added sugar and increasing fibre) can improve insulin sensitivity and metabolic markers(Reference Schwarz, Noworolski and Erkin-Cakmak28), which in turn may enhance cognitive performance. These mechanisms are likely contributors to the ELA gains observed in this study. However, we cannot conclusively determine whether the observed improvements are driven by enhanced cognitive function or by changes in behaviour, such as improved attention or impulse control. Future research incorporating behavioural, blood and physiological data would help clarify these pathways.
The differing associations observed between ELA and Math outcomes likely reflect the unique cognitive demands of each discipline(Reference Bernabini, Bonifacci and De Jong29). We propose that language-based skills (reliant on memory, attention and verbal processing) may respond more readily to dietary improvements. Conversely, mathematical reasoning might necessitate longer exposure or targeted nutritional enhancements to yield measurable gains. This could explain the increase in students exceeding ELA standards, while Math improvements were confined to basic proficiency. Nevertheless, a recent report found the CEP impacted Math but not ELA, contrasting with our study; however, it focused on South Carolina elementary schools from 2014 to 2016(Reference Gordanier, Ozturk and Williams20).
Public health implications
As California and other states advance towards universal free meal policies, the findings of this study, if confirmed by further individual-level studies, may suggest investing not only in broadening access to school meals but also in enhancing their nutritional quality. Eat Real appears to support student learning outcomes and offers a compelling model aligned with recent federal updates to school meal standards(7). Moreover, school nutrition policies may strategically align with broader equity objectives. In high-poverty districts, where students often depend on school meals as their primary source of nutrition, improving meal quality can help reduce health disparities rooted in broader socio-economic inequities(Reference Kenney, Barrett and Bleich30). Thus, the Eat Real programme has the potential to yield both immediate academic benefits and long-term public health gains. By strengthening both educational performance and overall well-being, expanding and scaling the Eat Real programme nationwide could potentially help ensure that all students, regardless of socio-economic background, have access to nutrition essential for academic success and long-term opportunity. The programme’s cost-effectiveness is currently under review, although early data suggest that many districts improved meal quality while maintaining balanced budgets and increasing revenue. Nonetheless, while programmes like Eat Real aim at improving the nutritional quality of school meals, which may support improvements in academic performance, they are not a stand-alone solution. To fully address educational disparities, such initiatives must be implemented in tandem with broader strategies targeting learning environments, socio-emotional support and equitable resource allocation across schools.
Limitations, strengths and future directions
The data used in this study were obtained from the CDE and aggregated at the school level, rather than the individual student level. While school-level test scores provide valuable insights, a more nuanced understanding of school meal quality and children’s outcomes requires individual-level data over time, covering academic performance, dietary intake and other health metrics. Such data would enable the examination of dose–response relationships, the identification of vulnerable or responsive subgroups and the assessment of mediating pathways. It is also important to note that the data were originally collected for administrative purposes rather than for research, leading to several limitations. Missing data were common, and most participating schools with complete data were high schools, so the analytic sample may not fully represent all Eat Real–adoptee schools. Additionally, due to missing data, we could not adjust for English learners, but variables like free/reduced-price meal eligibility and Hispanic enrolment may approximate the school’s social and linguistic diversity. Even with broader coverage, these findings are specific to California, which, while large and diverse, is not nationally representative. Most students in our sample were Hispanic, reflecting the demographics of low-income children in California. Regional and demographic differences may influence how interventions relate to outcomes. Finally, the study period overlapped with the COVID-19 pandemic, which introduced two challenges. First, statewide school closures created missing test score data in 2019–2020, and in 2020–2021, participation varied across schools, affecting data availability. Second, pandemic-related disruptions likely influenced student academic performance broadly starting in 2020. For the 2021 and 2022 adoption cohorts, the pre-policy reference years (2020 and 2021, respectively) immediately followed the pandemic, a period marked by variable recovery trajectories. While this could have added noise to the test scores, our parallel trends analysis for the main analysis did not reveal systematic differences between participating and non-participating schools in the pre-policy period. This suggests that pandemic-related dynamics did not differentially affect participating v. non-participating schools, supporting the validity of our non-participating groups as counterfactuals. Furthermore, even when assuming substantial post-adoption deviations from parallel trends, our honest DiD analysis indicated that the main ELA results remained robust to year-to-year shifts of up to 2·5–3 pp. This suggests that accounting for substantial differential COVID recovery would not alter the significance of the effects. Analyses disaggregated by proficiency level (exceeding only, meeting only and not meeting standards) similarly showed robust results. At the same time, examining Eat Real during this challenging period offers additional value: it reflects real-world programme implementation under structural disruptions and provides insight into how school food initiatives perform in the face of substantial external shocks, information that is highly relevant for assessing potential programme resilience in future crises. Finally, despite these constraints, we applied a rigorous analytic strategy to make the most of the available data and generate meaningful insights.
Conclusion
Evaluation of the Eat Real programme highlighted a positive and sustained relationship to students’ academic performance, particularly in ELA and, to a lesser extent, Math. These improvements thus underscore the association between nutrition and conglomerate academic achievement, two fundamental drivers of long-term social and economic advancement. While individual-level research is needed, these findings point to the potential value of prioritising expanded access to nutritious, high-quality, minimally processed school meals.
Supplementary material
For supplementary material accompanying this paper, visit https://doi.org/10.1017/S1368980026103504.
Data availability statement
The combined datasets used and/or analysed during the present study are available from the corresponding author on reasonable request. Individually, each of the datasets used in this study is publicly available through this website: Downloadable Data Files - Accessing Educational Data (CA Dept of Education).
Acknowledgements
The authors would like to thank the CDE for their extensive work to create, document and improve the studied data.
Financial support
This study was funded by the Southern California Center for Chronic Disease Research and Prevention from the National Institute of Minority Health Disparities P50 MD017344. The content is solely the responsibility of the authors and does not necessarily represent the official views of the National Institute of Minority Health Disparities.
Competing interests
There are no conflicts of interest.
Authorship
Alexandra Descarpentrie conducted the analyses and drafted the original manuscript. Arkadev Ghosh reviewed the code and contributed to manuscript revisions. Norra LaTorre, Kristin Zellhart, Robert H. Lustig, Jordan Shlain, Natalie Linden and Tanya L. Alderete contributed to critical revisions of the manuscript. Michael I. Goran also contributed to critical revisions of the manuscript and supervised the research.
All authors approved the final manuscript as submitted and agree to be accountable for all aspects of the work.
Ethical standards
Not applicable.
Consent for publication
Not applicable.




 Open access

