I. INTRODUCTION
Developing the ability to control surface composition in a way that approaches the ease with which solutions can be prepared remains an important goal of surface and interface science. A convenient approach to controlling interfacial structure is the spontaneous chemisorption of alkanethiols (or dialkyl disulfides) to form self-assembled monolayers (SAMs) on gold.Reference Love, Estroff, Kriebel, Nuzzo and Whitesides1 Adsorption of SAMs from solutions containing a mixture of thiols with different tail groups provides an added degree of flexibility in the preparation of more complex surfaces. Such systems with equivalent chain lengths have been systematically studied and are often characterized by a nonlinear relationship between the composition of the SAMs and that of the solutions from which they were adsorbed.Reference Bain and Whitesides2–Reference Tsai, Sun and Lin10 Competitive adsorption/equilibration from mixtures of thiols having different chain lengths have also been reported.Reference Bertilsson and Liedberg5, Reference Larsen and Gothelf9–Reference Yu, Soolaman, Rowe and Banks30
We have developed an alternative approach to the formation of SAMs, which allows spatial control of where the monolayer forms: electrochemically directed chemisorption from solutions of alkyl thiosulfates on gold electrodes at anodic potential.Reference Hsueh, Lee, Freund and Ferguson31, Reference Lee, Hsueh, Freund and Ferguson32 These monolayers can be formed by applying a series of square-wave potentiometric pulses to a gold electrode in a solution of the alkyl thiosulfate(s) of interest and tetra-n-butyl ammonium tetrafluoroborate as a supporting electrolyte, in tetrahydrofuran (THF). We recently reported that a range of terminal functional groups (X(CH2)nS2O3Na; X = CH3, (CF2)8CF3, CO2H, CO2CH3, CONH2) are compatible with this method, thus allowing the current study of two-component SAMs.Reference Labukas, Drake and Ferguson33
The primary objective of this study was to examine the relationship between the composition of SAMs adsorbed from mixtures of two alkyl thiosulfates and the solutions from which they were adsorbed. The alkyl-thiosulfate precursors, CH3(CH2)10S2O3Na and HO2C(CH2)10S2O3Na, were selected so that these systems could be compared with those previously reported for SAMs adsorbed from solutions of the analogous alkanethiols, CH3(CH2)10SH and HO2C(CH2)10SH. Such benchmarking of the electrochemical method can provide fundamental insight into similarities and differences in the two types of adsorption process, as well as practical information that could guide their use in technological applications.
II. EXPERIMENTAL
A. General
Tetra-n-butylammonium tetrafluoroborate (98%), ethanol (Anhydrous, JT Baker, Phillipsburg, NJ, 95%), silver nitrate (Fisher, Pittsburgh, PA, 99.8%), and sodium thiosulfate pentahydrate (Alfa Aesar, Ward Hill, MA, 99%) were used as received. Acetonitrile (Acros, 99.8%) and tetrahydrofuran (THF, Mallinckrodt, Phillipsburg, NJ, 99%) were purified and dried using a Pure Solv system (Innovative Technology, Inc., Newburyport, MA). Water was purified with a Purelab Prima system (Elga, Woodridge, IL) to a resistivity of ~0.3 MΩ cm. Hydrogen peroxide (30%) and sulfuric acid (95%), were used as received from EMD (Gibbstown, NJ). 11-Bromoundecanoic acid (Aldrich, St. Louis, MO, 95%) and 1-bromoundecane (Aldrich, 99%) were used without further purification. Hexadecane (99%, Aldrich) was passed through activated alumina twice before use in contact-angle measurements.
1H NMR spectra were collected with a Bruker 500 MHz spectrometer (Billerica, MA) using methanol d-4 (Cambridge Isotope Laboratories, Inc., Andover, MA, 99.8%) as the solvent. Spectra were referenced to residual methyl protons of the solvent at 3.30 ppm and are reported in units of δ ppm. Monolayer thicknesses on gold were determined with a variable-angle spectroscopic ellipsometer (WVASE32, J.A. Woollam, Lincoln, NE), using a single-overlayer model and the optical constants for hexadecane (measured independently) over the range of 300 to 850 nm. Measurements were made at 60° and 70° angles of incidence. An Asylum Research (Santa Barbara, CA) MFP3D atomic force microscope was used to collect height and phase-change data in tapping mode.
B. Preparation of gold substrates
Approximately 50 Å of titanium (as an adhesion promoter) and then ~2000 Å of gold were deposited on precut (~1 × 2 cm), piranha-cleaned glass microscope slides at ~3 Å/s by electron-beam evaporation (Eddy Evaporator, Apple Valley, CA). Caution: Piranha solution, a 4:1 (v/v) mixture of concentrated H2SO4 and 30% H2O2, reacts violently with organic material and should be handled carefully. Gold substrates used for the ellipsometric measurements were recycled by soaking in piranha solution for 30 min to remove previously adsorbed SAMs, rinsing with DI water, drying in a stream of nitrogen, soaking in ethanol for 30 min to remove any surface oxides, and then again rinsing with DI water and drying in a stream of nitrogen.Reference Sun and Gardella34 A monolayer formed electrochemically from hexadecyl thiosulfate on this recycled gold had contact angles and thicknesses identical to those measured for an analogous SAM on non-recycled gold.
C. Synthesis of sodium alkyl thiosulfates
The synthesis and handling of the carboxylic acid-terminated alkyl thiosulfate, HO2C(CH2)10S2O3Na, was described previously.Reference Labukas, Drake and Ferguson33 The methyl-terminated alkyl thiosulfate, CH3(CH2)10S2O3Na, was synthesized according to the following procedure: sodium thiosulfate pentahydrate (2.48 g, 10.0 mmol) was dissolved in 40 mL of water and added to a solution of 1-bromoundecane (2.02 g, 8.58 mmol) in 40 mL of ethanol. The mixture was refluxed until homogeneous (~20 h), cooled to room temperature, and vacuum filtered to remove the white solid that had precipitated. Additional product was collected from the filtrate after removing some of the solvent by rotary evaporation and subsequently cooling in an ice bath. The crystalline product was combined, recrystallized twice from ethanol, and stored in a refrigerator. The isolated product yield was 78%. 1H NMR: CH 3(CH2)10SSO3Na, 0.89 (t, 3H); CH3(CH 2)8CH2CH2SSO3Na, 1.28–1.41 (m, 16H); CH3(CH2)8CH 2CH2SSO3Na, 1.74 (m, 2H); CH3(CH2)8CH2CH 2SSO3Na, 3.05 (t, 2H).
D. Electrosynthesis of SAMs
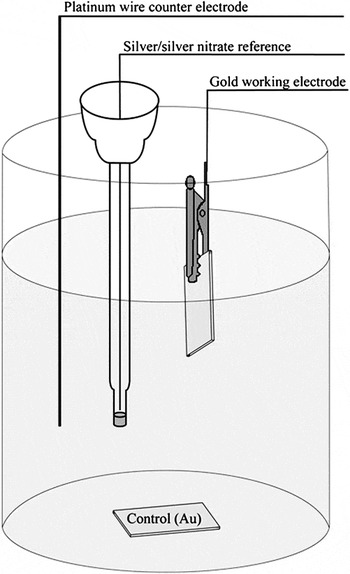
The electrosynthesis of SAMs followed our previously reported method,Reference Labukas, Drake and Ferguson33 with minor modifications, using a Princeton Applied Research (Oak Ridge, TN) VersaSTAT 3 potentiostat. We used a standard three-electrode configuration, with a gold substrate as the working electrode (~1 cm2 immersed in solution), a platinum wire (1 × 30 mm) as the counter electrode, and a glass tube fitted with a vycor frit containing Ag/AgNO3 (3 mM) in acetonitrile as the reference electrode (Fig. 1). Monolayers were formed using 40 square-wave voltammetric pulses, from −0.9 to 1.1 V for 5 s at each potential, in a solution containing a total alkyl-thiosulfate concentration of 1 mM and a Bu4NBF4 concentration of 100 mM in THF. Samples were removed from the cell, rinsed immediately with THF, ethanol, and water, and then dried in a stream of N2 prior to analysis.
The three-electrode cell comprised a gold-coated glass slide as the working electrode, a platinum wire as the counter electrode, and a silver/silver nitrate reference electrode. A separate gold electrode was placed in the bottom of the electrochemical cell as a control to check for spontaneous (nonelectrochemical) adsorption.

E. Surface analysis of pure and two-component SAMs
Analysis of the composition of the pure monolayers using x-ray photoelectron spectroscopy (XPS) was described in a recent report.Reference Labukas, Drake and Ferguson33 The mixed monolayers were analyzed in the same way. High-resolution spectra were collected with a Scienta-300 spectrometer in the Au 4f 7/2 region using two scans, the C 1s region using two scans, and the O 1s region using six scans. The pass energy was 75 eV for gold and 300 eV for carbon and oxygen. All data were collected with a step energy of 0.05 eV and analyzed at a 20° take-off angle between the sample surface and the path to the analyzer. Contact angles were measured with a Rame–Hart (Netcong, NJ) NRL model 100 goniometer. For advancing angles, a drop was placed on the surface with a microliter syringe, advanced by addition of a small amount of probe liquid, and measured when the edge of the drop had stopped moving. Receding contact angles were measured analogously after removing enough liquid from the drop to cause its edge to recede.Reference Labukas, Drake and Ferguson33
III. RESULTS AND DISCUSSION
Several solutions were prepared containing an overall concentration of alkyl thiosulfate of 1 mM in THF. One solution contained pure CH3(CH2)10S2O3Na, one contained pure HO2C(CH2)10S2O3Na, and others contained varying mole fractions of the two. (In this context, the term “mole fraction” refers only to the two alkyl thiosulfates and does not include the supporting electrolyte (Bu4NBF4) or the solvent (THF). Hence,  refers to the mole fraction of the methyl-terminated component in the solute or on the surface, and
 refers to the mole fraction of the carboxylic acid-terminated component in the solute or on the surface. These precursors were convenient choices because they are easily synthesized, form SAMs without complicating side reactions, and the composition of the resulting mixed SAMs can be compared with data reported for monolayers adsorbed from the corresponding alkanethiols.Reference Bain, Evall and Whitesides3 Monolayers prepared electrochemically from the solution containing only CH3(CH2)10S2O3Na or HO2C(CH2)10S2O3Na were characterized using x-ray photoelectron spectroscopy (XPS) and wettability by water and by hexadecane. In both cases, these data were consistent with those published previously.Reference Labukas, Drake and Ferguson33 A survey XPS spectrum of the acid-terminated SAM, for example, revealed the presence of only gold, carbon, oxygen, and sulfur.
High-resolution XPS in the carbon 1s region of the methyl-terminated SAM revealed a single peak, with a binding energy of 284.5 eV and full-width at half maximum (FWHM) of 1.16 eV. An analogous spectrum of the carboxylic acid-terminated SAM contained three peaks: 289.1 eV (FWHM, 1.90 eV), carboxyl; 286.4 eV (FWHM, 1.90 eV), α-methylene; and 284.5 eV (FWHM, 1.47 eV), remaining alkyl carbon atoms. A high-resolution spectrum in the oxygen 1s region for this sample revealed a broad unresolved peak centered at 532.3 eV. Oxygen 1s photoemission was not observed in the high-resolution spectrum of the SAM adsorbed from a solution containing only CH3(CH2)10S2O3Na, consistent with cleavage of the RS–SO3 bond in the precursor and formation of a gold–thiolate (RS–Au) linkage to the surface. The advancing contact angles of water on these SAMs were 103° (CH3) and 54° (CO2H), and those of hexadecane were 31° and <10°, respectively.
Two-component monolayers were formed electrochemically in the same way from solutions containing mixtures of CH3(CH2)10S2O3Na and HO2C(CH2)10S2O3Na. In all cases, the SAMs were formed within 7 min, and an electrically isolated control electrode exposed to each solution during the electrosynthesis remained free of an adsorbed SAM, as judged by the lack of a finite contact angle of hexadecane. The results for the control slides are valid for mole fractions of the methyl component ( ) greater then 0.6, as SAMs of these compositions would be expected to have a finite contact angle of hexadecane (vide infra).
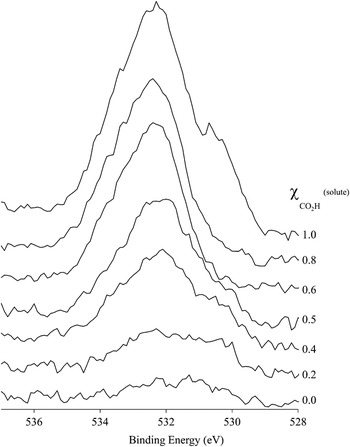
To relate the composition of the SAMs to that of the solutions, we determined the mole fraction of CO2H-terminated adsorbates within the SAMs by XPS. The mole fraction of this component on the surface was initially estimated by measuring the integrated O 1s photoemission and normalizing it to that measured for the pure carboxylic acid-terminated surface.Reference Bain, Evall and Whitesides3 This analysis, however, assumes that all of the SAMs have the same surface (or areal) density and that if the oxygen photoemission is attenuated, it is so equally for all of the oxygen-containing SAMs. Neither of these conditions is necessarily met for end groups of such different polarity. For example, differences in areal density could arise because of intermolecular (dipole-dipole, hydrogen bonding) interactions between neighboring carboxylic-acid groups, and differences in attenuation could result from varying propensities of the SAMs to adsorb contaminants from the atmosphere. We have therefore used the ratio of O 1s/C 1s integrated photoemission, again normalized to that for the SAM prepared from a solution containing pure HO2C(CH2)10S2O3Na, to estimate the mole fraction of the components on the surface. This approach has the advantage of eliminating possible errors due to changes in areal density. (The issue of differential contamination is more difficult to address, as the composition of adventitious contaminants is usually not known.) Figure 2 shows the growth in O 1s photoemission, corrected by a ratio against the total area under the C 1s peak(s) for each sample.
High-resolution x-ray photoelectron spectra in the O1s region for SAMs derived electrochemically from solutions containing mixtures of HO2C(CH2)10S2O3Na and CH3(CH2)10S2O3Na. To show the variation in the ratio of O 1s/C 1s photoemission, each spectrum was divided by the total C 1s intensity measured for that SAM.

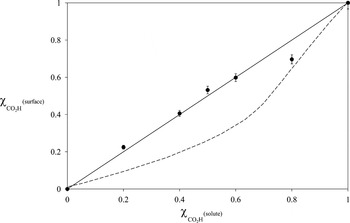
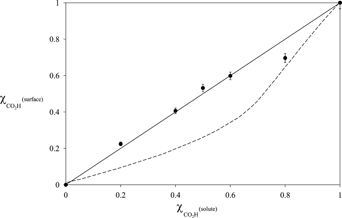
As shown in Fig. 3, the mole fraction of adsorbates in each SAM is approximately the same as the mole fraction of precursors in the corresponding solution. This behavior contrasts with that reported for analogous SAMs adsorbed from mixtures of alkanethiols in ethanol onto gold (Fig. 3, dashed line), for which there is a thermodynamic preference for the methyl component on the surface.Reference Bain, Evall and Whitesides3 The correspondence of the surface and solution mole fractions in the thiosulfate system is consistent with kinetic control of monolayer formation, with surface composition simply reflecting the diffusion of precursors to the electrode surface at similar rates and without subsequent equilibration of the monolayer with the solution.
Mole fraction of CO2H groups on the surface, measured by the normalized O 1s/C 1s photoemission, versus the mole fraction of HO2C(CH2)10S2O3Na in the solution from which the SAM was adsorbed. The solid line through the data is the theoretical line of slope unity, and the dashed line shows data reported for SAMs adsorbed from analogous mixtures of the alkanethiols, CH3(CH2)10SH and HO2C(CH2)10SH.3 The error bars reflect the standard deviation, assuming the error in each measured intensity I is  .

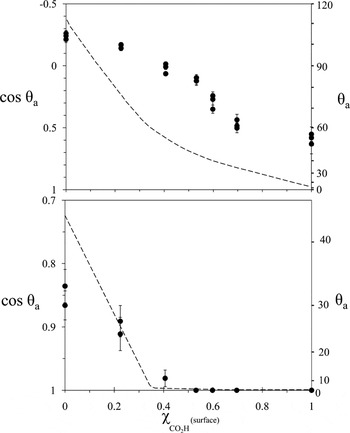
As expected, the advancing contact angles of both water and hexadecane on these monolayers decreased with increasing amounts of the carboxylic acid-terminated component in the SAMs. The hysteresis in the contact angles (θa − θr) of the pure acid-terminated SAM was 32°. The hysteresis in the contact angles of water on both the purely methyl-terminated SAM and the two-component SAMs, however, was ~15°, indicating that the composite surfaces are not segregated into macroscopic domains.Reference Bain, Evall and Whitesides3, Reference Neumann and Good35 Using atomic force microscopy, we also found no evidence of such domains in a SAM derived from an equimolar solution of HO2C(CH2)10S2O3Na and CH3(CH2)10S2O3Na. (These results do not, however, rule out patterning at the nanometer scale of length; for example, see Ref. 27. Tapping-mode AFM height and phase images are available as Supplementary Material.) These results are consistent with those reported for analogous SAMs prepared from alkanethiols and are also consistent with kinetically controlled adsorption from homogeneous solution. Unlike the SAMs adsorbed from mixtures of alkanethiols, however, which displayed a distinctly nonlinear relationship between the cos θa (water) and the  (surface), the wettability of our SAMs by water more closely followed the linear behavior predicted by Cassie’s equation, (Fig. 4, top).Reference Cassie36 The inverted sigmoidal appearance may reflect a greater sensitivity of the wettability to the slightly lower packing density of these SAMs at the two extremes of
 (surface): As a result of the partial exposure of underlying methylene groups, the pure CH3-terminated surface is not as hydrophobic, and the pure CO2H-terminated surface is not as hydrophilic, as the tightly packed SAMs prepared from alkanethiols.Reference Labukas, Drake and Ferguson33 The lower packing density, and associated greater conformational flexibility, may allow greater dipole–dipole and/or hydrogen-bonding interactions between CO2H groups within monolayers containing high mole fractions of CH3 groups—hence any differences in hydrophilicity as a function of
 (surface) may be reduced.Reference Bain, Evall and Whitesides3 When hexadecane was used as the probe liquid, the behavior of our SAMs was similar to that reported for alkanethiols, but showed lower oleophobicity on the pure CH3-terminated surface (Fig. 4, bottom), again consistent with exposure of underlying methylene groups. The ellipsometric thicknesses of the SAMs (3–5 Å) were also consistent with a lower packing density and were within 2 Å of each other across the range of mole fraction.Reference Labukas, Drake and Ferguson33
Advancing contact angles of water (top) and hexadecane (bottom) plotted as a function of surface composition measured by XPS. The error bars represent one standard deviation calculated from the six measurements averaged for each sample. In addition, multiple points at each mole fraction show sample-to-sample variation. The dashed line shows data reported for SAMs adsorbed from analogous mixtures of the alkanethiols, CH3(CH2)10SH and HO2C(CH2)10SH.3

IV. CONCLUSIONS
Self-assembled monolayers on gold were formed electrochemically from solutions containing two different alkyl thiosulfates, CH3(CH2)10S2O3Na and HO2C(CH2)10S2O3Na. The surface composition of the resulting SAMs, determined by XPS, reflected the composition of the solutions from which they were prepared. This result is different from that reported for analogous SAMs adsorbed from mixtures of alkanethiols and indicates greater kinetic control of the composition in the present case. The wettability of these surfaces by water also differed from the behavior reported for analogous monolayers adsorbed from thiols, with our SAMs showing a more linear dependence on the mole fraction of CO2H groups on the surface. This electrochemical approach allows the directed self-assembly of multicomponent SAMs with a convenient and high degree of control of surface composition. These results should prove useful for applications requiring the preparation of complex surface assemblies requiring control of both spatial placement and composition of monolayer films.
ACKNOWLEDGMENTS
We gratefully acknowledge the National Science Foundation for support of this research (CHE-0749777) and for funding to purchase the spectroscopic ellipsometer (CHE-0923370). We also thank Dr. Al Miller for assistance with the acquisition of the XPS data.