I. INTRODUCTION
Locally Er3+-doped LiNbO3 (Er:LN) is a promising substrate material for integrated optics as it combines Er3+ laser property with excellent electrooptic, acoustooptic, and nonlinear optical properties of LiNbO3 (LN). Over the past years, a family of Ti:Er:LN waveguide lasers (amplifiers) and integrated devices have been reported.Reference Brinkmann, Sohler and Suche1−Reference Schreiber, Hofmann, Grundkotter, Lee, Suche, Quiring, Ricken and Sohler5 Another potential application of LN crystal is utilizing its photorefractive effect and the two-color recording technique to realize holographic storage.Reference Hesselink, Orlov, Liu, Akella, Lande and Neurgaonkar6–Reference Buse9 To explore the application possibility of Er:LN as the holographic storage medium, two-color holographic recording, linear, and nonlinear optical absorption characteristics in a thermally reduced Er:LN have been studied in the past years.Reference Tomita, Hoshi and Sunarno10–Reference Zhang, Zhang, Wu and Pun12 Here, we report an interesting observation that intense broad small polaron, bipolaron, F-center, and Q-polaron defect absorption bands centered around 1.7, 2.5, 3.1, and 3.7 eV take place in Er3+-diffused layer near MgO (5 mol%)-doped LN crystal surface. The layer was formed by in-diffusion of Er metal under Li-poor atmosphere. These bands can be controlled by the diffusion parameters and further oxidation treatment.
II. EXPERIMENTAL DESCRIPTION
Three 0.47 ± 0.01 mm thick Z-cut homogeneously 5 mol% (in growth melt) MgO-doped LN plates, purchased from Del Mar Photonics Inc. (San Diego, CA), were used as the starting materials. At first, pure Er metal (99.99%) film with a thickness of 44 ± 2, 50 ± 2, and 60 ± 2 nm was locally coated onto a part of one surface of each plate. Subsequently, these plates locally coated with Er films, named Sample 1, 2, and 3 in order, were annealed at different temperatures of 1060, 1100, and 1130 °C, respectively, in a Li-poor atmosphere created by a closed Nb-rich two-phase [LiNbO3 (32 mol%) + Li3NbO4 (68 mol%)] crucible, i.e., the Li-poor vapor transport equilibration (VTE). The two-phase crucible was prepared by sintering homogeneous Nb-rich mixture of Li2CO3 and Nb2O5 powder, which has the same purity of 99.99%. The molar ratio was 32 mol% (Li2CO3):68 mol% (Nb2O5). The mixture was pressurized and molded into a crucible model of 6 cm in inner diameter and 4 cm in height. A precalcination at 1000 °C for 10 h and an additional calcination at 1100 °C for 1 h produced a Nb-rich two-phase crucible. The solid phase reaction involved is 32 mol% Li2CO3 + 68 mol% Nb2O5 = 32 mol% CO2 + 28 mol% LiNbO3 + 36 mol% LiNb3O8. The detailed Li-poor VTE procedure is described as follows. At first, the plate to be treated was wrapped with Pt wires and placed on a Pt foil, which was placed in the crucible before the crystal to be treated. Then, the crucible was sealed by a lid, made of the same Nb-rich two-phase powder, and heated up to a target temperature and dwelled for a scheduled duration. Due to the Li concentration gradient inside and outside the crystal, the Li ions inside the crystal diffused away from the crystal surface at the elevated temperature and the crystal evaporated the Li2O gas, which sunk in the two-phase powder due to the solid phase reaction Li2O
 + LiNb3O8 = 3LiNbO3. As a result, the crystal became Li deficient more and more due to the continuous Li2O evaporation. The VTE duration was same for all the three samples, 90 h. Table I brings together the preparation parameters of all the three samples studied.
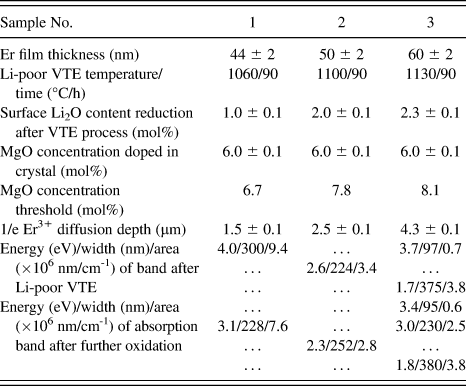
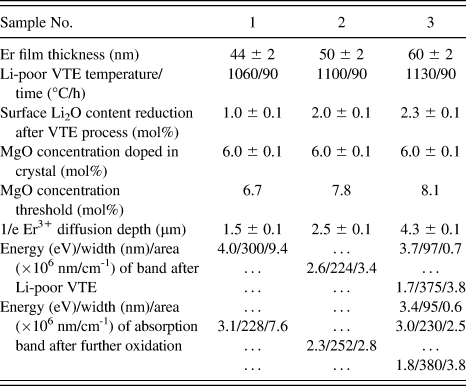
A summary of VTE condition, surface Li2O content reduction, MgO concentration threshold, 1/e Er3+ diffusion depth, and energy, width, and area of defect absorption band after VTE and further oxidation.
After the VTE process, the linearly optical absorption characteristics of the three samples were studied. The absorption spectra were recorded at room temperature using a Shimadzu UV-3600 spectrophotometer (Shimadzu Corp., Kyoto, Japan). The scanning wave length range is 300–900 nm. The scanning step and speed were fixed at 0.2 nm and 120 nm/min, respectively.
III. RESULTS AND DISCUSSION
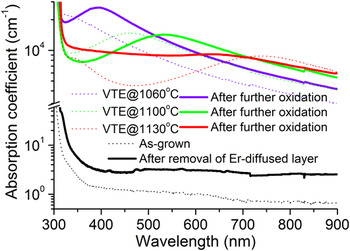
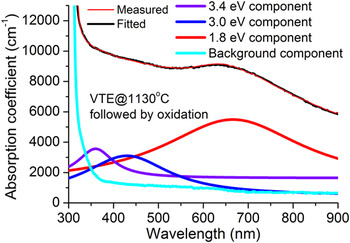
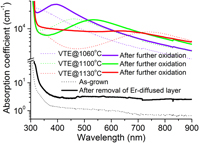
Figure 1 shows the measured absorption spectra, in a semilogarithmic scale, of the studied three samples in the wave length range of 300–900 nm. The dotted violet, green, and red curves represent the respective spectrum of the Samples 1, 2, and 3 recorded after the VTE process. The continuous violet, green, and red plots denote the spectra recorded after the further oxidation treatment at 1100 °C for 2 h. For comparison purposes, the spectrum of the corresponding as-grown crystal is also shown (the dotted black plot). One can see that absorption in all the samples studied is on the order of magnitude of 104/cm-1 and is far stronger than that in the as-grown crystal whether the sample is in the as-VTE-treated or in the oxidized state. One or two intense broad component absorption bands could be resolved. Lorentzian single-peak or multipeak fitting has been applied to these spectra. Table I summarizes the fitting results that include the peaking absorption energy, width, and area of the component bands after the VTE process and the further oxidation treatment. For the as-VTE-treated Samples 1 and 2, only one component absorption band, peaking at 4.0 and 2.6 eV, respectively, dominates in their respective spectrum. For the as-VTE-treated Sample 3, two component bands centered at 3.7 and 1.7 eV dominate in the spectrum. After the further oxidation treatment, the number of the component absorption bands retains still one for Samples 1 and 2 but adds to three for Sample 3. The peaking position is located at 3.1 and 2.3 eV for Samples 1 and 2, respectively, and 3.4, 3.0, and 1.8 eV for Sample 3. Figure 2 shows the Lorentzian decomposition of the spectrum (red thin solid line, taken from Fig. 1) of Sample 3 in the oxidized state. The thick violet, blue, and red curves represent the decomposed Lorentzian components and the cyan curve represents the background absorption. The black curve, which represents the fitting result, is drawn to show how well the fit to the measured plot is. In words, the oxidation treatment induces the conversion of the peaking absorption from 4.0 to 3.1 eV for Sample 1, from 2.6 to 2.3 eV for Sample 2, and a new absorption component at 3.0 eV for Sample 3. On the other hand, the oxidation treatment does not change much the bandwidth and area.
Absorption spectra of Z-cut MgO (5 mol% in melt):LN plates undergone Li-poor VTE treatments at 1060 °C (violet dotted curve), 1100 °C (green dotted), and 1130 °C (red dotted). The violet, green, and red solid lines represent the corresponding spectra recorded after further oxidation treatment. The black solid line denotes the spectrum recorded from Sample 2 after removal of Er-diffused layer. For comparison, the spectrum of as-grown crystal is also shown (black dotted curve). (color online)

Decomposition of spectrum (red thin solid line, taken from Fig. 1) recorded from Sample 3 after the oxidation treatment. The thick violet, blue, and red curves represent the decomposed Lorentzian components and the cyan curve represents the background absorption. The black curve overlapped on the measured plot represents the fitted result. (color online)

It is essential to distinguish the intense absorption bands that take place in the Er3+-diffused layer only or in the whole plate. Earlier study has shown that these bands are absent in Li-deficient off-congruent MgO (5 mol%):LN crystals (without Er3+ doping) prepared by similar Li-poor VTE method and using completely same MgO:LN plates as the initial materials.Reference Zhang, Hua, Liu and Pun13 It is thus presumed that the intense absorption should take place in the Er3+-diffused layer. To verify this speculation, we selected the Sample 2 and removed the Er3+-diffused layer by doing optical polish to the Er3+-doped surface. The thickness reduction due to the surface polish is about 80 μm. Secondary ion mass spectrometry study, which will be published elsewhere, shows that the diffused Er3+ ions have a penetration depth of ∼10 μm and a 1/e depth of 2.5 ± 0.1 μm. It is thus confirmed that the Er3+-diffused layer has been removed after the polish procedure. The optical absorption measurement was repeated after the polishing process. The result is shown by the solid line in Fig. 1. One can see that the intense component absorption band is no longer resolved after the removal of Er3+-diffused layer. The background absorption of the polished plate is reasonably slightly higher than that of the as-grown plate and is compatible with the result reported in Ref. Reference Zhang, Hua, Liu and Pun13. Thus, the intense band takes place only in the Er3+-diffused shallow layer. In Fig. 1, all the spectra concerning with the Samples 1–3 are determined by considering the 1/e Er3+ diffusion depths, which are given in Table I, as the effective optical absorption thickness.
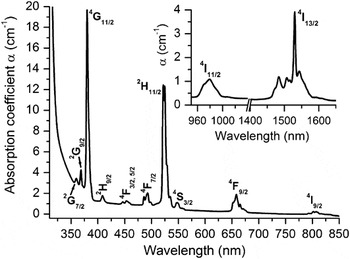
The intense component absorption bands originate from neither the Er3+ ion absorption nor the thermal reduction effect, which usually accompanies a VTE procedure. As an example, in Fig. 3, we show a typical spectrum of Er3+ absorption in a Z-cut 0.5 mol% homogeneously Er2O3-doped congruent LN crystal in the wave length range of 300–850 nm. The inset shows the two absorption bands in the wave length range of 950–1650 nm. The observed bands correspond to the Er3+ electronic transitions from the ground state 4I15/2 to the upper manifolds 2G7/2 (360 nm), 2G9/2 (370 nm), 4G11/2 (380 nm), 2H9/2 (410 nm), 4F3/2, 5/2 (450 nm), 4F7/2 (490 nm), 2H11/2 (520 nm), 4S3/2 (550 nm), 4F9/2 (650 nm), 4I9/2 (800 nm), 4I11/2 (980 nm), and 4I13/2 (1530 nm). Note that this homogeneously doped crystal has an Er3+ concentration (0.93 ± 0.06 mol% in crystal) comparable to the surface concentration of the three diffusion-doped crystals really studied here, about 1.0 mol%. It is evident that the Er3+ absorptions are much weaker and narrower in comparison with the bands observed in Fig. 1. Moreover, for a diffusion-doped crystal, like the ones studied here, the Er3+ ions are doped near the crystal surface. The measurement on Er3+ absorption is quite difficult, even is not feasible for the present measurement method that the propagation direction of the incident light is perpendicular to the crystal surface. This is because the Er-doped layer is too thin (only ∼10 μm). When the probe light is incident perpendicular to the Er3+-diffused surface, fewer Er3+ ions participate in absorption upon the light and the Er3+ absorption band is indiscernible in this case. To increase the number of Er3+ ions taking part in the absorption upon the light and hence make the absorption band discernible, a strip waveguide must be fabricated in the Er3+-diffused layer at first. The Er3+ absorption spectrum is then measured through the channel waveguide. But the experiment becomes pretty sophisticated, even is not feasible. For the three samples studied here, it is impossible to fabricate a strip waveguide on the diffused surface because the surface is rather rough due to the unexhausted Er3+ diffusion reservoir. Nevertheless, it is well known that the absorption characteristics of the Er3+ ions incorporated via the diffusion method do not have distinct differences from those of Er3+ ions incorporated via the direct growth method. Although in a highly doped crystal, a certain number of the Er3+ ions are present in the form of clustered sites, the presence of the clustered Er3+ ions could not broaden significantly the absorption bands. Thus, the intense absorption bands in Fig. 1 have nothing to do with the absorption of Er3+ ion whether it is present in the single state or in the clustered state.
Absorption spectrum of the electronic transitions from the ground state 4I15/2 to the upper manifolds 2G7/2 (360 nm), 2G9/2 (370 nm), 4G11/2 (380 nm), 2H9/2 (410 nm), 4F3/2, 5/2 (450 nm), 4F7/2 (490 nm), 2H11/2 (520 nm), 4S3/2 (550 nm), 4F9/2 (650 nm), 4I9/2 (800 nm), 4I11/2 (980 nm), and 4I13/2 (1530 nm) of Er3+ ion in a Z-cut LN crystal grown from a congruent melt containing homogeneous Er2O3 of 0.5 mol%.

In addition, it is well known that the oxidation treatment usually weakens the thermal reduction effect. Speaking specifically, the absorption in the samples studied should reduce after the further oxidation process. This is obviously not the case as shown in Fig. 1. The oxidation induces considerable increase instead of decrease of absorption (area). It is thus unreasonable to assign the intense bands to the VTE-induced reduction effect.
We attribute the intense component bands to the absorptions of defects generated in the Er3+-diffused layer due to Li2O loss and simultaneous Er3+ in-diffusion. As the Li-poor VTE proceeds, the crystal evaporates the Li2O. The Li2O evaporation takes place in the Er3+-diffused layer also. Accompanying the simultaneous in-diffusion of Er3+ ions, a large amount of intrinsic defects, like the antisite (NbLi)4+ (Nb5+ on Li+ site) and the Li vacancy required by charge equilibrium, are generated in the Er3+-diffused layer. It is possible that these intrinsic defects are present in several types. Over the past 30 years, much experimental and theoretical work on the creation and assignment of defects in the LN crystal has been done.Reference Arizmendi, Cabrera and Agullo-Lopez14−Reference Donnerberg, Tomlinson, Catlow and Schirmer27 These works concentrated on the x-ray or ion irradiation, thermal reduction, crystal composition, and Li-rich VTE effects on the type and concentration of the defects. The results show that a broad absorption band consisted of three components centered at 1.6, 2.5, and 3.2 eV is always observed whether the LN was subjected to the x-ray irradiation, high-energy electron irradiation, thermal reduction, or Li-rich VTE treatment. The thermal reduction may also induce a component band centered at 3.7 eV.Reference Akhmadullin, Golenishchev-Kutuzov and Migachev15 It is commonly accepted that the 1.6 eV band is concerned with the small polarons (NbLi4+), which are formed by electrons trapped at the intrinsic NbLi5+ defects; the 2.5 eV band is associated with the bipolarons (NbLi4+ NbNb4+), which are formed by electrons trapped at adjacent NbLi5+ and NbNb5+ sites and are the stable polaronic entity at room temperature; the 3.2 eV band is related to the F-centers and the 3.7 eV is concerned with the Q-polarons, which are the interaction of two bipolarons. The presently observed bands, centered at 1.7, 2.5, 3.1, and 3.7 eV, match well with these defect absorption bands. Under different VTE temperatures, these defects present in different types and concentrations and hence have different absorption intensities. Of course, the oxidation treatment can also change the defect type and concentration and hence modify the spectral shape. Under the lower VTE temperature of 1060 °C, the defects present predominantly in the form of the Q-polarons. After further oxidation treatment, the F-centers become dominant. As the VTE temperature was increased to 1100 °C, the defects are mainly present in the form of bipolarons. This is still the case after the further oxidation treatment. Under the higher VTE temperature of 1130 °C, the defects present in the Q-polarons and small polarons. After the further oxidation treatment, the Q-polarons and small polarons are retained still. Meanwhile, an additional type of defects, the F-center, was generated.
It can be seen from the above results and discussion that the bands can be controlled and tailored by the VTE temperature and the further oxidation treatment. Such material may find its nonlinear optics application as a medium for holographic data storage based upon two-color holography.Reference Hesselink, Orlov, Liu, Akella, Lande and Neurgaonkar6–Reference Buse9 The two-color holography requires that the material can provide two photorefractive centers (two-center model), i.e., so-called shallow center and deep center (relative to the conduction band). For the pure LN, the shallow centers or traps are the small polarons. The deep centers or traps are the bipolarons. In two-color holography technique, charge carriers are generated by two-step photo-induced ionization from deep traps with the help of a visible light beam (named gating or pump beam) whose wave length is usually shorter than that of photorefractively insensitive writing beams. When the LN crystal is exposed to a visible light, the bipolarons absorb the visible photons and electrons are excited from the deep traps. (To increase the bipolaron concentration, the crystal is often thermally reduced.). These photodissociated electrons are retrapped at the intrinsic NbLi5+ defects following charge transport, forming small polarons. The photon energy of infrared recording light is sufficient to release the electrons from the small polarons to the conduction band. After transport in the conduction band, these electrons are eventually retrapped by the deep traps elsewhere (dark area). Accordingly, a spatial charge profile and hence a spatially modulated electric field are formed in the light interference area. A hologram is then recorded on the basis of the electrooptic effect of the crystal. The hologram is actually established on the basis of the light-induced refractive index change via the electrooptic effect, i.e., the photorefractive effect. Without gating light, no small polaron is formed in the crystal. Thus, during the reading, the infrared light by itself is insufficient to generate free electrons and erases the written holograms. That is main reason why the two-color holography is of the merit of nonvolatility.
Regarding the materials studied here, there is a point to be clarified. While the 5 mol% MgO concentration doped in the growth melt (or 6 mol% in crystal) completely cancels photorefractive effect, the two-color holography utilizes this effect. As we know, the threshold MgO concentration of photorefractive effect depends on the crystal composition. The Li-poor VTE induces Li2O content decrease and hence the corresponding increase of MgO concentration threshold. By utilizing the Sellmeier equation for MgO-doped LN,Reference Schlarb and Betzler28 we have evaluated the Li2O content reduction at Er3+-doped surface of the studied samples from the measured birefringence values. The results are shown in Table I. After the VTE process, the Li2O content reduction at the Er3+-doped surface is 1.0 ± 0.1, 2.0 ± 0.1, and 2.3 ± 0.1 mol% for the Samples 1, 2, and 3, respectively. These Li2O content reductions lead to the increase of MgO concentration threshold from ∼5 to 6.7, 7.8, and 8.1 mol%, respectively, which are considerably higher than the 6 mol% doped in the crystal.
Among the three samples we studied, the small polarons formed in the Sample 3 during the Li-poor VTE process and after the further oxidation treatment. This material is no longer suitable for the two-color holography application but is still valid for the traditional one-color holography, which is not of the merit of nonvolatility.Reference Buse8, Reference Buse9 On the other hand, the small polarons were not formed, while the bipolarons were generated in Sample 2 during the Li-poor VTE process and after the further oxidation treatment. This material may find its use in the two-color recording. For the Sample 1, the defects are present mainly in the form of the Q-polarons after the VTE process while being present in the form of the F-centers after the further oxidation treatment. It appears that the sample in the VTE-treated state is applicable to the two-color holography.
Finally, it should be pointed out that the band attribution given above is proposed merely on the basis of the similarity of band position. The polarons and F-centers also have other special characteristics that may be helpful for identity of the defects. These include cyclotron, electron paramagnetic resonance (EPR), and electron spin resonance (ESR). The attribution of the 1.7/2.5 eV band to the small polarons/bipolarons is convincing, and while that of the 3.1/3.7 eV band to the F-centers/Q-polarons needs to be further verified by examining the similarity of other important features such as the cyclotron, EPR, and ESR, which is intended to be the future work.
IV. CONCLUSION
In conclusion, intense broad defect absorption bands take place in Er3+-diffused layer formed near MgO (5 mol%)-doped LiNbO3 crystal surface by in-diffusion of Er metal under Li-poor atmosphere and are tentatively attributed to absorptions due to small polarons, bipolarons, F-centers, and Q-polarons. These defects are generated due to Er3+ in-diffusion and Li2O loss from the crystal. Their concentrations can be controlled and tailored by the diffusion temperature and further oxidation treatment. Such material may find its use in holographic storage based upon two-color recording.
ACKNOWLEDGMENTS
This work was supported by the National Natural Science Foundation of China under Project Nos. 50872089, 61077039, and 61107056, by the Key Program for Research on Fundamental to Application and Leading Technology, Tianjin Science and Technology Commission of China under Project No. 11JCZDJC15500, and by the Specialized Research Fund for the Doctoral Program of Higher Education of China under Project No. 20100032110052.