Introduction
Eustachian tube dysfunction is one of the most important causes of acquired pars flaccida retraction and cholesteatoma, which are multifactorial diseases. The pathogenesis of acquired attic cholesteatoma has been attributed to: Shrapnell's membrane retraction triggered by Eustachian tube dysfunction, proliferation of the basal layer of Shrapnell's membrane, squamous epithelium migration, or metaplasia of inflamed epitympanic middle-ear epithelium into keratinising squamous epithelium.Reference Sadé, Wolfson, Lunz, Berger and Sadé1,Reference Dinç, Damar, Uğur, Öz, SŞ and Bişkin2
Given its complex physiology and deeply located anatomy, the Eustachian tube continues to attract research interest. The pathophysiology of the Eustachian tube dysfunction is better understood today thanks to advances in imaging techniques, and in multi-slice helical computed tomography (CT) and endoscopy in particular.Reference Sadé, Wolfson, Lunz, Berger and Sadé1,Reference Dinç, Damar, Uğur, Öz, SŞ and Bişkin2
The development of chronic otitis can be explained by anatomical disorders of the Eustachian tube, such as Down syndrome, a craniofacial anomaly or the anatomical change process in childhood.Reference Sadé, Wolfson, Lunz, Berger and Sadé1,Reference Dinç, Damar, Uğur, Öz, SŞ and Bişkin2 However, the pathogenesis of chronic otitis and cholesteatoma that develop in a seemingly normal Eustachian tube is still not known.Reference Alper, Luntz, Takahashi, Ghadiali, Swarts and Teixeira3,Reference Habesoglu, Habesoglu, Bolukbasi, Naiboglu, Eriman and Karaman4
Many studies have investigated the relationship between chronic otitis and Eustachian tube anatomy, but only a few studies have focused on the relationship between primary attic cholesteatoma and the Eustachian tube.Reference Alper, Luntz, Takahashi, Ghadiali, Swarts and Teixeira3,Reference Habesoglu, Habesoglu, Bolukbasi, Naiboglu, Eriman and Karaman4 Hence, this study aimed to investigate the relationship between radiological dimensions of the Eustachian tube and the emergence of acquired attic cholesteatoma. Specifically, high-resolution CT scans of patients with unilateral attic cholesteatoma were compared to findings of healthy control ears.
Materials and methods
Patient selection
The study was approved by the institutional ethics committee. Patients were selected from a group of adults with attic cholesteatoma who were operated on between April 2018 and April 2020. Patients with attic cholesteatoma on one side and with a normal ear on the other side were selected for radiological comparison.
A total of 31 patients (12 females and 19 males), with a mean age of 32.9 years (range, 17–67 years) were selected for inclusion in the study. All patients had undergone complete ENT examinations. The findings of the otoscopic (pneumatic, microscopic and endoscopic) examinations were recorded. The results of all other examinations were normal and all participants had inconsequential medical histories. Diagnoses of unilateral attic cholesteatoma were confirmed by the otoscopic examinations, as well as by high-resolution CT, diffusion magnetic resonance imaging, pure tone audiological examinations, pre-operative findings and post-operative histopathological results.
Scanning protocol and radio-anatomical quantifications
All CT scans were performed using a 64-slice multi-detector CT system (Brilliance Philips, Amsterdam, Netherlands) in accordance with the ‘temporal bone high-resolution CT’ scan pre-sets (slice thickness of 0.67 mm, rotation time of 0.5 seconds, collimation of 20 × 0.625 mm, reconstruction interval of 0.67 mm, performed at 120 kV and 244 mA, with a pitch of 0.343, and a field of view of 200 mm × 200 mm). The resulting data were transferred to a radiology dedicated workstation, and initially processed by the formal picture archiving and communication system (IDS7 system, Sectra, Linköping, Sweden).
Quantifications were made using a window width of 4000 Hounsfield units (HU) and a window level of 600 HU. Eustachian tube specific measurements were performed using the Myrian imaging software package (Intrasense, Paris, France). The multiplanar reconstruction technique was used to reconstruct the 0.5 mm thickness gapless images that are parallel and perpendicular to the long Eustachian tube axis. Images were standardised for all patients. The asymmetry of the images in the craniocaudal plane, associated with patient positioning, was eliminated by adjusting the angle of the reformatted image to the point where the basal turns of both cochleae were equally viewable in axial and coronal planes.
The pharyngeal orifices of the Eustachian tube were observed in axial sections as the extension of the long Eustachian tube axis. The pharyngeal orifice of the Eustachian tube lumen was defined as the notch at the pharynx by the end of the non-osseous Eustachian tube trace. The tympanic orifice was defined as the nearest point in the Eustachian tube in front of the external auditory canal as it has appeared in the cross-sectional images.
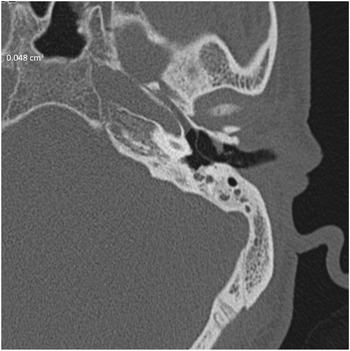
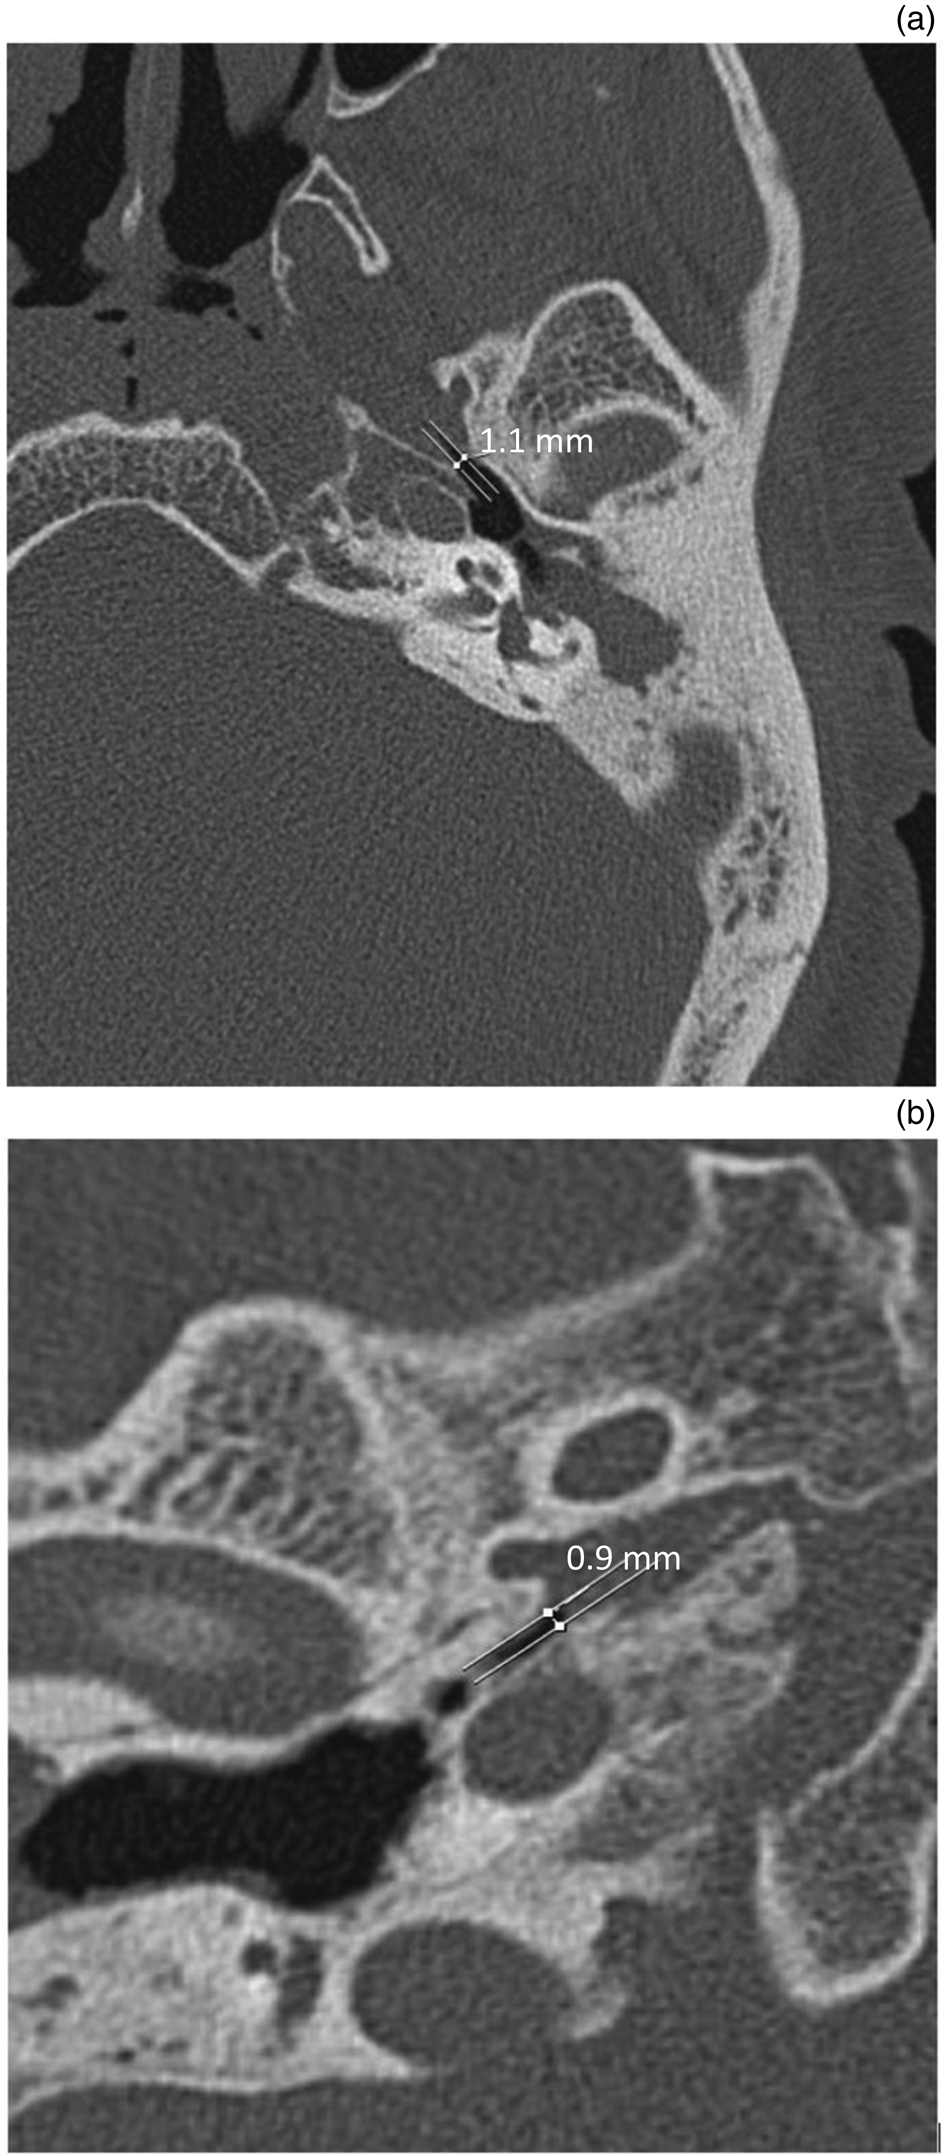
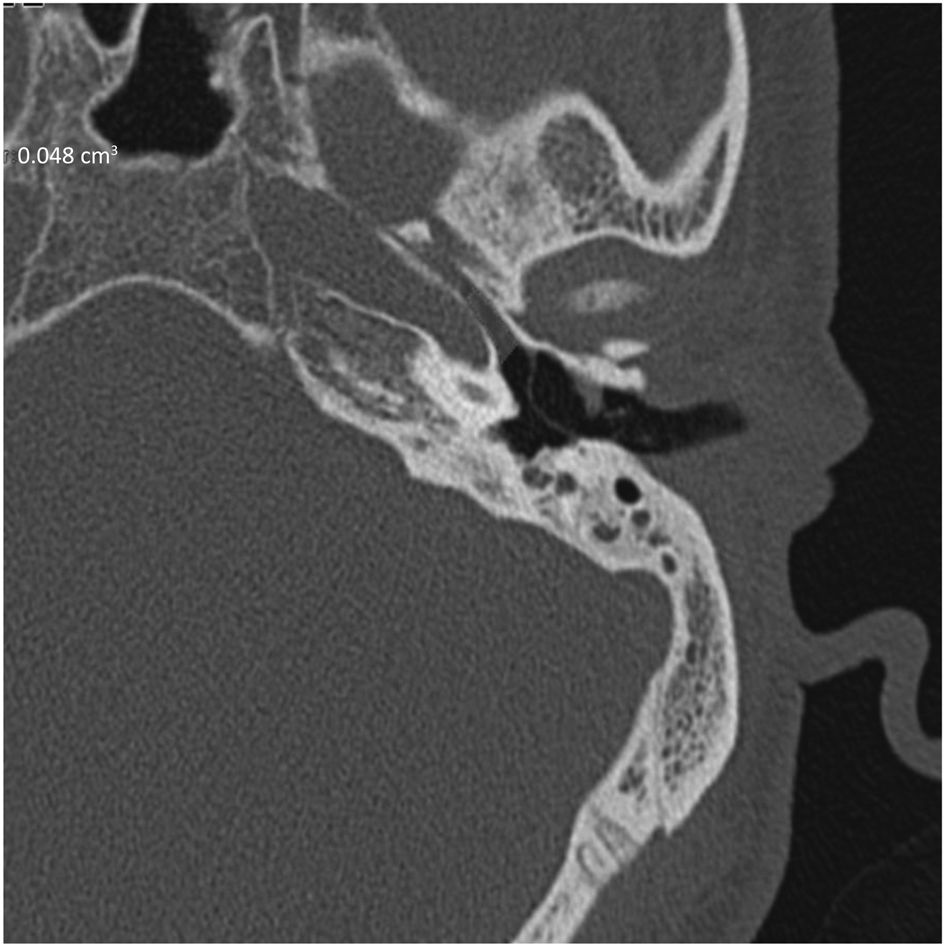
Eustachian tube length was measured based on the axial-oblique multiplanar reconstruction images. The distances between the fibrocartilaginous and bony segments and the tympanic orifice of the Eustachian tube acquired by manually located callipers were noted (Figure 1). The narrowest diameter of the Eustachian tube available at the convergence point of the fibrocartilaginous and bony components was measured automatically by manually localised callipers based on axial images (Figure 2). The volume of the bony segment of the Eustachian tube was quantified by Myrian software. The diameter and the end points of the bony Eustachian tube segment were manually typed in, and then the software calculated the volume of the bony segment of the Eustachian tube (Figure 3).
The length of the Eustachian tube bony segment was obtained from axial-oblique computed tomography images acquired by multiplanar reconstruction; the callipers were manually located at the joint of fibrocartilaginous-bony components and the tympanic orifice of the Eustachian tube.

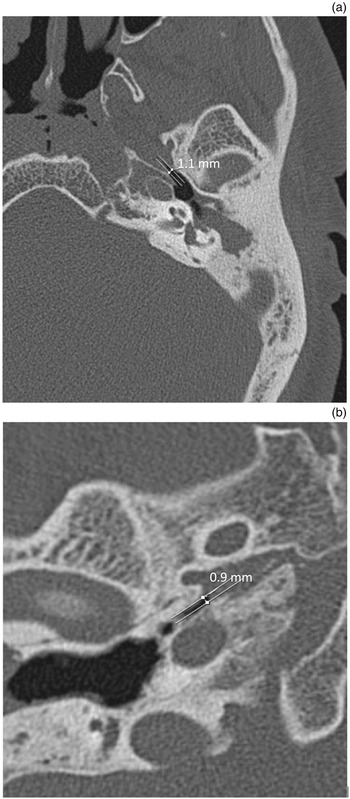
The Eustachian tube's narrowest diameter was measured manually at the level of the joint between fibrocartilaginous and bony segments. (a) The adjusted axial computed tomography images were used (the craniocaudal levels of both middle-ear structures were equalised). (b) For a precise measurement, images were magnified where necessary to ensure correct calliper positioning.
The volume of the Eustachian tube bony segment was calculated by Myrian software after manual indications of the diameter, and the beginning and end of the bony segment. The anatomical space involved, identified through volumetric calculation, was coloured by the software, and necessary corrections were made by the authors for full coverage of the structure.
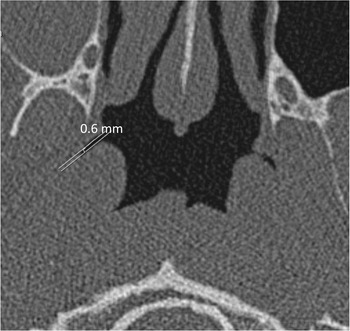
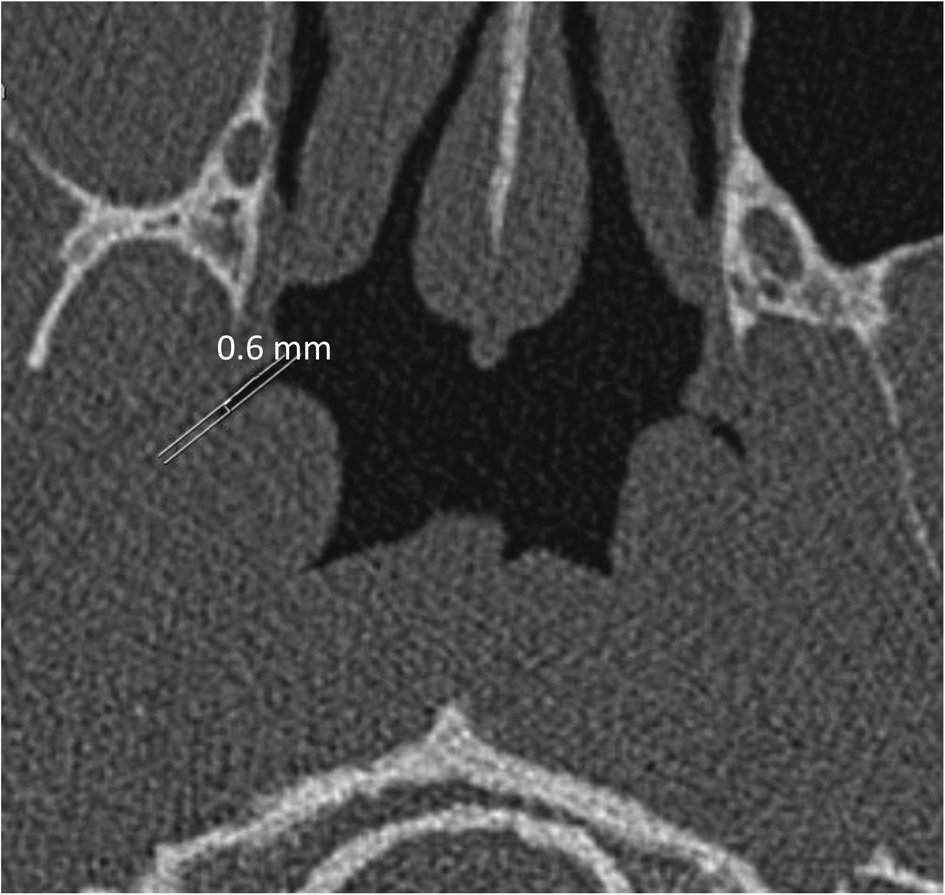
The pharyngeal orifice of the Eustachian tube was determined based on the axial CT images. The largest diameter of the orifice was measured manually using the manually located callipers. The callipers were set on the Eustachian tube walls and in the pharyngeal orifice, at the point of the maximum diameter (Figure 4).
The diameter of the Eustachian tube's pharyngeal orifice was calculated manually, the callipers were localised by the authors, and the distance between the callipers was supplied by the software. The segments with a maximum diameter near the pharyngeal orifice were captured.
The study authors were blinded to the intra-operative diagnoses, and to patients’ medical and familial histories, and could only tell the normal ears from the diseased ears on the high-resolution CT images.
Statistical analyses
Statistical analyses were conducted using SPSS for Windows software, version 21.0 (SPSS, Chicago, Illinois, USA). Categorical values were compared using the paired samples t-test. Probability (p) values of < 0.05 were accepted to indicate statistical significance.
Results
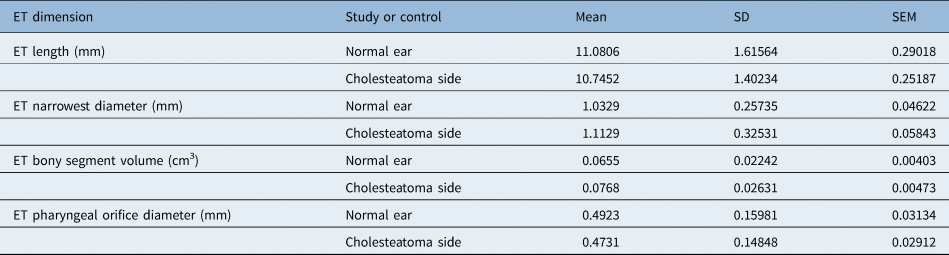
The Eustachian tube length, narrowest diameter, bony segment volume and pharyngeal orifice values, for both study and control ear groups, are listed in Table 1. Eustachian tube length ranged from 8.0 mm to 13.8 mm in the control group, and from 8.8 mm to 12.4 mm in the cholesteatomatous group. The narrowest diameter of the Eustachian tube ranged from 0.6 mm to 2.0 mm in the study group, and from 0.6 mm to 2.0 mm in the control group. The volume of the bony segment of the Eustachian tube ranged from 0.027 cm3 to 0.109 cm3 in the control group, and from 0.036 cm3 to 0.159 cm3 in the study group.
Descriptive statistics for each ET dimension*
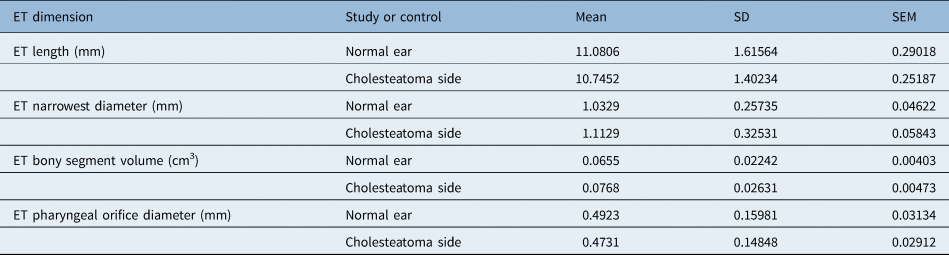
* Total patients, n = 31. ET = Eustachian tube; SD = standard deviation; SEM = standard error of the mean
Comparison of the mean Eustachian tube length, narrowest diameter, bony segment volume and pharyngeal orifice values between the study and control ear groups did not reveal any statistically significant differences (p = 0.158, p = 0.125, p = 0.064 and p = 0.526, respectively) (Table 2). However, mean Eustachian tube length was slightly longer and mean bony segment volume was bigger in males than in females (p < 0.001).
Paired samples t-test analysis of differences between study and control ears

* Significance (2-tailed). ET = Eustachian tube; SD = standard deviation; SEM = standard error of the mean; CI = confidence interval; df = degrees of freedom
Discussion
Since Duvernay first recognised the role of the Eustachian tube in 1683, the most frequently cited aetiological cause for chronic otitis and cholesteatoma has been Eustachian tube dysfunction.Reference Gülüstan, Güneş, Yıldız, Yazıcı, Abakay and İnci5 The anatomy of the osseous Eustachian tube is complex and its structure is thin.Reference Gülüstan, Güneş, Yıldız, Yazıcı, Abakay and İnci5 Despite the comprehensive studies on Eustachian tube function, the pathological phases of the Eustachian tube remain unclear. Chronic otitis media with cholesteatoma is a prevalent issue worldwide, yet the explanations given for the causes of this chronic ear condition vary widely. In the case of infants, chronic otitis with cholesteatoma typically begins with acute onset. Anatomical or physiological abnormalities of the Eustachian tube can also be a significant factor in repeated episodes of otitis media.Reference Bluestone6–Reference Hashimoto, Yanagihara, Hyodo and Sakagami8
There are a number of studies in the literature on the physical dimensions of the Eustachian tube and their relation to chronic otitis. In some of these studies, Eustachian diameter, length and volume in patients with chronic otitis and cholesteatoma were found to be significantly different to those of control subjects;Reference Gülüstan, Güneş, Yıldız, Yazıcı, Abakay and İnci5,Reference Paltura, Can, Yilmaz, Dinç, Develioğlu and Külekçi9,Reference Shim, Choi, Yoon, Kwon and Yeo10 however, in other studies, no such differences were reported.Reference Dinç, Damar, Uğur, Öz, SŞ and Bişkin2,Reference Habesoglu, Habesoglu, Bolukbasi, Naiboglu, Eriman and Karaman4,Reference Hashimoto, Yanagihara, Hyodo and Sakagami8 Gülüstan et al. found that Eustachian tube length and width were significantly different in patients with cholesteatoma, compared to control subjects.Reference Gülüstan, Güneş, Yıldız, Yazıcı, Abakay and İnci5 In addition, Dinç et al. reported shorter and flatter Eustachian tubes in the study group with cholesteatoma, including the paediatric age group.Reference Dinç, Damar, Uğur, Öz, SŞ and Bişkin2 In contrast, Hashimoto et al. found no significant differences in Eustachian tube length and width for patients with cholesteatoma compared to control subjects.Reference Hashimoto, Yanagihara, Hyodo and Sakagami8
Unlike these studies, the selected patients investigated for this study were adults with completed Eustachian tube development who had: no previous relevant medical history, attic cholesteatoma only, a similar degree of ossicular erosion to each other and with comparable disease spread. Moreover, specialist software was used to standardise the comparative radiological measurements. Once all Eustachian tube measurements were taken, the relationships between the dimensions of the osseous Eustachian tube and the development of attic cholesteatoma were investigated in comparison with control ears. Ossicle erosion and the extent of cholesteatoma spread were considered to indicate disease severity. However, no significant relationships were found between cholesteatoma severity and osseous Eustachian tube dimensions or pharyngeal orifice values, for the study group and the control group.
• In otology, surgical intervention for primary acquired cholesteatoma is still a matter of debate
• This is mainly because the pathogenesis of cholesteatoma has not yet been properly established
• The Eustachian tube physical dimensions and their relation with chronic otitis have been studied previously
• In some studies, Eustachian diameter and length were significantly different in chronic otitis with cholesteatoma cases than in controls
• The current study findings suggest that Eustachian tube bony tissue is not responsible, at least in adult cases, for attic cholesteatoma development
In otology, surgical intervention for primary acquired cholesteatoma is still a matter of debate, particularly because the pathogenesis of cholesteatoma has not yet been properly established. In several studies, Eustachian tube dysfunction and pneumatisation inhibition have been suggested as probable causes of primary acquired cholesteatoma development.Reference Lee, Hong, Kim, Park and Baek11–Reference Takahashi and Takahashi14 One research group had previously identified cholesteatoma as a multifactorial disease based on abundant surgical experience.Reference Lee, Hong, Kim, Park and Baek11,Reference Kim, Jung, Sung, Kim and Kim12,Reference Takahashi and Takahashi14 It is the authors' opinion that if air can pass through the cartilage part of the Eustachian tube, the isthmus and the bone can pass through the Eustachian tube as well. In other words, it would be the cartilage part of the Eustachian tube that is responsible for cholesteatoma development, assuming that the tubal Eustachian dysfunction is involved in cholesteatoma development. In addition to tubal Eustachian dysfunction, some activities and habits may also play a role in cholesteatoma development.Reference Takahashi and Takahashi14
The function of Eustachian tube was not investigated within this study; however, a few studies are available in the literature which indicate the importance of parameters that include: weak Eustachian tube function, a shorter Eustachian tube, decreased tensor veli palatini muscle vectors, Eustachian tube angle and tensor veli palatini muscle surface area.Reference Doyle and Swarts15–Reference Mizutari, Takihata, Kimura, Inuzuka and Shiotani17
The limited number of cases included in this study may well be considered a limitation, as it restricts the authors' ability to describe the specific pathogenesis of attic cholesteatoma. However, it is a strength of this study that objective imaging data were used to assist in comprehending the clinical practice. Nonetheless, generally speaking, large-scale trials with greater statistical intensity are needed to shed more light on the subject matter. Studies using non-invasive techniques are also required to provide more information on the functional anatomy of the cartilage part of the Eustachian tube.
In conclusion, the findings of this study indicate that the bony tissue of the Eustachian tube is not responsible, at least in adult cases, for the development of attic cholesteatoma.
Competing interests
None declared