Introduction
The existence of high levels of unmet need for family planning remains one of the strongest policy arguments in favour of expanding contraceptive services, and it has played an important role in international reproductive health programming and funding for 30 years. For example, unmet need is an indicator for the United Nations' Millennium Development Goals target to achieve universal access to reproductive health by 2015. Fulfilling unmet need remains a persistent challenge in sub-Saharan Africa. In Western and Middle Africa, the levels of unmet need have remained essentially unchanged for 20 years (Alkema et al., Reference Alkema, Kantorova, Menozzi and Biddlecom2013). More than 70% of need for modern methods of family planning in these regions is unmet (Singh & Darroch, Reference Singh and Darroch2012). Yet little is known about how unmet need has increased or decreased among specific women. This study aims to generate new data on women's shifts in and out of unmet need, contraceptive use and related states over time.
Use of, and need for, family planning are often inversely related, and the most effective programmatic interventions to reduce unmet need aim to increase contraceptive prevalence. Women's fertility preferences can be a helpful indicator, because they are a strong predictor of future childbearing (Islam & Bairagi, Reference Islam and Bairagi2003; Kodzi et al., Reference Kodzi, Johnson and Casterline2010). Furthermore, stated intentions of future contraceptive behaviour are closely linked to actual future use. Curtis & Westoff (Reference Curtis and Westoff1996) found that among Moroccan women, only previous use of contraception better predicted future use and non-use than declared intention to use. Meanwhile, about 40% of Moroccan women with unmet need did not intend to use contraception in the future (Westoff & Bankole, Reference Westoff and Bankole1998). This was confirmed in practice: 62% of these women had not adopted contraception when interviewed three years later, while 38% had in fact begun using a family planning method.
While surveys can provide information about how use of, and need for, contraception has changed in the aggregate across a population, there have been few panel studies that have tracked individual women in and out of these states. Ross et al. (Reference Ross, Wardlaw, Huber and Hong1987) applied a dual cohort and period approach to track changing patterns of sterilization across countries; this was feasible because sterilization only occurs once and provides a permanent change in contraceptive use status. Self-reported data from married women showed that while sterilization prevalence increased with age among individual cohorts of women, period rates of sterilization also increased, as more couples selected the method at an earlier point in their marriages relative to older generations and as all age-specific adoption rates also rose.
Some household surveys have collected contraceptive use histories among respondents, which allow researchers to reconstruct changes in use states among individual women over the survey reference period. For example, in 1976–77, the Malaysian Family Life Survey collected individual lifetime contraceptive use histories for almost 1200 women (Reboussin et al., Reference Reboussin, DaVanzo, Starbird, Boon Ann and Abdullah1987) and found that the increase in modern contraceptive prevalence over the prior two decades was driven by women who were new adopters of family planning and had never previously used a method. Otherwise, during most contraceptive use transitions following a pregnancy, women returned to the same status that they had before the pregnancy, whether in use of a specific method or of no method at all.
There are fewer studies of how the composition of the subgroup of women with unmet need has changed over time. Two studies from Morocco (Curtis & Westoff, Reference Curtis and Westoff1996; Westoff & Bankole, Reference Westoff and Bankole1998) examined outcomes among a large sample of individual women with unmet need, using a panel of 1682 women who were interviewed in both the 1992 and 1995 Demographic and Health Surveys. They found that less than one-third of women with unmet need in the 1992 survey remained in that category when re-interviewed three years later, while more than three-quarters of contraceptive users remained as such.
In an Egyptian study, more than 2000 women were tracked for two years (Casterline et al., Reference Casterline, El-Zanaty and El-Zeini2003). Although 14% of all women moved out of the unmet need category (representing half of those with unmet need), the level of unmet need in the aggregate increased because an additional 20% of women entered the category. Women who left the unmet need category were about equally likely to do so through contraceptive use or by shifting to a state of no need for contraception due to a desire to conceive. Meanwhile, among women who entered the unmet need category, approximately three times as many women previously had no need compared with those who were previous contraceptive users.
The Demographic and Health Survey (DHS) programme has collected monthly calendars of contraceptive use and pregnancy history among women in some countries, but generally not in those with low contraceptive prevalence rates. When the DHS definition of unmet need was revised in 2012, calendar data were excluded in order to improve consistency and comparability across countries (Bradley et al., Reference Bradley, Croft and Fishel2012). A recent study limited to countries with available calendar data found that between 27 and 70% of married women experienced at least one episode of unmet need when tracked longitudinally within a five-year period, a higher level than the cross-sectional rate of unmet need recorded by the DHS (Kaneda et al., Reference Kaneda, Hagey, Smith and Baldwin2013). (However, in that study, women using traditional methods were classified as having unmet need, so its results are not directly comparable with those of the DHS.)
This study examines the extent to which increases in contraceptive prevalence within countries have drawn new users from women with unmet need and/or women with no previous need for contraception. Two forms of analysis are used to track changes in contraceptive use states over time in 22 countries in sub-Saharan Africa, using repeated household surveys conducted between the early 1990s and 2011. The results can potentially better inform the efforts of family planning programmes to reach new users.
Methods
Given the cross-sectional nature of the available data, it is not possible to track individual women over time as they exit and enter different states of use. Instead, this study uses multiple techniques to approximate this approach. Changes in the size and composition of groups of users and non-users are traced through an age-period-cohort analysis, built from repeated cross-sectional sectional surveys. Period changes are observed age-specifically across surveys, and cohort changes are observed by following any starting group as it ages across surveys. Both approaches examine how variation in one group compares with, or is predicted by, variation in another group. In addition, differences in fertility preferences, behaviours and intentions among women in different contraceptive use states are compared.
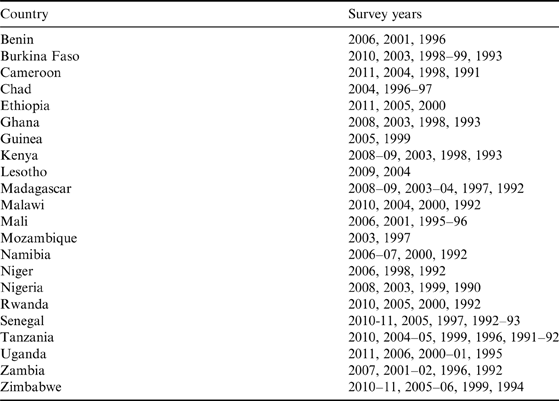
The study focuses on 22 countries in sub-Saharan Africa, the region with the lowest levels of contraceptive use (Westoff, Reference Westoff2012), over the period from 1990 to 2011 (Table 1). Nineteen of 22 countries' baseline surveys were conducted between 1990 and 1997, and the same proportion of most recent surveys date from 2006 to 2011. The average interval between baseline and most recent survey was 14 years. All cross-country averages presented are unweighted.
Countries and surveys included in the analysis

Data were analysed using the Stata/SE-12 statistical software package. The results generated in Stata were compared wherever possible against the MEASURE DHS STATcompiler tool as a check regarding the definition of subgroups and consistency with published DHS definitions and figures. To construct the variable describing unmet need, the Stata code was directly derived from MEASURE DHS, in accordance with the 2012 revised definition of unmet need (Bradley et al., Reference Bradley, Croft and Fishel2012). Furthermore, to account for survey design and over- or under-sampling, data within countries were weighted according to DHS instructions, and tabulations took survey designs into account.
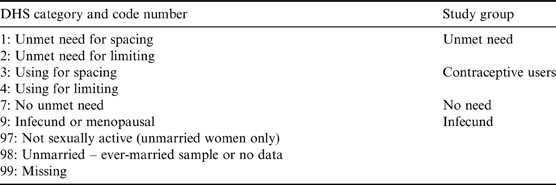
Using the nine DHS-defined contraceptive use states as a starting point, all married/in-union women ages 15–49 were classified into one of four mutually exclusive groups for each survey: unmet need, contraceptive users, no need and infecund (Table 2). The analysis focused on changes over time in the composition and characteristics of these groups, especially the first three.
Definition of analysis groups
The analysis adheres to the DHS definition in that users of traditional methods are not classified as having unmet need. However, this study does not focus on the disaggregation of unmet need by need for spacing versus limiting future pregnancies. Other studies have done so, and have demonstrated that unmet need for limiting is significant, though still lower than unmet need for spacing in most countries (Van Lith et al., Reference Van Lith, Yahner and Bakamjian2013).
In this analysis, women with ‘no need’ are those who are both exposed to the risk of pregnancy and are seeking (or at least not wishing to avoid) pregnancy. Women in the ‘infecund’ category are those who are ostensibly not at risk of pregnancy due to their inability to conceive. Although this definition of the infecund category is an aggregation of four DHS categories as shown in Table 2, two of the categories (‘not sexually active’ and ‘unmarried’) were automatically excluded because all analyses are limited to married/in-union women. Tabulations showed that the size of the remaining category (‘missing’) was consistently too small to register in the analysis. Therefore, the infecund category in this study is composed of women who are unable to conceive, either by their own account or by definition (for example, according to the DHS revised definition of unmet need, a married woman not using contraception with no pregnancy in the past five years is classified as infecund).
Period analysis
Changes in contraceptive use state between baseline survey and most recent survey were examined, both by age and in the aggregate. To examine period changes by age, the prevalence of contraceptive use, unmet need, no need and infecundity were measured for various age groups in the baseline survey and compared with the distribution of contraceptive use states for the same age groups in the most recent survey. For example, the prevalence of unmet need among 20- to 24-year-old women in Ghana in 1993 was compared with the prevalence of unmet need among 20- to 24-year-old women in Ghana in 2008. All change calculations presented in the period analysis describe the difference between baseline survey and the most recent survey.
Furthermore, to examine the predictive power of period changes in unmet need, change in unmet need was regressed against change in contraceptive prevalence in a simple linear regression. A second regression was conducted of change in no need against change in contraceptive prevalence. Potential confounding was explored by conducting a multiple linear regression with change in contraceptive prevalence as the dependent variable and change in unmet need and change in no need as the independent variables, in order to compare the coefficients with results from the simple linear regressions.
As a final step in the period analysis, cross-tabulations were constructed, comparing the fertility preferences of women in different states of contraceptive use at baseline and at the most recent survey. Several fertility-related questions were examined, including ideal family size, children ever-born, number of living children at first use of contraception, intention to use contraception in the future, desire for more children and wantedness of most recent birth. For questions that involved numerate answers, such as ‘ideal family size’, medians were used instead of averages, following the DHS protocol which codes non-numerate responses, such as ‘up to God’, with very high numbers.
Cohort analysis
A cohort approach based on five-year age groups was applied to approximate longitudinal tracking of changes in contraceptive use states among women over time. Because the DHS programme interviews a different population of women in each survey, it is not possible to track individual women longitudinally in panel studies across surveys. Instead, a cohort technique was used to follow each age group from one survey to the next, as all surveys are nationally representative. For example, the 20–24 age group in a first survey is considered to represent the ‘same’ women as the 25–29 age group in the next survey, given the common five-year interval between surveys. An alternative approach, not used here, would be to classify cohorts by the years of their birth rather than their ages during the survey period.
Defining cohorts based on age groups recognizes that although the respondents come from separate survey samples, the samples are large (>1000 women in each age group) and nationally representative at each point in time, which allows for valid cohort means to be measured. This method of using repeated cross-sectional surveys to approximate longitudinal panel data has been adopted over the past 30 years to link and track cohorts, which are sometimes then called pseudo-cohorts. Given adequate sampling, this approach is valid to analyse changes just as if a panel of individuals was being tracked (Deaton, Reference Deaton1985).
Cohort analyses are constructed by five-year age groups, observed at five-year intervals. Here, five-year intervals are approximated in some cases, because some countries schedule their surveys at other times. However, using a rule that survey pairs must be within 4 to 6.5 years of each other, 42 of the 54 inter-survey intervals qualify, or 79%. The mean interval is 5.2 and the median is 5 years. To ensure that variation in interval length did not skew the results, surveys with short and long intervals were removed and the data re-analysed. The smaller sample size produced similar country averages, as shown in Table 6, but two countries had to be removed entirely and seven others dropped from four or five surveys to two or three. Therefore, in order to increase the comprehensiveness and coverage of the results, all surveys were retained. This procedure still shows the movement of cohort behaviour through time, allowing for the relatively minor departures from five-year steps.
Results
Summary period analysis
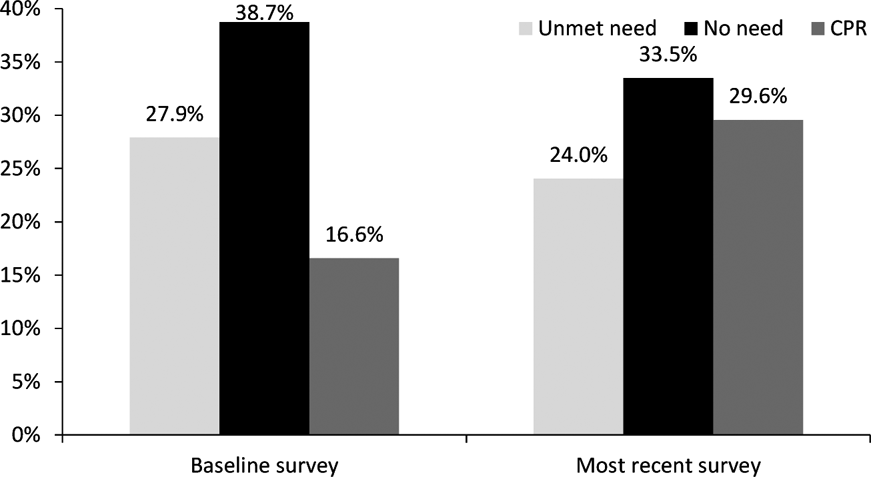
The levels of unmet need, no need and contraceptive use in these countries have generally become more equal over time. Across the 22 countries in this analysis, the contraceptive prevalence rate (CPR) increased by an average of 13 percentage points (from 16.6% to 29.6%) between each country's baseline and most recent surveys. This change is explained largely by the combination of declines in unmet need over the same period, by an average of 3.9 percentage points, and declines in the percentage of women with no need, by 5.3 points (Fig. 1). The remaining difference is explained by a 3.9 percentage point decrease in the percentage of women in the infecund group (not shown in Fig. 1).
Contraceptive use states, baseline and most recent survey, married and in-union women.
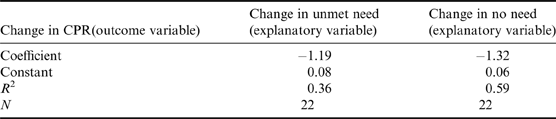
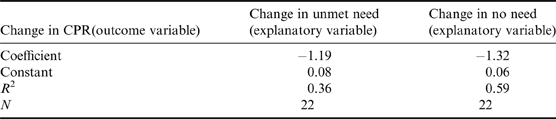
The declines in both unmet need and in no need occurred while CPR rose, so there exists a clear negative relationship between change in unmet need and change in CPR, as well as change in no need and change in CPR. However, when regressed separately, the effect of change in no need on change in CPR is greater, yielding a stronger negative correlation (Table 3). This suggests that variation in CPR is better predicted by variation in no need than in unmet need, a finding further explored below in the cohort analysis below.
Change in unmet need on change in CPR and change in no need on change in CPR, married and in-union women
In a multiple linear regression, the combination of changes in unmet need and in no need explain most of the variance in changes in CPR (Table 4). Theoretically, this is logical. Nearly all new contraceptive users should be drawn from either women with unmet need or those who were previously trying for pregnancy in the no need group; the only other source of new users is the infecund group, which is composed of women who should have no ability to conceive.
Change in unmet need and change in no need on change in CPR
N=22, R 2=0.88.
Period analysis by age groups
To examine in more detail how changes in CPR are affected by changes in the unmet need and no need groups, a period analysis was conducted to review changes in five-year age groups over time. For example, this analysis compares women ages 20–24 at the time of the baseline survey to the same age group, 20–24, at the most recent survey, thereby measuring aggregate changes across age groups rather than within cohorts.
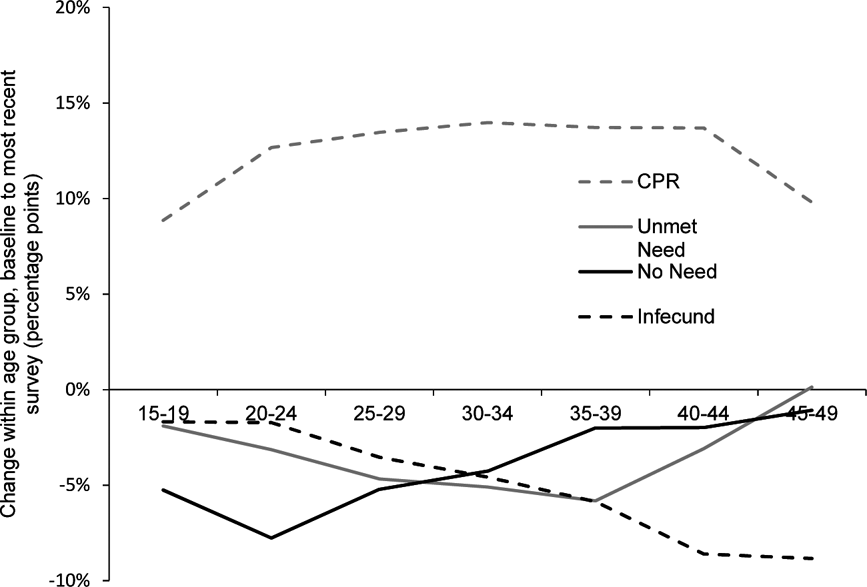
As Fig. 2 shows, across all countries, large increases in CPR appeared for women ages 20–44, covering most of the reproductive years. The CPR increased by 12 to 14 percentage points in each of the five-year age groups, comparing baseline with most recent surveys. The youngest and oldest age groups (15–19 and 45–49) experienced smaller increases in CPR, but still recorded a 9 percentage point increase.
Change in contraceptive use states by age, married and in-union women.
Declines in no need were concentrated among younger women. The percentage of women with no need declined by 5 to 8 percentage points among women ages 15–29, by 2 to 4 percentage points among women ages 30–44, and by approximately 1 point among women 45 and over. No need is the most common state for younger women, but this declines rapidly with age. From age 30 onward, the percentage of women with no need is matched or surpassed by those using contraception and those with unmet need.
Declines in unmet need were concentrated in the middle age groups, showing a different pattern from changes in no need. The three age groups between 25 and 39 each experienced decreases of 4 to 6 percentage points. Among women ages 15–24 and 40–44, declines in unmet need averaged 2 to 3 points, while there was no change among women ages 45–49. Meanwhile, the percentage of women in the infecund group declined at all ages, but by the greatest amount (6 to 9 percentage points) among older women. It is likely that increases in contraceptive use captured some of the women who previously would have been categorized as infecund.
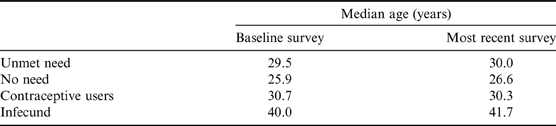
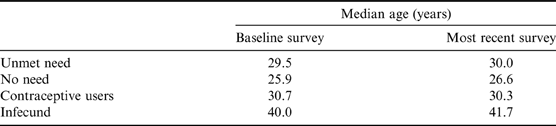
There was very little change in the median age of women in each group over time (Table 5). Women in the no need group were the youngest, with a median age slightly below 27 years in the most recent survey, while women in the unmet need and CPR groups were similarly aged at 30 years. Due to rising biological infecundity with age, the women in the infecund group were the oldest, at 42 years, in the most recent survey.
Average median age of analysis groups, married and in-union women
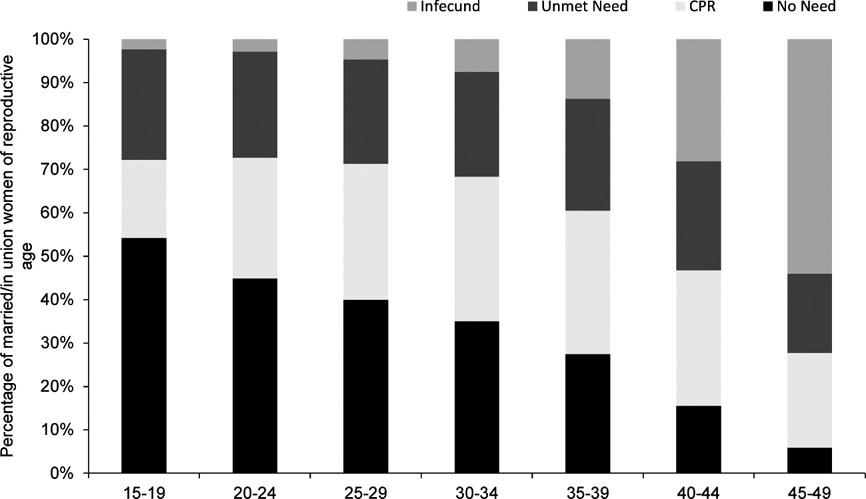
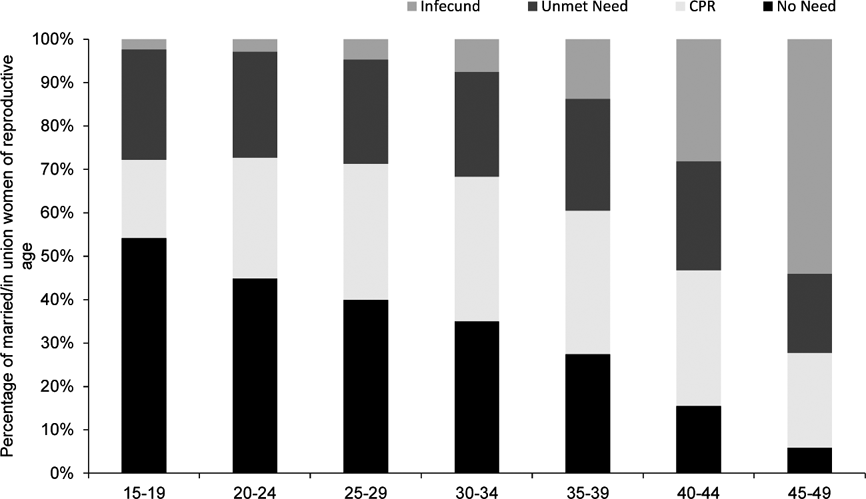
By the time of the most recent surveys, contraceptive use had risen to surpass unmet need within all age groups except women ages 15–19 (Fig. 3), a reversal from the pattern at the baseline surveys. Relative to the past, an increasing proportion of younger women have shifted from wanting births early in marriage towards wanting to delay or prevent pregnancy.
Contraceptive use states by age, most recent survey, married and in-union women.
Cohort analysis
Next, a cohort analysis was conducted. As explained above, women who were ages 15–19 at the time of the baseline survey were compared with women ages 20–24 in the second survey and to those ages 25–29 in the third survey, and so on, depending upon how many surveys the country had. Most surveys were taken at intervals close to five years apart, so this method permits a cohort perspective on changes due to the representative nature of the DHS cross-sectional data.
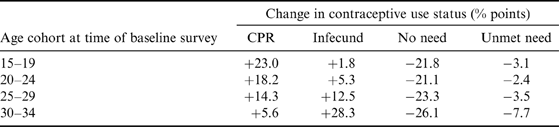
Results for four cohorts in all countries, averaging the results from each country's baseline to its most recent survey, are shown in Table 6. The four cohorts tracked were those in each five-year age group between the ages of 15 and 34, which include women who began the survey period at the beginning or middle of their reproductive years. Since many countries had four surveys, women who were 35 or older at the start ‘aged out’ of their reproductive years across the survey period and are not included in the table.
Change in contraceptive use states, baseline to most recent survey, married and in-union women, 22-country average
The cohort analysis showed that among the youngest starting cohorts, increases in CPR were largely offset by decreases in no need, with a much smaller contribution from decreases in unmet need. Women ages 15–24 at the time of the first survey, who proceeded from the early to middle stages of their reproductive years across the period, experienced a large decline in no need (21–22 percentage points), a smaller decline in unmet need (2–3 points), a large increase in contraceptive use (18–23 points) and a small increase in infecund status (2–5 points). The increase in CPR over time appears to have been driven by women who previously had no need for contraception considerably more than by women who had unmet need. Among these younger women, increases in CPR were within 1 to 3 percentage points, on average, of decreases in no need. The size of decreases in unmet need totalled only 10–15% of the increase in contraceptive use.
Among cohorts older at the start, at ages 25–34, increases in contraceptive use were smaller than those among younger women, partly because more women were already using a method at the initial survey. These cohorts were much more likely to enter the infecund group over time, being nearer the end of their reproductive years. In the oldest group tracked here (ages 30–34 at baseline), the decrease in the percentage of women with no need was more than three times larger than the decrease in unmet need, and the increase in the infecund group was five times larger than the increase in contraceptive use.
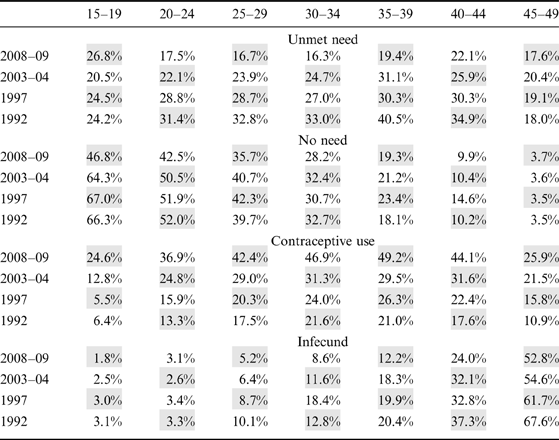
Madagascar serves as an example of detailed changes within cohorts. In Table 7, each cohort starts in 1992 and moves upward and to the right along the diagonal to enter the next higher age group in the next survey. For the cohort aged 20–24 in 1992, contraceptive use (third panel) began at 13.3%, rising to 20.3% in the next survey, then to 31.3%, and finally a large increase to 49.2% in the 2008–09 survey. This 35.9 percentage point rise in contraceptive users in this cohort was exactly matched by the net sum of the 32.7 point decline in the no need group (second panel), 12.0 point decline in the unmet need group (top panel) and 8.9 point increase in the infecund group (bottom panel).
Cohort analysis of contraceptive use states, Madagascar, married and in-union women
Note: Cohorts of women are followed across time as they age, diagonally from lower left to upper right. Specific cohorts can be tracked along shaded or white diagonals.
Among the cohort of Malagasy women who began the survey period ages 30–34 and completed it at ages 45–49, the decline in unmet need (33% to 18%) was also surpassed by the drop in the proportion of women with no need (33% to 4%). Although CPR also increased slightly over time (22% to 26%), most of the women who left states of no need or unmet need entered the infecund state, which is not surprising given their age at the end of the period. By the final survey, twice as many women in this cohort were in the infecund state as were using contraception (53% to 26%).
Other countries demonstrated a similar pattern, with increases in CPR among individual cohorts driven more by declines in no need than in unmet need. Among the 22 countries, declines in no need surpassed declines in unmet need in every country for women who began observation in the initial survey at ages 20–24. Among women who began observation in the middle of their reproductive years (30–34), declines in no need also surpassed those in unmet need over time, with three exceptions (Guinea, Kenya and Rwanda). However, because these women reached the end of their reproductive years at the time of the final survey, increases in the infecund group almost always exceeded increases in contraceptive use. These findings indicate that most increases in contraceptive use in these 22 countries have been driven by younger women who previously had no need for contraception.
Composition of contraceptive use states
To enlarge the context and implications of these findings, the composition of the unmet need, no need and contraceptive use groups and changes within each were examined. Six DHS questions about fertility behaviour, preferences and intentions were used: (1) median ideal number of children, (2) median children ever-born, (3) median number of living children at first use of contraception (among ever-users), (4) intention to use contraception in the future, (5) desire for more children, and (6) wantedness of the most recent birth.
Across these 22 sub-Saharan countries the median ideal family sizes were quite high. At the most recent survey they were highest among women with no need for family planning (5.6 children), followed by women with unmet need (5.4); contraceptive users had the lowest (4.7). Ideal family size declined over time in all three groups, but by less than one child per woman in each group.
In contrast to the pattern for ideal number of children, the number of children ever-born was highest among women with unmet need and lowest among women with no need. The number of children ever-born declined by 0.4 among both women with unmet need and contraceptive users, reaching 4.0 and 3.5 children per woman, respectively, at the most recent survey. The average number of children born to women with no need for family planning, who were consistently younger than the other groups, remained unchanged over time in nearly all countries and was relatively low, at 2.5 children per woman.
The DHS questionnaire asks all ever-users of contraception the number of living children they had at first use, to gauge what family size women prefer to achieve before beginning to space or limit childbearing. However, among women with unmet need and those with no need, it is asked only of previous users. (On average across all surveys, only 40% of women with unmet need and only 32% of those with no current need reported previous use.) At the most recent survey, women with no need, being generally younger, had the lowest parity at first contraceptive use, around one birth. Women with unmet need had the highest parity at first use (1.7 births), followed by contraceptive users (1.5 births).
The DHS also asks women who are not currently using contraception about their future intention to use. The results for the unmet need and no need groups are similar: at the most recent survey, 59% of women with unmet need and 55% of those with no need reported that they intended to use contraception in the future. For women with no need, this reflects a rapid increase over time in intention to use. At the baseline survey, the percentage was much higher among women with unmet need (56%) relative to those with no need (39%).
The percentage of women who reported that they want no more children, which indicates a clear need for contraception among those who are fecund, is highest among women with unmet need (45%), somewhat lower among contraceptive users (36%) and much lower among women with no need (14%). Measured from the baseline survey, the percentage who said they desire no more children increased by fairly small amounts among women with unmet need and those with no need (6 and 4 percentage points respectively), and remained level among contraceptive users.
At the most recent survey, the percentage of women who reported that their most recent birth was unwanted or mistimed (i.e. at the time of that birth, they wanted it later or wanted no more children) was highest among women with unmet need, averaging 46%, followed by contraceptive users at 32%. Very few women with no need for family planning (7%) reported that their last birth was unwanted or mistimed. The fact that this rate is highest among women with unmet need is not surprising, given that the question is used in part to define unmet need. On average, one-third of women with unmet need in this sample were classified as such because their most recent birth was unwanted or mistimed.
Discussion
Cross-national trends as well as detailed period and cohort analyses by age reveal that increases in contraceptive use over time within individual countries are driven by women who previously had no need, as well as those who had unmet need. However, a greater proportion of CPR increases between baseline and most recent surveys come from decreases in the percentage of women with no need, especially among younger women.
The declines in the percentage of women with no need suggest that more women in these African countries are seeking to use contraception to space and limit births at an earlier point in their reproductive years. Compared with the past, fewer women in the early years of marriage want a birth right away; instead they are more interested in delaying or preventing a birth, which removes them from the no need pool, and makes them potential contraceptive users. More than 40% of young married women aged 15–19 and half of those ages 20–24 now have a demand for contraception. This indicates that efforts to expand the acceptability of, access to and use of, family planning are succeeding among young married women.
Of course, comparing contraceptive use states in baseline and endline surveys conducted 15 or 20 years apart does not account for the multiple changes that may have occurred over the interim period. The summary results shown here do not clarify whether new users passed directly from a state of no need into one of contraceptive use without, for example, experiencing a period of unmet need in between. In other words, women with unmet need could have transitioned into the pool of contraceptive users and been replaced by women who previously had no need.
The lack of DHS contraceptive history calendar data for individuals in many countries precludes tracking changes in use states over very short time intervals. However, cohorts were tracked across each individual survey for all countries. This analysis validated the baseline to endline average changes shown in Table 6. Linear changes across time were observed within cohorts, with a pattern of steady increases in CPR and decreases in no need from one survey to the next. If women were moving from unmet need to contraceptive use and being replaced in the unmet need group by other women from the same cohort who previously had no need, the shift was happening too quickly to be recorded in the typical five-year interval of a DHS study. The offsets that occur within states of contraceptive use when observed across all women of reproductive age over time, for example with older women shifting from using contraception to infecundity and being replaced by younger women, are not applicable when tracing cohorts of same-aged women. Future research could disaggregate the cohorts by personal characteristics (such as urban/rural residence, wealth and education) to better assess whether the cohort-wide patterns in changing use states potentially mask offsets within cohorts.
The no need group, characterized by its youth relative to the other three contraceptive use states, emerged as a subgroup of particular interest. Despite some shifts over time, this study found that many younger women still have no need for contraception as they marry and begin to have children, only shifting into a state of contraceptive use or unmet need once they have their first child(ren) or achieve their desired family size.
However, the findings related to fertility behaviours and preferences within the no need group suggest that there are two distinct subgroups within this category. Sixty per cent of women with no need have never used family planning; of these, 55% also say they have no intention to use in the future. Though some may change their minds, these women are mainly dedicated non-users and difficult for family planning programmes to reach or serve. They are unlikely to move into a state of contraceptive use or unmet need until social norms regarding family size change further.
In contrast, the remaining 40% of women with no need for family planning have used contraception in the past, and began using after the birth of their first child. The low number of children born at first contraceptive use among these women indicates that they are probably actively planning their families and, at the time of the survey, had no demand for contraception because they were seeking pregnancy. Nearly two-thirds of the ever-users in the no need group intend to use family planning in the future, so they are very likely to shift in and out of one of the other categories, in particular that of contraceptive use. As previous studies have shown, intention to use is a strong, albeit not perfect, predictor of future use. Even if and when these women do adopt contraception, efforts to strengthen family planning programmes must not end there. Discontinuation rates are high: calendar data show that more than one-third of married and in-union women cease use within one year, most commonly due to dissatisfaction with the contraceptive method (Ali et al., Reference Ali, Cleland and Shah2012).
Although desired family size remains high among women in all states of contraceptive use in sub-Saharan Africa (around five children per woman) this may be changing, given increases in the share of women with unmet need and no need who intend to use contraception and those who want no more children. From a programme and policy perspective, this may reflect changing social norms about delaying pregnancy after marriage and increased willingness to use family planning. The proportion wanting no more children is highest (45%) among women with unmet need; this may also reflect barriers in access to, and use of, contraception.
The goal of reducing unmet need presents specific challenges for family planning programmes. At the time of the most recent survey, nearly a quarter of women in the 22 countries were in a state of unmet need. About 60% of women with unmet need say they intend to use contraception sometime in the future, but among individual cohorts of women, unmet need has declined very little over time, although overall use of contraception has increased. To achieve greater success in reaching women with unmet need, family planning programmes will have to address the complex and multifaceted reasons it exists. For example, Westoff (Reference Westoff2012) found that health-related concerns such as side-effects and inconvenience were most often cited as reasons for non-use among women with unmet need in 52 countries, followed by inability to conceive, lack of sexual activity and opposition to family planning. West and middle Africa will be a particular area of future programmatic focus, as attitudes towards family planning there are less favourable than in east and southern African countries (Cleland et al., Reference Cleland, Ndugwa and Zulu2011).
Acknowledgments
This study was funded by the US Agency for International Development (USAID) through the Health Policy Project under Co-operative Agreement No. AID-OAA-A-10-00067, beginning 30th September 2010. The views expressed are those of the authors and do not necessarily represent the views of USAID or the US government. The authors thank Karen Foreit, Aparna Jain and Elizabeth T. Robinson of the Health Policy Project, and participants at the 2013 IUSSP Seminar ‘Is Access Enough? Understanding and Addressing Unmet Need in Family Planning’ in Nanyuki, Kenya, for their review and useful suggestions.