Introduction
Pre-harvest sprouting (PHS) is an agronomic problem common to many cereal crops that cause economic losses in regions where the grain maturation phase takes place under humid weather (Rodríguez et al., Reference Rodríguez, Barrero, Corbineau, Gubler and Benech-Arnold2015). It is related to the disruption of seed dormancy in modern crops, a key adaptive trait in wild species (Hilhorst, Reference Hilhorst1995; Bewley, Reference Bewley1997; Finch-Savage and Leubner-Metzger, Reference Finch-Savage and Leubner-Metzger2006). As a result of reduced grain dormancy while still in the mother plant in combination with rainy, moist conditions that cause the grains to imbibe, the seed germination process is triggered. This leads to the hydrolysis of starch reserves and embryo elongation outside the pericarp, exposing the grain to fungi attack (with associated mycotoxins) and to lose desiccation tolerance (Castor and Frederiksen, Reference Castor and Frederiksen1977). In its worst version (i.e. where viability is lost), sprouting results in grains that are no longer suitable for malting or sowing of a new crop and have to be destined to other less profitable end-uses (Flintham and Gale, Reference Flintham and Gale1982).
During the domestication of cereals, selection pressure towards rapid and uniform germination (either for malting or sowing a new crop) favoured less-dormant genotypes as compared with wild ancestors. In some cases, low-dormancy genes were selected along with other (desirable) traits such as low-pigmented grains, reduced flowering time and low plant stature [discussed by Wang et al. (Reference Wang, Korkmaz, Guo, Pipatpongpinyo and Gu2020)]. For example, increased pigmentation has been frequently associated with deeper dormancy in cereals like rice, wheat, barley and maize [Gu et al., Reference Gu, Foley, Horvath, Anderson, Feng, Zhang, Mowry, Ye, Suttle, Kadowaki and Chen2011; Himi and Noda, Reference Himi and Noda2005; also discussed in Rodríguez et al. (Reference Rodríguez, Barrero, Corbineau, Gubler and Benech-Arnold2015)].
Dormancy is a quantitative trait governed by multiple genes, and its inheritance is also complex because it involves tissues and organs of diverse genetic parental composition (Hilhorst, Reference Hilhorst1995; Finch-Savage and Leubner-Metzger, Reference Finch-Savage and Leubner-Metzger2006). The sorghum (Sorghum bicolor (L.) Moench) grain is a caryopsis (Waniska and Rooney, Reference Waniska, Rooney, Wayne Smith and Frederiksen2002). Depending on the genotype, this cayopsis may be ‘naked’ or covered to different extents by the hulls (consisting of the glumellae – lemma and palea – and the glumes). The grain comprises an embryo, reserve tissue (corneous and starchy endosperm, and the aleurone layer) and the seed coat (nucellus and testa) fused to the pericarp. The tissue layers and organs surrounding the embryo (hulls, pericarp, testa and endosperm) may impose dormancy by restricting gas exchange or diffusion of soluble compounds, or by directly providing inhibitors to the embryo [as discussed in Rodríguez et al. (Reference Rodríguez, Barrero, Corbineau, Gubler and Benech-Arnold2015)]. The hulls, pericarp and testa may accumulate various phenolic compounds, such as phenolic acids, coumarins, flavonoids and tannins (Glennie, Reference Glennie1981; Cheng et al., Reference Cheng, Sun and Halgren2009; Dykes et al., Reference Dykes, Seitz, Rooney and Rooney2009). Despite some of these chemicals have an inhibitory effect on germination when added to the incubation medium, a role in vivo remains to be proved in sorghum.
Physiologically imposed dormancy in sorghum has been shown to be governed by the antagonistic effects of plant hormones abscisic acid (ABA) and gibberellins (GA), both during dormancy establishment in the developing grain and during dormancy expression in the imbibed grain (Steinbach et al., Reference Steinbach, Benech-Arnold, Kristof, Sánchez and Marcucci-Poltri1995; Gualano et al., Reference Gualano, Carrari, Rodríguez, Pérez-Flores, Sánchez, Iusem and Benech-Arnold2007; Rodríguez et al., Reference Rodríguez, Mendiondo, Maskin, Gudesblat, Iusem and Benech-Arnold2009, Reference Rodríguez, Mendiondo, Cantoro, Auge, Luna, Masciarelli and Benech-Arnold2012). Inbred lines displaying contrasting PHS response Redlan (low-dormancy, PHS-susceptible; also known as ‘Redland’) and IS9530 (deep-dormancy, PHS-tolerant) also differ in embryo responsiveness to ABA, and GA metabolism during imbibition (Steinbach et al., Reference Steinbach, Benech-Arnold, Kristof, Sánchez and Marcucci-Poltri1995, Reference Steinbach, Benech-Arnold and Sánchez1997; Rodríguez et al., Reference Rodríguez, Mendiondo, Maskin, Gudesblat, Iusem and Benech-Arnold2009, Reference Rodríguez, Mendiondo, Cantoro, Auge, Luna, Masciarelli and Benech-Arnold2012). These two inbred lines were also used by Cantoro et al. (Reference Cantoro, Fernández, Cervigni, Rodríguez, Gieco, Paniego, Heinz and Benech-Arnold2016) to obtain a mapping (F2 - F3) population and to identify several dormancy QTLs, although the causal genes are still unknown. IS9530 and Redlan are both red-grained and have no condensed tannins, and belong to different genetic backgrounds: IS9530 is relatively tall (>2 m) derived from the ICRISAT breeding program, and Redlan (also known as BTx378) is a three-dwarf derivative line (height: 1.3 m) from the U.S. Sorghum Conversion Program (Stephens et al., Reference Stephens, Miller and Rosenow1967).
In contrast with other cereal crops, breeding efforts in grain sorghum have not been positively directed to improve tolerance to PHS until recently. Since PHS events began to take place in different regions worldwide (including Central Argentina) caused by extreme climatic events (heavy rainfall and high temperatures), seed companies are now concerned about increasing dormancy levels to avoid losses by PHS during hybrid seed production and during grain production by farmers. Although the hormonal pathways (ABA and GA) regulating dormancy are highly conserved among cereals (Li et al., Reference Li, Ni, Francki, Hunter, Zhang, Schibeci, Li, Tarr, Wang and Cakir2004), the causal genes for intraspecific variability for this trait differ among species [reviewed by Rodríguez et al. (Reference Rodríguez, Barrero, Corbineau, Gubler and Benech-Arnold2015) and Nakamura (Reference Nakamura2018) and are still unknown in sorghum. None of the dormancy or PHS tolerance genes previously known in other species has so far mapped into any of the dormancy QTL detected in sorghum (Cantoro et al., Reference Cantoro, Fernández, Cervigni, Rodríguez, Gieco, Paniego, Heinz and Benech-Arnold2016).
Although previous work has shown that non-tannin inbred lines can display contrasting dormancy levels (Steinbach et al., Reference Steinbach, Benech-Arnold, Kristof, Sánchez and Marcucci-Poltri1995, Reference Steinbach, Benech-Arnold and Sánchez1997), it has been widely accepted that tannins contribute positively to grain dormancy and PHS tolerance. In a study with 42 sorghum hybrids (Harris and Burns, Reference Harris and Burns1970), a negative correlation between the germination index (GI) and astringent tannin content was observed. Nevertheless, experimental data supporting a causal relationship between tannin content and dormancy is still missing. Evidence for an effect of pericarp color on grain dormancy in sorghum is also missing in the literature.
In addition, no standard phenotyping protocol has been proposed so far to allow the classification of genotypes according to their expected behaviour for PHS in the field. As this trait results from an interaction between the genotype and the adequate environment to trigger germination, phenotyping for dormancy is labour-intensive and may also be affected strongly by sampling moment and other methodological criteria. In this work, we propose a protocol suitable for phenotyping and classifying sorghum genotypes according to their susceptibility to PHS. This protocol addresses the germination response of detached grains, and also of grains attached to the intact panicle under standard, laboratory conditions. Laboratory results are also compared with records of natural sprouting in the field. This work also explores possible associations between grain dormancy and other morphological traits such as grain pigmentation (testa and pericarp), glume size and color, plant height and time to flowering.
Materials and methods
Plant material and field experiments
Twenty genotypes including 11 inbred parent lines (5 female parents F1 to F5 and 6 male parents M1 to M6) and 6 F1 hybrids (named after their parents; for example, H1 × 1 is the F1 from cross F1 × M1) were sown in the field at the experimental station of Advanta Semillas in Venado Tuerto, province of Santa Fe, Argentina (see Supplementary Table S1 for details on genotypes). Except for reference lines, all inbred lines and hybrids belong to the ADVANTA breeding program. Reference lines Redlan, IS9530 and BTx623 are available through the U.S. National Plant Germplasm System (https://npgsweb.ars-grin.gov/) and ID codes are PI 669264, PI 668999 and PI 677943, respectively. All genotypes were sown in two dates (SD1 and SD2): SD1 was on 24 November and SD2 on 12 December 2019. The plot was fertilized at sowing with 150 kg ha−1 urea and 110 kg ha−1 MAP. Soil type was a typic argiudoll – taxonomy classification – Venado Tuerto Series. On each sowing date, each of 20 genotypes was sown in a 12.5 m2 sub-plot assigned randomly within a 300 m2 field plot. The whole plot was surrounded by a thick border of ‘edible’ grain sorghum to attract birds away from predating the assay. Each sub-plot had four furrows of 5 m long separated by 0.52 m (plant density: 16 pl m−2). The average anthesis (50% of panicles) date was recorded for each genotype, and panicles with the same anthesis date were tagged for germination tests. Panicles were covered with water-resistant paper bags a few days before anthesis to avoid cross-pollination, and uncovered after grain set finished. The sampling of panicles for germination tests took place between 15 March and 22 April 2020. Meteorological data during the crop cycle are presented based on records at the experimental site which included daily minimum, mean and maximum temperatures, incident photosynthetically active radiation (PAR) and rainfall.
Field and laboratory measurements
Germination tests with detached grains: 40 days after pollination (DAP), six panicles per genotype were harvested and grains from the middle third were threshed manually. For each panicle (one biological repetition), two replicates of 30 grains with glumes and two replicates of naked grains (without glumes) were incubated in 9 cm diameter Petri dishes on top of two layers of filter paper and 6 ml of distilled water, and kept for 12 d at constant 25°C in the dark. Petri dishes were wrapped with thin plastic to prevent evaporation, and germinated grains were counted (and removed) every three days (3, 6, 9 and 12 d) under natural light. A germination index (GI) is calculated [modified from Steinbach et al. (Reference Steinbach, Benech-Arnold, Kristof, Sánchez and Marcucci-Poltri1995)] as follows:
 $${\rm GI} = \displaystyle{{[ {( {G_3^\ast 12} ) + ( {G_6^\ast 9} ) + ( {G_9^\ast 6} ) + ( {G_{12}^\ast 1} ) } ] } \over {( {N/10} ) }}$$
where Gi is the number of germinated grains on day ‘i’ (i = 3, 6, 9 or 12), N is the total grains or seeds incubated (i.e. 30). GI ranges from 0 (no germination) to 120 (all seeds germinated by day 3). The GI values shown for each genotype are the average of six panicles (tested with or without glumes; GI + Glu and GI-Glu, respectively).
Germination tests with intact panicles under controlled conditions: At 45 DAP, six panicles per genotype were harvested. The culm was cut 15 cm below the panicle, placed vertically in a rigid wooden base (six panicles fit in the same base) and exposed to a constant shower of tap water for 10 min; the whole set was covered with plastic and left to drain for 15 min in the shadow, after which panicles were weighted individually, and placed again in the base. The amount of water retained by each panicle (panicle water retention, PWR) is calculated as the difference in weight before and after rain simulation and expressed as the percentage of initial weight. The whole set was covered with plastic to avoid evaporation and kept in a room with air conditioner at 24–25°C. Panicles were examined for sprouted grains after 3 and 7 d of incubation. To perform the counts, three branches per panicle were cut: apical, middle and basal. The number of sprouted grains (visible radicle or coleoptile) and non-germinated grains per branch was recorded and expressed as percentage. On day 3, panicles were exposed to a second 10-min shower, then covered with plastic and incubated at 24–25°C again for 4 more days, and then examined again on day 7. For each panicle, the germination percentage of basal, middle and apical branches was averaged to obtain a single value per panicle and incubation day (3 or 7). Individual values obtained for each of six panicles (repetitions) per genotype (in a same sowing date) were then averaged into a single sprouting (SPR) value for 3 and 7 d of incubation (SPR3d and SPR7d). These values were used in correlation and multivariate analyses.
The decision of using grains and panicles harvested at 40 and 45 DAP, respectively, is based on dormancy release dynamics observed previously in both reference lines IS9530 and Redlan (Steinbach et al., Reference Steinbach, Benech-Arnold, Kristof, Sánchez and Marcucci-Poltri1995, Reference Steinbach, Benech-Arnold and Sánchez1997; Benech-Arnold et al., Reference Benech-Arnold, Rodriguez, Sánchez, Carrari, Perez-Flores, Osuna-Fernández, Iusem, Lijavetzky, Stanelloni, Bottini, Nicolás, Bradford, Come and Pritchard2003; Rodríguez et al., Reference Rodríguez, Mendiondo, Maskin, Gudesblat, Iusem and Benech-Arnold2009, Reference Rodríguez, Mendiondo, Cantoro, Auge, Luna, Masciarelli and Benech-Arnold2012; Benech-Arnold and Rodríguez, Reference Benech-Arnold and Rodríguez2018) and on phenotyping results obtained for QTL analyses using a mapping population derived from these lines (Cantoro et al., Reference Cantoro, Fernández, Cervigni, Rodríguez, Gieco, Paniego, Heinz and Benech-Arnold2016). This moment is halfway between physiological maturity (PM < about 30–33 DAP) and harvest maturity (about 50–55 DAP), and contrast between parental lines is usually highest. As panicle assays may be more restrictive to germination (limited water availability as compared with incubation in Petri dishes), the intact-panicle assay was delayed 5 d to allow some advance in grain maturation and dormancy release. Other traits recorded and used in the analyses were: Plant height (HGT; from the ground level to the base of the panicle, measured at harvest maturity in ten plants per genotype and sowing date) and time from sowing to flowering (days to flower, DTF; for 12 plants per genotype and sowing date). Previously, semi-quantitative records of sprouting percentage in the field were obtained after natural sprouting occurred in field trials with these genotypes in Santa Fe (Argentina) during the 2017/2018 campaign. Within each row or plot (of a single genotype), at least ten panicles were assessed and classified as having 100, 75, 50, 25 or 0% of sprouted grains (visible radicles). These values were averaged to obtain a single PHS value (%PHS-field) for each genotype. On nursery rows, a hand lens was used for field evaluation and visual confirmation of radicle growth through the seed coat. The %PHS-field scores were obtained for parent lines at one locality and for hybrids in two nearby localities (these last were averaged for further analyses).
Pigmentation traits: The outer color of post-maturated grains was assessed by comparing with the Munsell soil color chart [as proposed by Mofokeng et al. (Reference Mofokeng, Shimelis and Laing2017)]. Chart color was then converted to RGB and then to greyscale (coefficients: 0.30 * R + 0.5 * G + 0.11 * B) to obtain a quantitative variable to use in the analyses. Glume color type was converted to a numeric scale as follows: Tan = 4, Red = 3, Purple = 2 and Black = 1. Condensed tannins were determined for most genotypes (but not all) by the Folin–Denis method (Ainsworth and Gillespie, Reference Ainsworth and Gillespie2007; Supplementary Table S1) and qualitatively (for all genotypes) using the bleach test (Waniska et al., Reference Waniska, Hugo and Rooney1992). According to these results, genotypes were classified as Low tannin (LT) or High tannin (HT). Reference lines included in the field trials were Redlan, IS9530 and BTx623 are all low tannin. BTx623 was included because it has an extreme PHS behaviour but also is a reference material for genomic studies (Paterson et al., Reference Paterson, Bowers, Bruggmann, Dubchak, Grimwood and Gundlach2009).
Data analysis
Phenotypic data were subjected to multivariate analysis. For PCA and cluster analysis, variables were: GI of 40 DAP grains incubated with and without glumes (GI + Glu and GI-Glu, respectively); Sprouting percentage in 45 DAP panicles exposed to simulated rain and incubated for three (SPR3d) and seven days (SPR7d). Data in the first analysis were obtained from 20 genotypes in two sowing dates cultivated in Venado Tuerto during the season 2019–2020. In the second analysis, the same variables were used but averaged between the two sowings, and including other variables: Panicle water retention percentage (PWR), plant height at harvest maturity (HGT), days to flowering (DTF) and also glume and grain morphological traits. PHS scores (expressed as percentage; %PHS-field) obtained after natural sprouting events for the same set of genotypes during the 2017–2018 growth season were also included in this analysis. All the variables were normalized to a common scale. Clusters analysis was performed using the average Euclidean distance and the ‘Ward’ clustering method. Both principal component analysis and cluster analysis were made and plotted using the R statistics program and the ‘FactorMineR’, ‘Factorextra’, ‘ggsci’ package (R Core Team, 2013). In the first analysis, the biplots were made for principal components 1 and 2, and the groups obtained by cluster analysis were plotted. In the second analysis, multiple Pearson correlations between all variables were calculated using ‘ggpairs’ function of the ‘GGally’ package.
Results
Germination (in vitro) and sprouting (in vivo) results
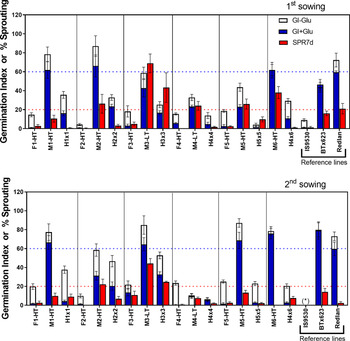
Sprouting-related phenotypic data were obtained for 20 sorghum genotypes sown in the field in two dates (environmental variables are summarized in Supplementary Table S2 and Fig. S1) and subjected to laboratory tests. Figure 1 shows GI values for 40 DAP-harvested and detached caryopses incubated with (GI + Glu) or without glumes (GI-Glu), along with the percentage of sprouted grains in 45 DAP panicles after exposure to rain simulation and incubation for 7 d (SPR7d; see MandM for details). Reference genotypes are IS9530 (high-dormancy, PHS-resistant), Redlan and BTx623 (both low-dormancy, PHS-susceptible). For IS9530, germination and sprouting values were almost null (GI = 8 for naked grains, and GI = 0 for grains with glumes, and no sprouting in whole panicles), and for sprouting-susceptible Redlan, GI values reached about 70 and 60 for naked and dressed grains, respectively, and panicle sprouting percentage was 20%. We considered a genotype to be susceptible if any of these thresholds (GI + Glu = 60 and SPR7d = 20%) was reached or trespassed. According to this criterion, several of the tested genotypes can be classified as susceptible (M1, M2, M3, M4, M5, M6 and H3 × 3). All these susceptible genotypes (named M1 to M6) are elite lines that behave as the male parent in the crosses for F1 hybrid seed production. On the contrary, elite lines used as females in the crosses (named F1 to F5) displayed low GI and panicle sprouting values (SPR7d), while hybrids (H1 × 1, etc.) were in between the parental lines or even closer to the mother parent.
Germination index for 40 DAP caryopses incubated with or without glumes (GI +/−Glu) and germination percentage after 7 d on whole panicles harvested at 45 DAP. Data for 1st and 2nd sowing date are shown in the upper and lower panels, respectively. The incubation of grains and panicles was performed at 25°C. Dotted lines indicate the GI (blue) and % sprouting (red) levels as observed in susceptible reference lines in the early sowing. Each data point is the average of six panicles and error bars are SEM (n = 6).

Multivariate analysis for germination and sprouting data
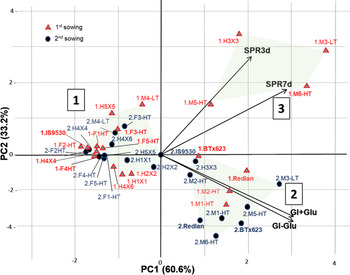
Principal component analysis was performed with germination data of 40 DAP detached grains (incubated with and without glumes) and with sprouting data of 45 DAP whole panicles (exposed to rain simulation and incubated for 3 and 7 d; SPR3d and SPR7d), obtained for 20 genotypes sown on two different dates. Biplot for PCA and groups defined by cluster analysis are shown in Fig. 2. The first two components explained 93.7% of total variability (PC1, 60.5% and PC2, 33.2%). Principal component analysis placed deep-dormant genotypes on the negative range of PC1 into group 1, which included 12 genotypes with low GI and SPR scores on both sowing dates. Less-dormant genotypes were included in groups 2 and 3 on the positive range on PC1 along with SPR and GI vectors. Group 2 included eight genotypes with higher GI and/or SPR scores on either one or both sowing dates; among these, four genotypes, when tested on the early sowing, were further separated along PC2 into group 3. The difference between group 2 and 3 was caused by higher sprouting (SPR7d) scores relative to GI scores (while in group 2, SPR7d scores were usually lower than GI scores). The PHS-resistant reference line IS9530 belonged to group 1 together with more dormant genotypes (female parents F1 to F5, and hybrids H1 × 1, H2 × 2, H4 × 4, H5 × 5 and H4 × 6), while both PHS-susceptible reference lines (Redlan and BTx623) were included in group 2. One genotype, M4, was classified by PCA into group 1 along with PHS-resistant types; this genotype had been identified as susceptible according to SPR7d above 20% (Fig. 1). In spite of these discrepancies between the GI and SPR7d values in some genotypes, all PHS-related variables were significantly correlated among them (Correlation matrix in Supplementary Fig. S2A). Strongest correlations were observed between ‘detached-grain’ variables (i.e. GI with and without glumes, r = 0.948***) and between ‘whole panicle’ variables (SPR3d and 7d; r = 0.751***), and correlation was weaker (but still significant) when comparing ‘detached grain’ with ‘whole panicle’ variables (e.g. GI + Glu vs SPR7d, r = 0.406**; Supplementary Fig. S2B).
PCA biplot for germination and sprouting variables measured on 20 sorghum genotypes, sown on two different dates (1st: 24 November and 2nd: 12 December 2019) indicated by number 1 or 2 before each code). Eigenvectors reflect germination index for 40 DAP grains, incubated with (IG + Glu) and without glumes (IG-Glu) at 25°C, and sprouting % in 45 DAP panicles after 3 (SPR3d) and 7 d of incubation (SPR7d). Groups were defined by hierarchical clustering.

Inhibitory effect of the glumes on germination
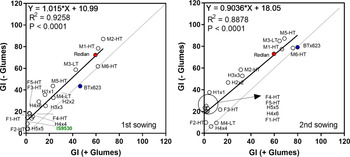
The GI of grains with glumes attached was lower than GI for naked grains for most genotypes on both sowing dates (Figs 1 and 3). Depending on the genotype, the inhibitory effect of the glumes ranged between 0 and 25 GI units (Supplementary Fig. S3). The inhibitory effect of glumes was similarly observed for both sowing dates, and the overall effect on GI can be observed as the positive displacement of the intercept from zero for both regression lines (10.99 and 18.05 for 1st and 2nd sowings, respectively). Among genotypes with high GI values, only two (BTx623 and M6-HT) showed no glume effect in both sowing dates (similar GI value with and without glumes).
Effect of glumes on germination. Biplot for germination index of 40 DAP grains with and without glumes, for 20 sorghum genotypes sown on two different dates (1st and 2nd sowing, ‘A’ and ‘B’, respectively). Reference materials (inbred lines Redlan and BTx623 – both weak dormancy – and IS9530 – strong dormancy) are shown in color (GI data for IS9530 were not available in the 2nd sowing). Regression equation in (A) is Y = 1.015 * X + 10.99 and for (B) Y = 0.9036 * X + 18.05. Each data point is the average of six panicles tested in two replicate dishes each.

Effect of sowing date on laboratory sprouting-related variables
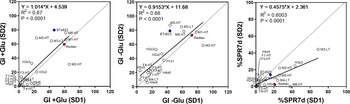
The effect of sowing date on each of the tested variables can be seen as deviations from the 1:1 relationship in biplots for SD1 versus SD2 (Fig. 4). For the germination data of detached grains (GI +/− glumes), most genotypes behaved similarly in both sowings (overall regression slope did not differ from 1). Nevertheless, some genotypes showed an interaction with the environment such as BTx623 and M5-HT (higher GI values in SD2 as compared with SD1) and M2-HT (higher GI values in SD1 as compared with SD2). This was different for laboratory results with whole panicles. When plotting the SPR7d values from both sowings, several less-dormant genotypes (including Redlan and BTx623) displayed lower SPR7d values on the 2nd sowing as compared with SD1 (slope <1). This suggests that this variable is less stable and more sensitive to environmental conditions (e.g. rainfall prior to panicle sampling; see Supplementary Fig. S1) as compared with determinations with detached grains.
Effect of sowing date on three PHS-related variables. Data were obtained for 19 sorghum genotypes on two sowing dates (SD1 and SD2). (A) Germination index of detached grains incubated with (GI + Glu), (B) GI of detached grains incubated without glumes (GI-Glu) and (C) sprouting percentage in 45 DAP-harvested panicles exposed to rain simulation (SPR7d). Each data point is the average of six panicles from each genotype and sowing date. The expected 1:1 relationship is shown in a dotted line. Linear regression is shown in a solid line. Data for PHS-resistant reference line IS9530 were not available on SD2 and were not shown.

Relationship between germination variables and other traits
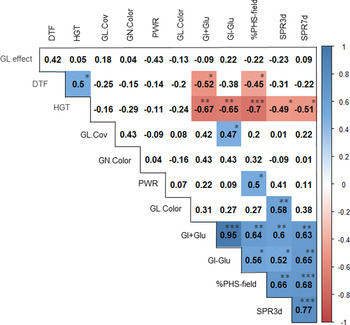
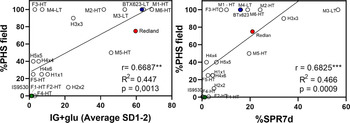
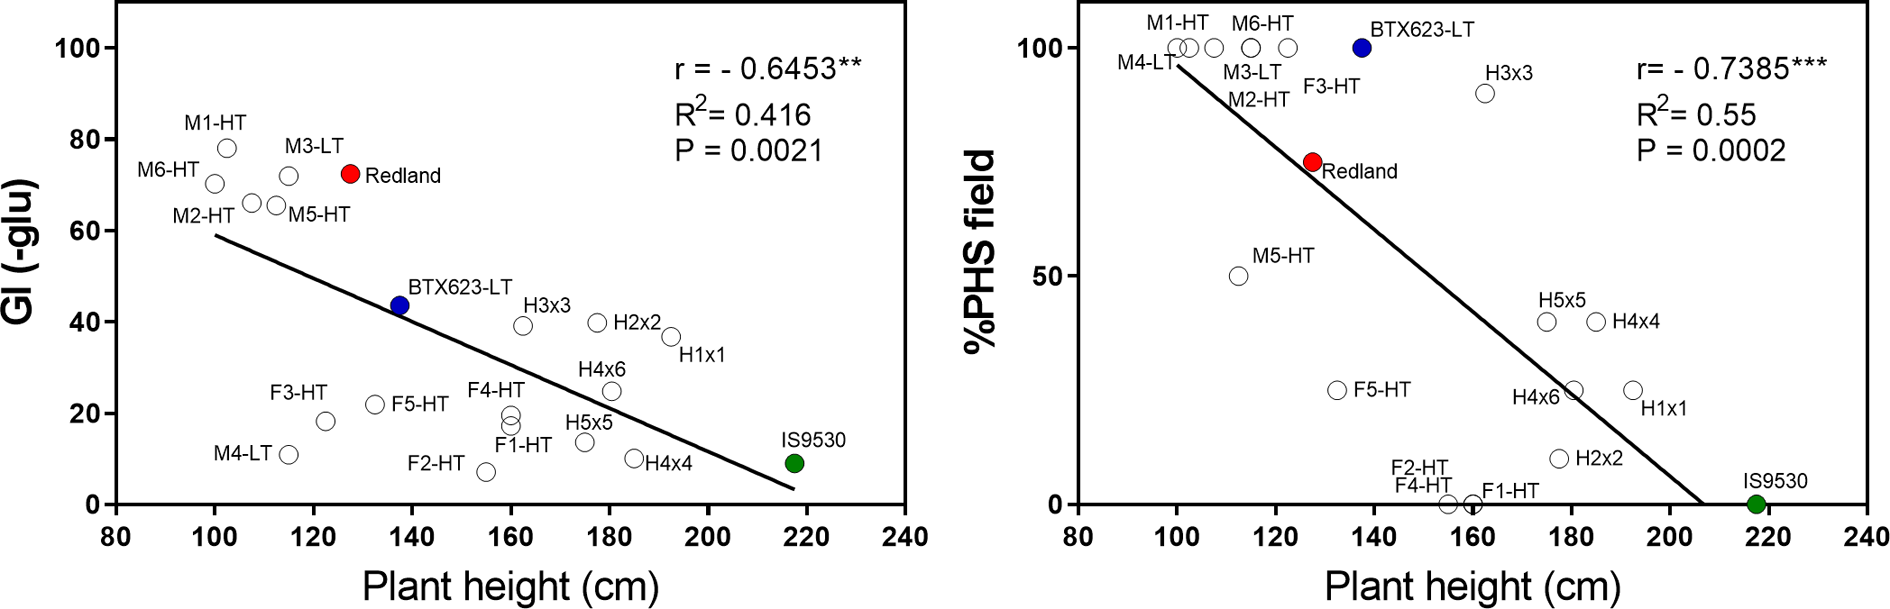
To explore possible associations with other morphological and phenological traits, multiple correlations were performed among each of the sprouting-related variables (measured in laboratory) and other traits measured in the same field trials. These traits included plant height (HGT), time to flowering (DTF), a panicle water retention index (PWR; for details on variables, see MandM section), and variables related to grain color and glume color and extension (% coverage of the grain). Previous records of PHS percentage were available for each genotype and were also included in the analysis (%PHS-field; see MandM section). Multiple correlation analysis pointed out a strong association between laboratory tests (with detached grains and whole panicles) and PHS levels after ‘natural’ sprouting in the field (Fig. 5). Strongest correlations with %PHS-field were with germination data of intact panicles (e.g. SPR7d; r = 0.679, P-value = 0.001) followed by correlation with GI + Glu (r = 0.636, P-value = 0.003; Fig. 6). All these sprouting-related (laboratory and field) variables were also negatively and strongly associated with plant height. For example, GI of naked grains (GI-Glu) correlated negatively with plant height (r = −0.6453, P-value = 0.002), and so did %PHS-field (r = −0.705, P-value = 0.001; Fig. 7). Weaker (but still significant) correlations with time to flowering (DTF) were observed for plant height (r = 0.497, P-value = 0.026), GI + Glu (r = −0.521, P-value = 0.018) and %PHS-field (r = −0.449, P-value = 0.047). Panicle water retention index (PWR) only correlated (weakly) with %PHS-field (r = 0.497, P-value = 0.026) and was not related to any of the sprouting-related laboratory determinations. Finally, glume and grain traits were not clearly related to germination and sprouting variables, or with the glume effect. Grain and glume color traits were not correlated with %PHS-field or with variables from laboratory tests (either detached grains or intact panicles), except glume color type with SPR3d (r = 0.58, P-value < 0.05; Supplementary Fig. S5). PCA results obtained with the same variables used in correlation analysis (Supplementary Fig. S4), also suggest that the grain-related traits (glume and grain pigmentation and glume size) have a relatively small effect on sprouting-related variables (laboratory and field) as compared with other factors. The separation of genotypes along PC1 was driven mostly by germination and sprouting behaviour variables, together with plant height and time to flowering (less-dormant, shorter and precocious genotypes in groups 2 and 3; and opposite on this axis, more dormant, tall and delayed flowering genotypes, in group 1). Panicle water retention % (PWR) was positively related with %PHS-field (r = 0.4665*, P-value = 0.038) although not with laboratory sprouting variables (SPR3d and SPR7d). A positive association between panicle water retention capacity and panicle sprouting was also observed in the PCA biplot, where the PWR vector is projected partially on both PC1 and PC2 along with sprouting-related vectors SPR3d and %PHS-field (Supplementary Fig. S4).
Correlation matrix for PHS-related traits (GI + Glu, GI-Glu, %PHS-field, SPR3d and SPR7d) and other functional/morphological/phenological traits: Glume effect on GI (GL.Effect, calculated as GI-Glu – GI+Glu), Days to flowering (DTF), Plant height (HGT), Glume coverage (GL.Cov), Grain color (GN.Color, after conversion to greyscale; higher score, white) and Glume color (GL.Color; categories 1–4: black, purple, red, tan). The percentage of sprouted panicles (%PHS-field) was determined visually after natural sprouting in the field occurred in the 2017/2018 campaign. For laboratory variables measured in the 2019/2020 field trials, the average value of both sowing dates (SD1 and SD2) was used in correlation analysis (except for panicle water retention, PWR, measured only in SD1).

Laboratory germination variables correlate with natural PHS in the field. The relationship between the PHS percentage observed in field trials (2017/2018 campaign) and (A) the germination index of 40 DAP detached grains incubated with glumes (GI + Glu) and (B) the sprouting percentage in 45 DAP panicles (SPR7d). Both GI and SPR7d were measured in 20 genotypes sown in two dates in the 2019/2020 campaign (each GI and SPR7d value is the average of both sowings).

Germination data obtained with detached grains (GI-Glu) in the laboratory and also after natural sprouting in the field (%PHS-field) are both negatively associated with plant height in a set of 20 sorghum genotypes. %PHS-field was measured after natural sprouting in the 2017/2018 campaign. Plant height and GI data used in correlation and regression analysis were averaged for two sowing dates in the 2019/2020 campaign.

Discussion
One of the objectives of this work was to develop a simple phenotyping protocol to characterize sorghum genotypes according to their susceptibility to PHS. This protocol should be simple enough and informative to be used in breeding programmes. Indeed, with the proper adjustments, this protocol is likely to be integrated with recently emerging platforms designed for automated seed imaging and high-throughput germination analysis (Colmer et al., Reference Colmer, O'Neill, Wells, Bostrom, Reynolds, Websdale, Shiralagi, Lu, Lou, Le Cornu, Ball, Renema, Flores Andaluz, Benjamins, Penfield and Zhou2020). In addition, this protocol was aimed to identify the main phenotypic sources contributing to PHS resistance. In a previous work (Cantoro et al., Reference Cantoro, Fernández, Cervigni, Rodríguez, Gieco, Paniego, Heinz and Benech-Arnold2016), phenotyping for PHS susceptibility was conducted in a mapping population, and grain germination was tested at 34 and 45 DAP. Although both variables were informative for QTL analysis, a better frequency distribution was observed with 45 DAP data. Identifying the right time for sampling is crucial for phenotyping for PHS response because grain dormancy changes dynamically during grain maturation (Benech-Arnold et al., Reference Benech-Arnold, Rodriguez, Sánchez, Carrari, Perez-Flores, Osuna-Fernández, Iusem, Lijavetzky, Stanelloni, Bottini, Nicolás, Bradford, Come and Pritchard2003). If sampling is done too early (i.e. close to physiological maturity, around 30–35 DAP) contrasting genotypes may behave similarly and germinate poorly; if sampling is done too late (after 50 DAP, close to harvest maturity) some genotypes (i.e. more advanced in grain maturation at the time of rain) may undergo pre-germination with subsequent loss of viability (and reduced germination), affecting laboratory assays. Sampling at 40–45 DAP allowed a good separation of the genotypes included in the test panel into PHS-susceptible and PHS-resistant types. A similar classification was obtained by comparing the tested genotypes with the susceptible reference lines Redlan and BTx623; if any of the laboratory-tested variables reached the same value as in Redlan or BTx623, the genotype was considered to be susceptible. This allowed to re-classify one genotype, M4-LT (identified as resistant by multivariate analysis), as being potentially susceptible despite low GI values in the laboratory tests with detached grains. This discrepancy between germination data of detached grains and sprouting in the panicle under both the laboratory and field conditions may be due to panicle characteristics facilitating grain imbibition (although this was not accounted for by the panicle water retention – PWR – of this genotype, which was below average; Supplementary Fig. S7) and/or other aspects of the germination process leading to sprouting.
The laboratory results (obtained either with detached grains or with intact panicles) correlated strongly with field records of ‘natural’ PHS, in spite these records have many sources of variability (e.g. genotypes exhibited different grain maturation levels at the time of rain; in our experiments, genotypes differed in up to 20 d for anthesis date; Supplementary Fig. S1). When analysing glume characteristics (color type and grain coverage %) and grain color (converted to a quantitative scale), no clear associations were found among these traits and germination or sprouting variables in the set of genotypes as a whole. Nevertheless, an effect of these factors on germination and sprouting cannot be discarded but have to be addressed in more detailed experiments and separated from other factors prevailing in the sorghum panel used here. Glume and panicle characteristics affecting dormancy may still prove to be relevant when deciding the direction of a cross during hybrid seed production as they may affect PHS resistance in the F1 seed (the role of the parents will no longer influence PHS behaviour in F1 panicles bearing F2 grains).
Unexpectedly, germination and sprouting levels were strongly correlated with plant stature. This may be due to genetic linkage of at least one dormancy gene with one of the Dwarf loci (dw1, dw2, dw3 or dw4) targeted by breeders for decades (Quinby and Karper, Reference Quinby and Karper1961; House, Reference House1985; Hilley et al., Reference Hilley, Truong, Olson, Morishige and Mullet2016). The possibility that a low-dormancy allele from the Yellow Milo background (which we observed is sprouting susceptible – data not shown) was introduced together with the dw1 allele during breeding for reduced height was first suggested and discussed in Benech-Arnold and Rodríguez (Reference Benech-Arnold and Rodríguez2018). Low heterozygosity along this region of chromosome 9 in a large GWAS panel (Morris et al., Reference Morris, Ramu, Deshpande, Hash, Shah, Upadhyaya, Riera-Lizarazu, Brown, Acharya, Mitchell, Harriman, Glaubitz, Buckler and Kresovich2013) indicates that, if both dw1 and the causal gene of QTL in chromosome 9 are linked, many elite parental lines (and probably, the male parents in this study) harbour this low-dormancy allele. Similarly, genetic linkage may exist between a dormancy gene and one of the several maturity genes targeted by domestication and breeding to reduce photoperiodic response in sorghum (Morris et al., Reference Morris, Ramu, Deshpande, Hash, Shah, Upadhyaya, Riera-Lizarazu, Brown, Acharya, Mitchell, Harriman, Glaubitz, Buckler and Kresovich2013; Klein et al., Reference Klein, Miller, Dugas, Brown, Burrell and Klein2015; Casto et al., Reference Casto, Mattison, Olson, Thakran, Rooney and Mullet2019). The positive association between increased dormancy (and sprouting resistance) and late flowering observed in our data coincides with results by Harris and Burns (Reference Harris and Burns1970).
Any possible effect of grain pericarp, testa and glume pigmentation may have on germination and sprouting, was probably overridden by other factors, at least in this experimental set-up. Pigmentation is a complex trait in sorghum regulated by at least ten different genes with epistatic effects (Kambal and Bate-Smith, Reference Kambal and Bate-Smith1976; Boddu et al., Reference Boddu, Svabek, Ibraheem, Jones and Chopra2005; Valencia and Rooney, Reference Valencia and Rooney2009; Wu et al., Reference Wu, Li, Xiang, Zhu, Lin, Wu, Li, Pandravada, Ridder, Bai, Wang, Trick, Bean, Tuinstra, Tesso and Yu2012). The grain color scale as used in our work was an oversimplification for this trait, and the effect of any gene involved in pigmentation should be properly assessed using other experimental systems (e.g. mutants, NILs, reciprocal crosses, co-segregation analysis, etc.). Tannin content was also unrelated to germination or sprouting traits (among the male parents, four are high tannin and two are low tannin, but all six displayed low dormancy and high susceptibility to sprouting; Supplementary Table S1). Moreover, PHS-resistant IS9530 is a low tannin type, suggesting that other relevant sources of dormancy exist independently of tannin content, as already mentioned by Harris and Burns (Reference Harris and Burns1970).
Resistance to PHS in cereals is a complex trait and, for that reason, phenotyping for this character is usually avoided in breeding programmes. Dormancy, as a central component of PHS response, is a rather unstable trait because it changes during grain development and maturation and is affected by the maternal environment as has been reported in many crop species (Benech-Arnold et al., Reference Benech-Arnold, Fenner and Edwards1991; Rodriguez et al., Reference Rodríguez, González Martín, Insausti, Margineda and Benech-Arnold2001; Nakamura et al., Reference Nakamura, Abe, Kawahigashi, Nakazono, Tagiri, Matsumoto, Utsugi, Ogawa, Handa, Ishida, Mori, Kawaura, Ogihara and Miura2011; Bodrone et al., Reference Bodrone, Rodríguez, Arisnabarreta and Batlla2017). In addition, dormancy expression also depends on the testing conditions (e.g. water availability and incubation temperature) (Vegis, Reference Vegis1964; Bewley, Reference Bewley1997). Therefore, protocols for testing dormancy should be adjusted for each species. In this work, we present a simple protocol and validate laboratory results obtained in two sowing dates (as growth environments) with independent field observations after natural sprouting in the field. Ideally, laboratory testing with both detached grains and intact panicles is recommended, as they account for different components of the PHS response (grain dormancy, glume inhibition and panicle characteristics that either promote or avoid PHS). The inclusion of the same reference lines in different trials is critical, as well as testing in more than one environment (sowing dates, years or localities). Also important is the search of associations with other traits; indeed, as dormancy is regulated by multiple genes, several of those genes may have been unconsciously selected together with other agronomic-interesting traits. For example, dwarf and semi-dwarf genotypes in rice and wheat are more dormant and PHS-resistant than taller genotypes because of reduced GA content or signalling (Flintham and Gale, Reference Flintham and Gale1982; Wu et al., Reference Wu, Kong, Wan, Liu, Zhang, Guo, Zhou, Zhao, Jing, Fu and Jia2011; Ye et al., Reference Ye, Beighley, Feng and Gu2013, Reference Ye, Feng, Zhang, Zhang, Mispan, Cao, Beighley, Yang and Gu2015; Wang et al., Reference Wang, Korkmaz, Guo, Pipatpongpinyo and Gu2020). This causal relationship does not seem to apply in sorghum, where genes regulating plant stature are not related to the GA pathway, but involve regulators of other hormonal pathways (Hilley et al., Reference Hilley, Truong, Olson, Morishige and Mullet2016; Yamaguchi et al., Reference Yamaguchi, Fujimoto, Hirano, Araki-Nakamura, Ohmae-Shinohara, Fujii, Tsunashima, Song, Ito, Nagae, Wu, Mizuno, Yonemaru, Matsumoto, Kitano, Matsuoka, Kasuga and Sazuka2016; Hirano et al., Reference Hirano, Kawamura, Araki-Nakamura, Fujimoto, Ohmae-Shinohara, Yamaguchi, Fujii, Sasaki, Kasuga and Sazuka2017). It remains to be tested if the dormancy QTL detected in sorghum chromosome 9 by Cantoro et al. (Reference Cantoro, Fernández, Cervigni, Rodríguez, Gieco, Paniego, Heinz and Benech-Arnold2016) is due to pleiotropic effects of the loss-of-function dwarf1 mutation, or is caused by a linked gene.
Results obtained with parent lines and F1 hybrids showed that the dormancy phenotype of the F1 panicles (bearing F2 grains) was intermediate between both parent inbred lines. Nevertheless, to distinguish between maternal or zygotic inheritance, reciprocal crosses should be performed. The phenotype of the F1 grains from reciprocal crosses will provide relevant information for hybrid seed production but also on the mechanisms involved in grain dormancy and the sources of intraspecific variability. Anyway, it is noteworthy that in this study female parents were more dormant (and PHS-resistant) as compared with the male parents, resulting from a breeding strategy based on the idea that PHS resistance in the F1 progeny is imposed by the female parent. The lines used as females were also taller, except for line F3-HT that had a high %PHS-field score and also produced a susceptible hybrid, H3 × 3. This again points to a low-dormancy allele related to a plant height gene, as suggested previously. Genetic dissection of grain dormancy and PHS resistance in sorghum is still in its early stages but will certainly lead to new, improved lines and hybrids to better meet the challenges of extreme climatic events.
Supplementary material
To view supplementary material for this article, please visit: https://doi.org/10.1017/S0960258521000076.
Acknowledgements
The authors wish to thank Advanta Semillas S.A.I.C. for making this research possible at the Research Station in Venado Tuerto, Santa Fe. We also thank the Sorghum research team: Lisandro Guillaumet, Oscar Allovatti, Job Maldonado, Paulo Serrano, Alejo Cordoba and Maria Fernanda Velez for conducting field and laboratory experiments, and data collection. We are also grateful to Pedro Pardo (Crop Research Lead – Sorghum and Pearl Millet, R&D of ADVANTA SEEDS) for invaluable help with experimental design and interpretation of results.
Financial support
This work was funded by the Agencia Nacional de Promoción Científica y Tecnológica (ANPCyT), Grant PICT 2017-4039 (PI: R.L. Benech-Arnold) which also finances doctoral grant for S.M. Díaz. ADVANTA Semillas S.A.I.C. also provided financial support for the experiments.