Introduction
Mismatch negativity (MMN) is a pre-attentive event-related potential (ERP) that measures the brain cortical response to occasional deviant stimuli in an otherwise repetitive series of standard stimuli (Näätänen, Paavilainen, Rinne, & Alho, Reference Näätänen, Paavilainen, Rinne and Alho2007). Specifically, it refers to an early negative deflection in the waveform obtained by subtracting activity evoked by deviant stimuli from activity elicited by standard stimuli. The most accredited MMN hypothesis interprets this brain potential as a prediction error signal: a brain response to sensory information that deviates from prior beliefs (Friston, Reference Friston2005; Garrido, Kilner, Stephan, & Friston, Reference Garrido, Kilner, Stephan and Friston2009). Accordingly, there is consensus on defining MMN as an index of brain adaptability to environmental changes (Fitzgerald & Todd, Reference Fitzgerald and Todd2020).
Functional imaging studies have shown that the auditory MMN originates in the bilateral auditory cortices with later involvement of frontal regions (Garrido et al., Reference Garrido, Kilner, Stephan and Friston2009). MMN reflects amplitude enhancement and increased phase synchronization of Theta (4–8 Hz) oscillations associated with processing deviant stimuli (Fuentemilla, Marco-Pallares, Munte, & Grau, Reference Fuentemilla, Marco-Pallares, Munte and Grau2008). Theta oscillations originate from the interplay between pyramidal neurons and GABAergic interneurons (Javitt, Lee, Kantrowitz, & Martinez, Reference Javitt, Lee, Kantrowitz and Martinez2018).
MMN, particularly when elicited by tone-duration increment, is attenuated in schizophrenia (SCZ), as first shown by Shelley and collaborators (Shelley et al., Reference Shelley, Ward, Catts, Michie, Andrews and McConaghy1991). Many studies have reported blunted MMN amplitude in SCZ, making it one of the most robust and replicable findings in this disorder (Javitt et al., Reference Javitt, Lee, Kantrowitz and Martinez2018; Kim, Blumberger, & Daskalakis, Reference Kim, Blumberger and Daskalakis2020; Light et al., Reference Light, Joshi, Molina, Bhakta, Nungaray, Cardoso and Swerdlow2020). Abnormal MMN amplitude in SCZ has been proposed to reflect a deficit in short- and long-range connectivity across auditory regions in detecting deviant stimuli (Koshiyama et al., Reference Koshiyama, Miyakoshi, Joshi, Molina, Tanaka-Koshiyama, Sprock and Light2020). Sparser findings show that MMN alterations are also present in other populations of patients with psychotic symptoms (Erickson, Ruffle, & Gold, Reference Erickson, Ruffle and Gold2016), like in bipolar disorder (BD) (Raggi, Lanza, & Ferri, Reference Raggi, Lanza and Ferri2021) and in first-episode psychosis (FEP) (Haigh, Coffman, & Salisbury, Reference Haigh, Coffman and Salisbury2017), and in subjects at clinical high risk for psychosis (CHR) (Bodatsch, Brockhaus-Dumke, Klosterkotter, & Ruhrmann, Reference Bodatsch, Brockhaus-Dumke, Klosterkotter and Ruhrmann2015; Tada et al., Reference Tada, Kirihara, Mizutani, Uka, Kunii, Koshiyama and Kasai2019). A recent study with more than 500 CHR participants reported only limited evidence of significant MMN reduction in this population, whereas the MMN deficit was associated with future conversion and earlier onset of full-blown psychosis (Hamilton et al., Reference Hamilton, Roach, Bachman, Belger, Carriòn, Duncan and Mathalon2022). Hence, the debate is still open about whether MMN alterations are peculiar to SCZ (Baldeweg & Hirsch, Reference Baldeweg and Hirsch2015; Erickson et al., Reference Erickson, Ruffle and Gold2016; Umbricht et al., Reference Umbricht, Koller, Schmid, Skrabo, Grubel, Huber and Stassen2003) or are instead shared by patients with a history of psychosis. In such a scenario, MMN might be informative on disease onset (Hamilton et al., Reference Hamilton, Roach, Bachman, Belger, Carriòn, Duncan and Mathalon2022; Naatanen, Shiga, Asano, & Yabe, Reference Naatanen, Shiga, Asano and Yabe2015; Nagai et al., Reference Nagai, Tada, Kirihara, Araki, Jinde and Kasai2013), progress (Fujioka et al., Reference Fujioka, Kirihara, Koshiyama, Tada, Nagai, Usui and Kasai2020; Perez et al., Reference Perez, Woods, Roach, Ford, McGlashan, Srihari and Mathalon2014; Shaikh et al., Reference Shaikh, Valmaggia, Broome, Dutt, Lappin, Day and Bramon2012), or resilience (Hamilton, Roach, & Mathalon, Reference Hamilton, Roach and Mathalon2021) in people at clinical risk of psychosis.
Current knowledge of MMN activity derives primarily from electroencephalography (EEG) studies focused on ERPs. An ERP results from increased amplitude and/or enhanced synchronization of specific frequencies (Makeig, Debener, Onton, & Delorme, Reference Makeig, Debener, Onton and Delorme2004). Hence, ERP amplitude analyses might miss subtle abnormalities in brain dynamics at the spectral frequency level. For instance, Grent-'t-Jong and collaborators (Grent-’t-Jong et al., Reference Grent-’t-Jong, Gajwani, Gross, Gumley, Krishnadas, Lawrie and Uhlhaas2020) showed that FEP and CHR differ in Gamma frequency evoked by dynamic visual stimuli, with both showing reduced phase synchronization, but only the first having also lower amplitude than controls. These results show that, compared to ERP amplitude analyses, the spectral frequency level might offer a more accurate characterization of the functional deficit affecting different clinical populations.
Low-density EEG experiments suffer from limited spatial resolution. Magnetoencephalography (MEG) offers a superior spatial resolution due to the robustness of magnetic activity to tissue-boundary field distortions. However, EEG can register the activity of brain regions independently of their orientation (Hunold, Funke, Eichardt, Stenroos, & Haueisen, Reference Hunold, Funke, Eichardt, Stenroos and Haueisen2016) while MEG might miss some deep and radial brain areas (Baillet, Reference Baillet2017; Hillebrand & Barnes, Reference Hillebrand and Barnes2002). Nevertheless, MEG preferential sensitivity to signals in the brain sulci walls makes this method suitable for accurate source localization of the auditory MMN activity at both the sensor and the source levels. Evidence of this is that, in EEG recording, MMN for auditory stimuli is generally registered over medial fronto-central electrodes, whereas bilateral temporal sensors are the primary recording locations of the magnetic MMN (mMMN) in MEG signal. Hence, compared to previous EEG studies, source-based time-frequency analysis of MEG activity associated with deviant tone exposure in people who have psychosis or are at risk for psychosis might provide insight into the activity of the auditory cortex to characterize the relationship between MMN anomalies and psychosis.
MEG has been already employed to study various psychiatric disorders, moving neurophysiological research closer to brain generators (Uhlhaas et al., Reference Uhlhaas, Liddle, Linden, Nobre, Singh and Gross2017). The majority of MEG studies tested abnormal mMMN amplitudes in SCZ (for a review, see Rojas, Reference Rojas, Supek and Aine2019), but few experiments investigated reduced mMMN in BD (Shimano et al., Reference Shimano, Onitsuka, Oribe, Maekawa, Tsuchimoto, Hirano and Kanba2014; Takei et al., Reference Takei, Kumano, Maki, Hattori, Kawakubo, Kasai and Mikuni2010) and CHR (Shin et al., Reference Shin, Kim, Kang, Koh, Choi, O'Donnell and Kwon2009), reporting results that were consistent with those in the EEG literature. Only one study investigated both SCZ and BD, finding that BD patients had an mMMN amplitude intermediate between SCZ and controls (Braeutigam, Dima, Frangou, & James, Reference Braeutigam, Dima, Frangou and James2018). However, to date, no MEG study has considered mMMN as a neurophysiological deficit of psychosis, considering different diagnostic profiles within the same experimental protocol.
The present experiment studied together four different clinical subgroups: patients with schizophrenia (P-SCZ), bipolar disorder with psychotic features (P-BD), first episode of psychosis (P-FEP), and people at clinical high risk for psychosis (P-CHR). Subthreshold psychosis symptoms characterize this latter condition (e.g. cognitive disturbances, attenuated psychotic symptoms, or brief and limited intermitted psychosis syndrome). CHR individuals have greater risk of developing psychosis than the general population (Millan et al., Reference Millan, Andrieux, Bartzokis, Cadenhead, Dazzan, Fusar-Poli and Weinberger2016). We aimed to test whether reduced mMMN is an attribute of psychosis or risk beyond categorical diagnosis. Similar mMMN reductions across these diagnoses would suggest that psychosis is linked to the abnormal adaptation of the sensory system to external changes. Moreover, identifying mMMN deficits in CHR would inform whether this neurophysiological response might be a risk index.
To this end, we employed source-based mMMN analyses of event-related fields (ERF), including Theta power activity and Theta inter-trial phase coherence (ITPC), in the four subgroups of patients and in four subgroups of neurotypical control participants matched for age and gender with patients (NC-SCZ, NC-BD, NC-FEP, and NC-CHR). CHR and FEP are generally younger than SCZ and BD. Therefore, this design accounts for potential demographic differences between the subgroups and offers an extended perspective that clarifies the potential inferences – for instance, a significant result for different patients v. controls contrasts cannot arise because of biased sampling of healthy controls in a single group. If reduced mMMN is an unspecific factor of psychosis, we expect a significant effect of Group, with patients showing smaller mMMN than controls, without a significant interaction between Group (P and NC) and Diagnostic Subgroup (SCZ, BD, FEP, and CHR) – which, instead, would point to a deviation of groups with respect to this index. Additionally, we assessed whether, in line with the observation of reduced phase synchrony but preserved power in CHR during a visual change detection task (Grent-’t-Jong et al., Reference Grent-’t-Jong, Gajwani, Gross, Gumley, Krishnadas, Lawrie and Uhlhaas2020), Theta ITPC is a more reliable index of psychosis, particularly in CHR, than Theta power. Finally, we tested the effect of psychopharmacological treatment on the mMMN outcomes.
Material and methods
Participants
We recruited 328 people, but the data of 15 participants were not analyzed because of excessive movement or strong external noise during the recording. The remaining 313 participants included 177 healthy people without any history of psychological or neurological disorders and 136 patients: 48 SCZ, 28 BD, 20 FEP, and 40 CHR. One patient with BD was not included in the study because she did not present psychotic symptoms. Hence, the final sample of the four patient subgroups was 48 P-SCZ, 27 P-BD, 20 P-FEP, and 40 P-CHR, for a total of 135 cases. The four independent neurotypical control subgroups were defined by selecting controls that best matched age and gender for each patient (48 NC-SCZ, 27 NC-BD, 20 NC-FEP, and 40 NC-CHR).
Based on Structured Clinical Interview for DSM-IV assessment (First, Spitzer, Gibbon, & Williams, Reference First, Spitzer, Gibbon and Williams1996), participants in P-SCZ had a diagnosis of schizophrenia or schizoaffective disorder, while participants in P-BD had a diagnosis of Type I bipolar disorder with psychotic symptoms. Participants in P-FEP were people who had experienced a first psychotic episode within the last 12 months. The risk for psychosis in P-CHR was assessed with the Italian version of the Comprehensive Assessment of At Risk Mental States (CAARMS; Yung et al., Reference Yung, Yuen, McGorry, Phillips, Kelly, Dell'Olio and Buckby2005). The severity of symptoms related to psychosis was valuated with the Italian version of the Positive And Negative Symptoms Scale (PANSS; Kay, Fiszbein, & Opler, Reference Kay, Fiszbein and Opler1987). Table 1 reports demographic data of participants in the different groups, along with PANSS scores for the four diagnostic subgroups.
Demographic and clinical characteristics of participants in the eight groups

n.s., not significant; p > 0.5; * = p < 0.05; ** = p < 0.01; *** = p < 0.001.
a Hollingshead index (N): P-SCZ = 42, NC-SCZ = 43, P-BD = 27, NC-BD = 24. P-FEP = 14, NC-FEP = 19, P-CHR = 34, NC-CHR = 37.
b Test di Intelligenza Breve [Brief Intelligence Test] (N): P-SCZ = 41, NC-SCZ = 43, P-BD = 26, NC-BD = 25, P-FEP = 15; NC-FEP = 19, P-CHR = 36, NC-CHR = 38.
c PANSS (N): P-SCZ = 44, P-BD = 20, P-FEP = 8, P-CHR = 31.
Forty-seven out of 48 P-SCZ, 20 out of 27 P-BD, 15 out of 20 P-FEP, and 8 out of 40 P-CHR had been receiving psychopharmacological treatment to mitigate psychiatric symptoms (see Table 2) and were studied after one month of stable treatment.
Types of pharmacological treatment received by patients in the four groups

n.s., not significant; p > 0.5; * = p < 0.05; ** = p < 0.01; *** = p < 0.001.
a Medications not recorded for 1 P-SCZ and 1 P-BD.
The ethics committee of the University Hospital of Bari approved the MEG protocol of the present study, and all the participants gave their informed consent for the recording of both clinical and MEG data.
Procedure
The auditory task employed to elicit mMMN was a passive oddball task with duration deviant stimuli (Michie et al., Reference Michie, Budd, Todd, Rock, Wichmann, Box and Jablensky2000). A sequence of 667 pure tones (1000 Hz, 80 dB) was presented to both ears through ear tubes while participants watched a silent Tom & Jerry video. Stimuli were either 50 ms long (standard) or 100 ms long (deviant). The standard:deviant ratio was 11:1. Deviant and standard stimuli were pseudo-randomly intermixed, with the constraint that the first deviant stimulus appeared after fifteen standard stimuli, and at least one standard stimulus was interposed between two deviant stimuli. The inter-stimulus interval was 500 ms. Participants were instructed to ignore the auditory signals and focus on the cartoon instead, so they could accurately answer questions about the movie after the experiment. Indeed, after the MEG session, each participant had to answer one question regarding a scene in the cartoon. All participants included in the study answered correctly to the question.
MEG data recording and processing
The MEG signal was recorded with Elekta Neuromag® TRIUX (Elekta Neuromag Oy, Helsinki, Finland). The recording sample rate was 1000 Hz. Offline, the MEG signal was first processed with Elekta MaxFilter™ software (Elekta Neuromag Oy, Helsinki, Finland) to remove external noise with temporal Signal-Space Separation (Taulu & Simola, Reference Taulu and Simola2006) and correct for head-movements according to five Head-Position Identifiers. Afterwards, the signal was processed with the MATLAB-based toolbox Brainstorm (Tadel, Baillet, Mosher, Pantazis, & Leahy, Reference Tadel, Baillet, Mosher, Pantazis and Leahy2011), following the standard group analysis processing pipeline (Tadel et al., Reference Tadel, Bock, Niso, Mosher, Cousineau, Pantazis and Baillet2019). Signal was first filtered from the standard Europe's electricity grid frequency and high frequencies (notch filter: 50 Hz; low-pass filter: 60 Hz). Artifacts associated with eye movements and heartbeat were identified and corrected by using ICA trained on all the sensors (number of independent components: 20), whereas residual artifacts were afterwards detected and rejected automatically (reference activity 0–60 s, 1 s time-windows; conservative detection with a sensitivity parameter of 5). The signal was then segmented into epochs that started 500 ms before stimulus onset and lasted for 1100 ms to account for edge artifacts in time-frequency analysis.
For the computation of the inverse source model, when necessary, the head position was manually adjusted to fit in the MEG helmet, and the individual head model was constructed as overlapping spheres with 15 002 vertices. A noise covariance matrix of empty room recording was used. After linear scaling, the sensor-based signal was converted into source-based signal with standard Low Resolution Brain Electromagnetic Tomography (sLORETA, Pascual-Marqui, Reference Pascual-Marqui2002) of constrained vertices reconstructing a template MRI brain model (ICBM152). All the analyses focused on vertices corresponding to the right (29 vertices) and left (40 vertices) parcellations of the Destriuex atlas (Destrieux, Fischl, Dale, & Halgren, Reference Destrieux, Fischl, Dale and Halgren2010), mapping the transverse temporal sulcus, the superior temporal gyrus, and the transverse temporal gyrus. These areas cover the locations of the primary and secondary auditory cortex (Shapleske, Rossell, Woodruff, & David, Reference Shapleske, Rossell, Woodruff and David1999), the regions where the auditory MMN originates (Garrido et al., Reference Garrido, Kilner, Stephan and Friston2009).
The analysis considered only the standard stimulus that preceded each deviant stimulus to obtain an equal number of standard and deviant stimuli. Segments with artifacts were not included in any analysis. In ERF analysis, source-based signal was normalized to z-scores according to the 200 ms pre-stimulus interval, converted to absolute values, and spatially smoothed before averaging. In time-frequency analyses, the signal was down-sampled to 200 Hz and processed with a set of complex Morlet wavelets (Cohen, Reference Cohen2014). The complex sine waves ranged from 4 Hz to 60 Hz, logarithmically spaced in twenty steps, whereas the Gaussian taper increased from 4 to 10 cycles as a function of frequency. Time-frequency power was computed as the mean power of the absolute value of the complex-value functions, converted to decibel (dB) to obtain signal changes relative to baseline (from −200 to −40 ms). ITPC was the mean angle of the complex-value functions. All the time-frequency analyses were performed vertex-wise before averaging the results across vertices to account for the effect of the sign in the MEG signal.
Each analysis focused on the mMMN, obtained by subtracting deviant from standard stimuli across the two bilateral regions of interest. The mMMN values were computed as the maximum peak amplitude (Luck & Gaspelin, Reference Luck and Gaspelin2017) in time windows selected according to the points when the grand-average mMMN-wave reached half of its maximum amplitude. The time window used for mMMN ERF amplitude analyses was 150–225 ms, while 100–300 ms was the time window in time-frequency analyses. Different time windows had to be selected because of the decrement in temporal precision resulting from time-frequency decomposition. Power and ITPC analyses considered only Theta-band activity between 4 and 9 Hz.
The distributions of ERF mMMN peak amplitude values of P and NC were analyzed to detect outliers. Four control participants (2 NC-CHR, 1 NC-BD, and 1 NC-FEP) and three patients (1 P-BD, 1 P-FEP, and 1 P-CHR) had mMMN peak ERF amplitudes larger than 1.5 inter-quartile difference, so their data were excluded from all the analyses (see additional online Supplemental Material).
To test the hypothesis that mMMN alterations are found in the continuum of the psychosis spectrum across different diagnoses, we computed omnibus ANCOVAs that considered Group (P v. NC) and Diagnostic Subgroup (SCZ, BD, FEP, v. CHR) as between-participants factors, and participants' age as a covariate. Power analysis performed with G*Power (Faul, Erdfelder, Lang, & Buchner, Reference Faul, Erdfelder, Lang and Buchner2007) indicated that, with 263 participants divided into 8 groups, the two-factors ANCOVA had a power of 0.80 to detect a medium effect (f = 0.25), like the MMN difference between patients and controls (Erickson et al., Reference Erickson, Ruffle and Gold2016), with an α level of 0.05. See additional online Supplemental Material for analyses of Laterality (right v. left) and Condition (standard v. deviant).
To discount the possibility that a single subgroup drove main effects of the ANCOVAs and because testing subgroup differences was part of our hypothesis, we additionally performed pre-planned two-tailed two-sample t tests. This procedure tested the hypothesis of lower mMMN for each contrast of patients against the respective controls. Results from patients with SCZ served to replicate prior evidence, whereas results from the other groups tested subgroup-specific hypotheses to establish a statistical benchmark for future mMMN studies. Here, α levels were corrected for multiple comparisons with the Holm-Bonferroni method.
To assess whether significant group differences were not driven by medications intake in patients, we investigated the effect of antipsychotics (treated patients, N = 77, and not-treated patients, N = 55), benzodiazepines (N = 28 and N = 104), and mood stabilizers (N = 40 and N = 92). The three mMMN parameters were the dependent factors of ANCOVAs that had medications as three independent factors and age as a covariate, in models that considered only the main effects of the three types of psychopharmacological treatment on the mMMN but no interactions.
Results
Event-related field (ERF)
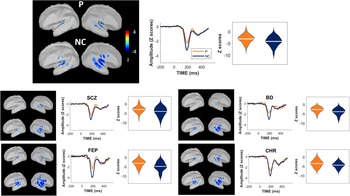
Analysis of mMMN ERF peak amplitudes across the four subgroups (see Fig. 1) revealed that the main effect of Group was significant, F(1,254) = 25.06, p < 0.001, η 2p = 0.090, but the main effect of Diagnostic Subgroup and the interaction between Group and Diagnostic Subgroup were not significant, Fs < 1. The covariate factor Age was also significant, F(1,254) = 8.80, p = 0.003, η 2p = 0.033. This significant effect of Age indicated that as age increases the mMMN ERF peak amplitude is significantly less negative, r = 0.22, p < 0.001. Along with the reliable evidence of smaller mMMN in patients with psychosis (P) than controls (NC), the non-significant interaction between Group and Diagnostic Subgroup reflects that mMMN ERF peak amplitude reductions are not strongly associated with the diagnostic subgroup.
Brain figures: depiction of brain activity (standard minus deviant) evoked over the left and the right hemisphere at 190 ms. Line-plots: grand-average mMMN ERF activity over time. Violin-plots: distributions of individual mMMN ERF peak amplitude values extracted from the selected time-window, with mean mMMN ERF peak amplitude depicted as a white line. The upper panel reports data of the transdiagnostic analysis, while the lower panel shows data for the four diagnostic subgroups.

We conducted pre-planned t tests to establish the significance of the mMMN ERF amplitude reduction for each diagnosis (see Fig. 1). The reduction was significant, with medium to large effect sizes, for all the diagnostic subgroups: SCZ (P-SCZ v. NC-SCZ), t(94) = 2.48, p = 0.015, d = 0.51, BD (P-BD v. NC-BD), t(50) = 2.76, p = 0.008, d = 0.77, FEP (P-FEP v. NC-FEP), t(36) = 2.50, p = 0.017, d = 0.81, and CHR (P-CHR v. NC-CHR), t(75) = 2.36, p = 0.021, d = 0.54.
The analysis of Medications on mMMN ERF peak amplitude did not show any significant effect, ps > 0.359.
Theta power
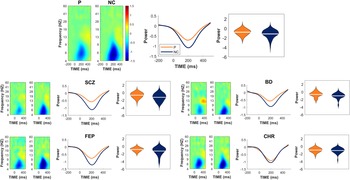
The analysis of Theta power (see Fig. 2) showed that the main effect of Group was significant, F(1,254) = 13.91, p < 0.001, η 2p = 0.051, but the main effect of Diagnostic Subgroup and the interaction between Group and Diagnostic Subgroup were both not significant, Fs < 1.16, ps > 0.321. The effect of Age was not significant, F(1,254) < 1. These results indicated that patients had lower mMMN-related Theta power than controls.
Filled contour plots: depiction of mMMN (standard minus deviant) time-frequency power for frequencies between 4 and 60 Hz over time. Line-plots: grand-average mMMN Theta power over time. Violin-plots: distributions of individual mMMN Theta power values extracted from the selected time-window, with mean mMMN Theta power depicted as a white line. The upper panel reports data of the transdiagnostic analysis, while the lower panel shows data for the four diagnostic subgroups.

The following tests performed to assess the statistical significance of Theta power effects in each diagnostic subgroup (see Fig. 2) revealed that the power reduction was significant only for SCZ, t(94) = 3.35, p = 0.001, d = 0.68, but not significant for BD, t(50) = 1.87, p = 0.068, d = 0.52, FEP, t(36) = 1.55, p = 0.131, d = 0.50, and CHR, t(75) = 0.83, p = 0.408, d = 0.19.
The analysis of Medications on Theta power did not show any significant effect, ps > 0.146.
Theta inter-trial phase coherence (ITPC)
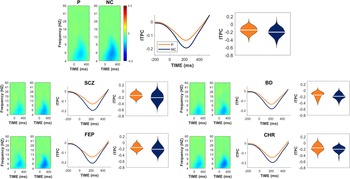
The analysis of Theta ITPC (see Fig. 3) showed that the main effect of Group was significant, F(1,254) = 18.80, p < 0.001, η 2p = 0.069, but the main effect of Diagnostic Subgroup and the interaction between Group and Diagnostic Subgroup were both non-significant Fs < 1. The effect of Age was short of significance, F(1,252) = 3.36, p = 0.068, η 2p = 0.013. These results indicated that patients had lower mMMN-related Theta synchronization across diagnoses.
Filled contour plots: depiction of mMMN (standard minus deviant) time-frequency ITPC for frequencies between 4 and 60 Hz over time. Line-plots: grand-average mMMN Theta ITPC over time. Violin-plots: distributions of individual mMMN Theta ITPC values extracted from the selected time-window, with mean mMMN Theta ITPC depicted as a white line. The upper panel reports data of the transdiagnostic analysis, while the lower panel shows data for the four diagnostic subgroups.

Diagnosis-based ITPC analyses showed that Theta ITPC (see Fig. 3) was significantly reduced in SCZ, t(94) = 3.20, p = 0.002, d = 0.65. The concurrent indication of a significant effect for CHR, t(75) = 2.32, p = 0.023, d = 0.53, did not survive correction for multiple comparisons. The reduction was not significant in the other two contrasts: BD, t(50) = 1.72, p = 0.093, d = 0.48, and FEP, t(36) = 1.95, p = 0.060, d = 0.63.
The analysis of Medications on Theta ITPC did not show any significant effect, ps > 0.261.
Discussion
The present experiment investigated the auditory mMMN, a pre-attentive neurophysiological index reflecting brain adaptability to deviant stimuli (Näätänen et al., Reference Näätänen, Paavilainen, Rinne and Alho2007), in SCZ, BD, FEP, and CHR. The study aimed to test the validity of this neurophysiological response as an index of psychosis and as a marker of risk for psychosis. To this end, MEG was employed to enhance source localization and restrict the analysis to the bilateral auditory cortices. Within this area of interest, we compared mMMN indices (ERF amplitude, Theta power, and Theta ITPC) in people with psychosis or at risk v. controls, first by considering psychosis as a transdiagnostic factor, then with a focus on each diagnostic category.
The presentation of a deviant auditory stimulus evoked an enhancement of the ERF activity (namely mMMN) over bilateral temporal sensors, with the source of activity centered in the superior temporal gyri around the primary and secondary auditory cortex locations. People with psychosis had overall reduced mMMN peak amplitude, Theta power, and Theta ITPC, and this effect seemed to apply to psychosis without a strong association to the diagnostic profile and medication. Pre-planned follow-up assessments of the significance of the mMMN reduction in each diagnostic subgroup showed significant, medium to large, effect sizes in ERF peak amplitude in each subgroup contrast, with a concurrent reduction of Theta power and Theta ITPC in SCZ and an indication of reduced Theta ITPC in CHR. Despite the evidence of mMMN reductions also in BD and FEP in both types of spectral analyses, the contrasts were not significant. However, the non-significant interactions in the analyses that considered the four subgroups within the same statistic suggest that this apparent difference across individual contrasts might be linked to chance or statistical power.
A recent meta-analysis of EEG studies suggests that MMN alterations are present also in BD, FEP, and CHR (Erickson et al., Reference Erickson, Ruffle and Gold2016), but this study is the first testing these populations within the same MEG experiment. The results supply additional evidence that mMMN reductions are not specific to SCZ but they affect all clinical conditions characterized by psychosis. Significant mMMN reductions were also observed in subjects at risk for psychosis. CHR is a premorbid profile of psychosis but only about 1 in 6 CHR suffer a worsening of the psychotic symptoms and receive a diagnosis of SCZ within five years (Lang et al., Reference Lang, Yates, Leacy, Clarke, McNicholas, Cannon and Kelleher2022). Presently, the lack of clinical follow-ups in the CHR population impedes determining the progression trajectory of our participants. A longitudinal study is required to establish whether the present effect was driven by those who will transition to SCZ or another chronic psychotic disorder (Fujioka et al., Reference Fujioka, Kirihara, Koshiyama, Tada, Nagai, Usui and Kasai2020; Hamilton et al., Reference Hamilton, Roach, Bachman, Belger, Carriòn, Duncan and Mathalon2022; Perez et al., Reference Perez, Woods, Roach, Ford, McGlashan, Srihari and Mathalon2014; Shaikh et al., Reference Shaikh, Valmaggia, Broome, Dutt, Lappin, Day and Bramon2012). However, the observation of significant mMMN reduction in CHR, among whom only few are expected to progress to full-blown psychosis, suggests that MMN might be a potential neurobiological marker in people with a greater risk for psychosis, irrespective of clinical course.
The indication of reduced phase synchronization in CHR aligns with recent MEG outcomes that showed reduced phase synchronization in Gamma frequency evoked by dynamic visual stimuli (Grent-’t-Jong et al., Reference Grent-’t-Jong, Gajwani, Gross, Gumley, Krishnadas, Lawrie and Uhlhaas2020). Hence, phase analysis might be more sensitive than power analysis in detecting functional deficits before the formulations of a diagnosis based on symptoms. However, power and ITPC seem to be differently involved by the physical aspect of the deviant stimuli, with frequency-deviant stimuli increasing Theta power and duration-deviant stimuli enhancing Theta ITPC (Lee et al., Reference Lee, Sehatpour, Hoptman, Lakatos, Dias, Kantrowitz and Javitt2017). Hence, in the present experiment, reduced ITPC in CHR might reflect the property of the deviant stimulus rather than a general functional deficit. Importantly, since most of the CHR were not medicated, the indications of reduced mMMN in this subgroup suggest that altered mMMN in psychosis or in people at risk for psychosis is not exclusively dependent on the effects of medications.
The observation of reduced mMMN in people with full-blown psychosis and in people with sub-threshold psychotic symptoms is consistent with the model put forward by Thomas and collaborators (Thomas et al., Reference Thomas, Green, Hellemann, Sugar, Tarasenko, Calkins and Light2017), in which an abnormal early auditory information processing is upstream in the cascade of processes that escalate to severe and persistent positive and negative symptoms and a decline of cognitive functions (see also Koshiyama et al., Reference Koshiyama, Thomas, Miyakoshi, Joshi, Molina, Tanaka-Koshiyama and Light2021). Hence, mMMN might be an important marker of psychosis, offering a neurophysiological index for early detection of people at risk. Since phase synchronization seems to be the basis of coordinated interaction between brain areas (Varela, Lachaux, Rodriguez, & Martinerie, Reference Varela, Lachaux, Rodriguez and Martinerie2001), diminished phase synchronization might reflect altered brain functional integration, or ‘dysconnection’, as a core feature of psychosis (Friston, Brown, Siemerkus, & Stephan, Reference Friston, Brown, Siemerkus and Stephan2016). However, the present MEG recording failed to detect the frontal component of the mMMN, where the right and left auditory activities converge. Hence, these data could not test the relevance of long-range functional connectivity. A simultaneous EEG/MEG recording might compensate for the MEG low sensitivity to radial and deep activity (Hunold et al., Reference Hunold, Funke, Eichardt, Stenroos and Haueisen2016), enabling a precise identification of all the brain sources contributing to the mMMN.
By including three groups of patients with a history of full-blown psychotic symptoms and a group of people with subthreshold psychosis, the present results indicate that mMMN reductions do not exclusively affect SCZ but also other clinical and subclinical psychiatric profiles characterized by psychosis. A recent meta-analysis of MMN studies in patients with major depressive disorder reported significant MMN reductions for duration deviant stimuli in these patients as well (Tseng, Nouchi, & Cheng, Reference Tseng, Nouchi and Cheng2021). Hence, our findings do not specifically ascribe mMMN deficits to psychosis among psychiatric conditions; however, we show that, within the psychotic spectrum, mMMN reduction is not exclusive of SCZ and is already present in recent-onset and in potential prodromic stages of chronic psychotic diagnoses.
One limitation of the present study was the difficulty in matching patients and controls according to IQ and socio-economic status. However, supplementary analyses indicated that mMMN amplitude does not correlate with these factors (see online Supplemental Material). Interestingly, the mMMN amplitude correlated with participants' age, with ERF peak amplitude declining over age (Cheng, Hsu, & Lin, Reference Cheng, Hsu and Lin2013; Kiang, Braff, Sprock, & Light, Reference Kiang, Braff, Sprock and Light2009; Tsolaki, Kosmidou, Hadjileontiadis, Kompatsiaris, & Tsolaki, Reference Tsolaki, Kosmidou, Hadjileontiadis, Kompatsiaris and Tsolaki2015) in a clinical population as well. Matching controls and patients for age and gender within each diagnostic subgroup was therefore a strength of the present design in which we investigated younger adults (CHR and FEP) and older adults (BD and SCZ) within the same experiment.
In conclusion, our findings suggest that mMMN – a neurophysiological pre-attentive index of brain adaptability to stimulus changes – could become a target for research aimed at studying the neurophysiological underpinnings of full-blown or subthreshold psychosis. Moreover, analyses of phase synchronization may be informative in detecting a psychosis condition also at a prodromal phase of illness.
Supplementary material
The supplementary material for this article can be found at https://doi.org/10.1017/S003329172200321X.
Acknowledgements
We thank Anna Montemurno, Gabriele Russo and Giuseppina Tancredi, for their help with MEG recording; Dr. Pilar Garcés, Onofrio Mezzina, Giampiero Monittola, Dr. Davide Sebastiano Rossi, and Eng. Antti Telio, for their technical and methodological support; Prof. Marina De Tommaso, Prof. Damiano Paolicelli, Prof. Francesco Piccione, Dr. Paolo Taurisano, and Prof. Maria Trojano for their scientific advice.
Financial support
This work was supported by research funding granted by the Apulia regional government to Prof. Alessandro Bertolino for the project: “Early Identification of Psychosis Risk”.
Conflict of interest
A.B. has received lecture fees from Otsuka, Janssen, and Lundbeck, as well as consultant fees from Biogen. All other authors have no biomedical financial interests or potential conflicts of interest to report.
Ethical standards
The authors assert that all procedures contributing to this work comply with the ethical standards of the relevant national and institutional committees on human experimentation and with the Helsinki Declaration of 1975, as revised in 2008.