1 Introduction
As a consequence of shock wave–boundary layer interaction (SWBLI), flow separation, transition to turbulence, unsteadiness and three-dimensional (3D) effects can have a significant impact on the aerothermodynamic performance of aircraft. For these reasons, major efforts have been made by the aeronautical research community to study SWBLI in the past 60 years (Dolling Reference Dolling2001). For laminar and turbulent boundary layers at low supersonic speeds, Liepmann (Reference Liepmann1946) and Ackeret, Feldmann & Rott (Reference Ackeret, Feldmann and Rott1947) first treated the following four typical situations in which this interaction appears: incident normal shock, oblique-shock reflection, presence of ramps and sharp fins. Despite the large amount of experimental work on SWBLI (Delery & Marvin Reference Delery and Marvin1986; Settles & Dolling Reference Settles and Dolling1990; Settles & Dodson Reference Settles and Dodson1991, Reference Settles and Dodson1994; Smiths & Dussauge Reference Smiths and Dussauge2006), available data in a Reynolds-number range where high-fidelity numerical simulations are feasible are limited and most of the work has been carried out for turbulent interactions. The works by Babinsky & Harvey (Reference Babinsky and Harvey2011) and Doerffer et al. (Reference Doerffer, Hirsch, Dussauge, Babinsky and Barakos2011), as well as being comprehensive reviews, also pointed out that unsteadiness in SWBLI remains one of the main unsolved issues on which a deeper understanding and further developments were still needed.
The existence of low-frequency unsteadiness in turbulent SWBLI has been widely acknowledged in the literature (Dolling Reference Dolling2001; Clemens & Narayanaswamy Reference Clemens and Narayanaswamy2014). However, the origin of this low-frequency unsteadiness is still controversial. While, on the one hand, this is often related to the interaction of the shock foot with turbulent structures of the incoming upstream boundary layer (Erengil & Dolling Reference Erengil and Dolling1991; Ganapathisubramani, Clemens & Dolling Reference Ganapathisubramani, Clemens and Dolling2007, Reference Ganapathisubramani, Clemens and Dolling2009), on the other hand, the unsteadiness is believed to be caused by an intrinsic mechanism of the shock wave–separated boundary layer system (Dupont et al. Reference Dupont, Haddad, Ardissone and Debiève2005; Pirozzoli & Grasso Reference Pirozzoli and Grasso2006; Touber & Sandham Reference Touber and Sandham2009; Grilli et al. Reference Grilli, Schmid, Hickel and Adams2012). Souverein et al. (Reference Souverein, Dupont, Debiève, Dussauge, van Oudheusden and Scarano2009) and Clemens & Narayanaswamy (Reference Clemens and Narayanaswamy2014) also discussed the possibility that both upstream and internal mechanisms contribute to the generation of the low-frequency unsteadiness, but the effect of the incoming turbulent boundary layer diminishes for increasing interaction strengths.
Laminar and transitional interactions are also of interest because they can occur in wind tunnel testing, on turbine and compressor blades and on wings and intakes. With the intention of carrying out a joint numerical and experimental investigation of transitional interactions at
 $M=6$
, Sandham et al. (Reference Sandham, Schülen, Wagner, Willems and Steelant2014) recently performed both direct numerical simulations (DNS) and experiments with three different facilities (Ludwieg tube and high-enthalpy shock tunnel in Göttingen, and hypersonic wind tunnel in Cologne). By investigating the effects of Reynolds number, disturbance amplitude, shock impingement location and wall cooling, a good cross-validation between experiments and DNS was provided. The stability of hypersonic laminar boundary layers interacting with an oblique shock or over a compression ramp was investigated numerically by Pagella, Rist & Wagner (Reference Pagella, Rist and Wagner2002) and Pagella, Babucke & Rist (Reference Pagella, Babucke and Rist2004), clearly showing that non-parallel effects led to increased growth rates of the disturbances. The presence of reverse flow in the laminar part of the bubble represents an additional source of inviscid instabilities due to the existence of inflectional points in the velocity profiles. This part of the bubble acts as a spatial filter–amplifier for the upstream disturbances, which experience a strong growth and can potentially cause nonlinear interactions and transition to turbulence. The transition process in boundary layers undergoing sufficiently strong adverse pressure gradient can therefore be very different from what happens in attached boundary layers when separation occurs (Rist Reference Rist2004).
An important aspect of the transition process is whether the laminar separation bubble presents an absolute instability. The works by Gaster (Reference Gaster, Hussaini, Kumar and Streett1991), Hammond & Redekopp (Reference Hammond and Redekopp1998), Alam & Sandham (Reference Alam and Sandham2000) and Rist (Reference Rist2004) shed some light on this major aspect, and the general conclusion is that, for separation bubbles with a maximum reverse flow magnitude less than 15–20 %, the transition process is governed by convective instabilities. In the absence of absolute (global) instability, the breakdown mechanisms can be very different, depending on Reynolds number and the thickness of the reverse flow region. While Alam & Sandham (Reference Alam and Sandham2000) and Rist (Reference Rist2004) clearly found an oblique-mode- and
 ${\rm\Lambda}$
-vortex-induced breakdown scenarios, Marxen et al. (Reference Marxen, Lang, Rist and Wagner2003) and Marxen, Rist & Wagner (Reference Marxen, Rist and Wagner2004) showed numerically and experimentally that transition was driven by two-dimensional (2D) Tollmien–Schlichting waves.
The basic mechanisms of the laminar–turbulent transition can be analysed using stability approaches that focus on the growth of small-amplitude disturbances in slowly varying shear flows. Linear stability analysis represents a powerful tool to study disturbance growth, with relatively low computational costs compared to large-eddy simulations (LES) or DNS (Herbert Reference Herbert1997). One of the simplest and most commonly used transition prediction models for aerodynamic design is the
 $e^{n}$
-method (Mack Reference Mack1984), which is based on local linear stability theory (LST) and quantifies the spatial growth rate of disturbances by solving the eigenvalue problem of the Orr–Sommerfeld equations. Despite the success of several LST strategies (Arnal Reference Arnal1994), the
 $e^{n}$
-method does not provide satisfactory results for 3D boundary layers (Reed, Saric & Arnal Reference Reed, Saric and Arnal1996). The 3D nature of boundary layers in swept wings, for which cross-flow instabilities play a fundamental role during the transition process, causes a scatter of the critical values of the
 $n$
-factor and makes the aircraft design rather conservative. Pagella et al. (Reference Pagella, Rist and Wagner2002) also showed that the agreement between LST and DNS is less satisfactory for strong oblique shocks interacting with a laminar boundary layer.
An obvious extension of the local linear approach is to consider the basic flow to be inhomogeneous in two dimensions and periodic in the third one, defining a linear ‘bi-global’ instability analysis (Theofilis Reference Theofilis2003). Robinet (Reference Robinet2007) performed a bi-global/bi-local analysis to study the stability and unsteadiness of a supersonic laminar SWBLI and successfully identified the compressible counterpart of the global mode found by Theofilis, Hein & Dallmann (Reference Theofilis, Hein and Dallmann2000) as the physical origin of a 2D/3D steady/unsteady bifurcation of the base flow found for different combinations of shock intensity and spanwise width of the numerical domain. Another alternative is the so-called non-local non-parallel stability theory. Inspired by the experimental observations in which the boundary-layer instabilities have a wave-like form in the streamwise direction, Herbert and Bertolotti (Herbert & Bertolotti Reference Herbert and Bertolotti1987; Bertolotti Reference Bertolotti1991; Bertolotti, Herbert & Spalart Reference Bertolotti, Herbert and Spalart1992) developed the linear parabolized stability equations (LPSE) on which the non-local non-parallel stability theory is based. This theory is defined as non-local because the growth of the disturbances is influenced by both local and upstream flow conditions, and non-parallel since the base flow is allowed to ‘slowly’ vary in the streamwise direction. For an incompressible zero-pressure gradient (ZPG) boundary layer over a flat plate, LPSE calculations by Mack & Herbert (Reference Mack and Herbert1995) and Bertolotti (Reference Bertolotti1997) successfully produced results in very good agreement with the experiments of Balakumar & Malik (Reference Balakumar and Malik1992) and of Klebanoff (Reference Klebanoff1971) and Kendall (Reference Kendall1990), respectively. A successful example of the application of LPSE on supersonic boundary layers is El-Hady (Reference El-Hady1991), who tested different criteria when defining the growth rate and found good agreement with the experimental results of Kendall (Reference Kendall1967) at
 $M=4.5$
when the growth rate was evaluated using the maximum of the mass-flow perturbations. A complementary use of LST for the primary instability phase and LPSE to take into account non-parallel effects was made by Yao et al. (Reference Yao, Krishnan, Sandham and Roberts2007) for unstable disturbances in SWBLI, where the evolution of the disturbances was followed up to the transition to turbulence via an oblique-mode breakdown. Hein (Reference Hein2005) carried out a linear/nonlinear analysis based on the DNS of Rist & Maucher (Reference Rist and Maucher1994) for an incompressible laminar separation bubble. For the linear case, very good agreement between the disturbance growth rates predicted by DNS and LPSE was found for 2D waves, while some discrepancies (larger for increasing wave angles) were found in the first half of the bubble. Hein concluded that the assumption of weakly non-parallel flow might fail near the separation point.
In this context, besides the basic instability characteristics, it is of interest to examine the existence or otherwise of low-frequency unsteadiness in a laminar SWBLI, where the clean incoming laminar boundary layer allows for a more controlled interaction. Sansica, Sandham & Hu (Reference Sansica, Sandham and Hu2014) showed that a low-frequency unsteadiness exists near the separation point for 2D laminar interactions at different shock strengths even when the forcing was only applied internally, therefore with a clean upstream boundary layer. However, the presence of the low-frequency unsteadiness in a 3D transitioning configuration has not been shown. As well as studying the linear stability of relatively large separation bubbles, the present contribution addresses the question of the existence and mechanism of low-frequency unsteadiness in a transitional interaction. A separated laminar boundary layer is perturbed at the inlet using a ‘modal’ forcing technique in which only specific eigenmodes are forced, without contaminating the low-frequency energy content upstream of the interaction. A DNS calculation is performed and wall-pressure data are collected for a spectral analysis. Sensitivity of the spectra to grid resolution and numerical domain size is also investigated.
2 Simulation details
2.1 Code features
2.1.1 Direct numerical simulations
The numerical investigation presented here is carried out with an in-house fully parallelized fourth-order finite difference code. More details and validation of the code can be found in Sansica et al. (Reference Sansica, Sandham and Hu2014) and references therein. For time integration a third-order low-storage Runge–Kutta method is adopted. An entropy splitting of the Euler terms is adopted to improve numerical stability, and a total variation diminishing scheme coupled with an artificial compression method is used to capture the shocks with the high-order central scheme. The Rankine–Hugoniot jump relations are applied at the computational domain top boundary to introduce the oblique shock wave. The numerical inflow is placed downstream of the flat-plate leading edge, where a similarity solution obtained using the Illingworth transformation provides the laminar compressible boundary-layer profiles. The dynamic viscosity is assumed to obey Sutherland’s law with the Sutherland reference temperature set to the free-stream temperature
 $T_{\infty }^{\ast }$
(where the superscript
 $\ast$
denotes a dimensional quantity) and the Sutherland constant to 110.4 K. The dimensionless conservative flow variables are defined as
 $[{\it\rho},{\it\rho}u,{\it\rho}v,{\it\rho}w,E_{t}]^{\text{T}}$
, where
 ${\it\rho}$
is the density, (
 $u,v,w$
) are the three velocity components in the streamwise, wall-normal and spanwise coordinate directions for (
 $x,y,z$
), respectively, and
 $E_{t}$
is the total energy. The flow quantities in the potential flow upstream of the interaction (
 $U_{\infty }^{\ast }$
,
 ${\it\rho}_{\infty }^{\ast }$
and
 $T_{\infty }^{\ast }$
) and the boundary-layer displacement thickness at the inlet (
 ${\it\delta}_{1,0}^{\ast }$
) are used as reference quantities for the non-dimensionalization. Therefore, time scales are normalized with
 ${\it\delta}_{1,0}^{\ast }/U_{\infty }^{\ast }$
, pressure with
 ${\it\rho}_{\infty }^{\ast }U_{\infty }^{\ast 2}$
and temperature with
 $T_{\infty }^{\ast }$
. Thus, the Reynolds number is defined as
 $Re_{{\it\delta}_{1,0}^{\ast }}=U_{\infty }^{\ast }{\it\delta}_{1,0}^{\ast }/{\it\nu}_{\infty }^{\ast }$
and the Mach number as
 $M=U_{\infty }^{\ast }/c_{\infty }^{\ast }$
. The ratio of specific heats is
 ${\it\gamma}=1.4$
(for air) and the Prandtl number is taken as
 $Pr=0.72$
.
2.1.2 Linear stability methods – LST and LPSE
Another in-house code has been developed to perform linear stability analysis of compressible boundary layers. The code allows both a local analysis, by solving the compressible Orr–Sommerfeld equations, and a non-local one, by solving the LPSE. Once the linearized perturbation equations are derived from the Navier–Stokes equations, different assumptions can be made and the two approaches obtained.
A critical assumption in the formulation of the LST is the parallel nature of the flow, where the dependence of the basic state on the streamwise direction is neglected. Although not congruent with reality, this assumption greatly simplifies the problem. With
 $(\bar{u},\bar{v},\bar{w})$
respectively denoting the streamwise, wall-normal and spanwise basic flow velocities,
 $\bar{T}$
the basic flow temperature and
 $\bar{{\it\rho}}$
the basic flow density, the parallel-flow assumption allows one to write
 $$\begin{eqnarray}\bar{{\it\rho}},\bar{u},\bar{T}=f(y),\quad \bar{v}=\bar{w}=0.\end{eqnarray}$$
Once this parallel-flow assumption is applied, the compressible formulation of the linearized disturbance equations or Orr–Sommerfeld equations are obtained. These equations are linear in the disturbances and all the coefficients depend only on
 $y$
. Therefore, it is possible to reduce the system to a set of ordinary differential equations by operating a separation of variables and choosing a normal-mode or wave solution (perturbations are periodic in the streamwise and spanwise directions and in time)
 $$\begin{eqnarray}\boldsymbol{q}^{\prime }(x,y,z,t)=\hat{\boldsymbol{q}}(y)\exp [\text{i}({\it\alpha}x+{\it\beta}z-{\it\omega}t)],\end{eqnarray}$$
where
 $\boldsymbol{q}^{\prime }=[{\it\rho}^{\prime },u^{\prime },v^{\prime },w^{\prime },T^{\prime }]^{\text{T}}$
is the primitive perturbation flow quantities vector and
 $\hat{\boldsymbol{q}}$
its corresponding modal shapes. Streamwise and spanwise wavenumbers are
 ${\it\alpha}$
and
 ${\it\beta}$
, respectively, and
 ${\it\omega}$
is the frequency.
If the normal-mode solution is substituted into the linearized perturbation equations and a temporal approach is considered, a linear system is obtained and can be represented as
 $$\begin{eqnarray}\unicode[STIX]{x1D647}\,\hat{\boldsymbol{q}}={\it\omega}\unicode[STIX]{x1D646}\hat{\boldsymbol{q}},\end{eqnarray}$$
where
 $\unicode[STIX]{x1D646}$
is a matrix that contains all the terms multiplied by
 ${\it\omega}$
and
 $\unicode[STIX]{x1D647}$
is a matrix of terms containing only
 ${\it\alpha}$
and
 ${\it\beta}$
. By considering a spatial approach, the system described in (2.3) is solved iteratively with respect to the streamwise wavenumber to match a prescribed target frequency.
The LPSE formulation is similar to LST, with the difference that the parallel-flow assumption is removed and the variables are allowed to ‘weakly’ vary in the
 $x$
direction. The basic state flow is now
 $$\begin{eqnarray}\bar{{\it\rho}},\bar{u},\bar{v},\bar{T}=f(x,y),\quad \bar{w}=0.\end{eqnarray}$$
Despite the 3D character of the perturbations, the basic flow is 2D and for this reason the analysis is usually referred to as two-dimensional parabolized stability equations (2D-PSE). For a single mode and assuming periodic perturbations in the streamwise and spanwise directions and in time, the disturbances are modelled using a normal-mode wave solution described by
 $$\begin{eqnarray}\boldsymbol{q}^{\prime }(x,y,z,t)=\hat{\boldsymbol{q}}(x,y)\,{\it\chi}(x,z,t),\end{eqnarray}$$
where the phase function
 ${\it\chi}$
can be written as
 $$\begin{eqnarray}{\it\chi}(x,z,t)=\exp \left\{\text{i}\left[\int _{x_{o}}^{x}{\it\alpha}(\tilde{x})\,\text{d}\tilde{x}+{\it\beta}z-{\it\omega}t\right]\right\}.\end{eqnarray}$$
The LPSE system can therefore be defined as
 $$\begin{eqnarray}(\unicode[STIX]{x1D647}+\unicode[STIX]{x1D647}_{np}-{\it\omega}\unicode[STIX]{x1D646})\hat{\boldsymbol{q}}+\unicode[STIX]{x1D648}\frac{\partial \hat{\boldsymbol{q}}}{\partial x}+\frac{\text{d}{\it\alpha}}{\text{d}x}\unicode[STIX]{x1D649}\hat{\boldsymbol{q}}=0,\end{eqnarray}$$
where
 $\unicode[STIX]{x1D647}$
and
 $\unicode[STIX]{x1D646}$
are the same matrices as used in (2.3) and the operators
 $\unicode[STIX]{x1D647}_{np}$
,
 $\unicode[STIX]{x1D648}$
and
 $\unicode[STIX]{x1D649}$
include all the non-parallel terms. All these operators are a function of only the
 $y$
coordinate. Equation (2.7) represents a simplified partial differential equation system that can be solved by a marching procedure in the streamwise direction that properly takes into account of the history of the spatial evolution of the modes. The marching procedure is initialized using local LST at the inflow, and vanishing disturbance velocities and temperature boundary conditions are applied at the wall and at the outer flow.
A Chebyshev differentiation scheme is used to discretize the flow in the wall-normal direction for both local and non-local approaches. For the non-local analysis, a first-order backwards finite difference scheme is applied in the streamwise direction.
Following the work of Bertolotti et al. (Reference Bertolotti, Herbert and Spalart1992), Herbert (Reference Herbert1993) and Hein (Reference Hein2005), all the second-order derivatives with respect to the streamwise direction of base flow and disturbance quantities and all the viscous terms including first derivatives with respect to the streamwise direction are neglected. Differently from what had been done in Chang et al. (Reference Chang, Malik, Erlebacher and Hussaini1993), the closure/normalization condition proposed by Hein (Reference Hein2005) is used to take into account the contribution of all mode shapes and can be written as
 $$\begin{eqnarray}\int _{0}^{\infty }\left(\hat{{\it\rho}}^{\dagger }\frac{\partial \hat{{\it\rho}}}{\partial x}+\hat{u} ^{\dagger }\frac{\partial \hat{u} }{\partial x}+\hat{v}^{\dagger }\frac{\partial \hat{v}}{\partial x}+{\hat{w}}^{\dagger }\frac{\partial {\hat{w}}}{\partial x}+\hat{T}^{\dagger }\frac{\partial \hat{T}}{\partial x}\right)\text{d}y=0,\end{eqnarray}$$
where variables with a dagger indicate the complex conjugate. The correction growth rate is here defined following Hein (Reference Hein2005), and the resulting variation of the imaginary part of the streamwise wavenumber as a function of the
 $x$
coordinate is
 $$\begin{eqnarray}{\it\alpha}_{i,corr}(x)={\it\alpha}_{i}(x)-\text{Re}\!\left(\frac{\partial \ln \sqrt{E(x)}}{\partial x}\right),\end{eqnarray}$$
where
 $\text{Re}$
indicates the real part and
 $E$
is the kinetic energy integral defined as
 $E=\int _{0}^{\infty }\bar{{\it\rho}}(\Vert \hat{u} \Vert ^{2}+\Vert \hat{v}\Vert ^{2}+\Vert {\hat{w}}\Vert ^{2})\,\text{d}y$
.
A full documentation and extensive validation of the code against compressible and incompressible benchmark cases found in the literature for both local (Macaraeg, Streett & Hussaini Reference Macaraeg, Streett and Hussaini1988; Malik Reference Malik1990) and non-local (Herbert Reference Herbert1993) studies are available in Sansica (Reference Sansica2015).
2.2 Inflow conditions and numerical set-up
A laminar boundary layer on a flat plate at an inflow Mach number
 $M=1.5$
, free-stream temperature
 $T_{\infty }^{\ast }=202.17~\text{K}$
and unit Reynolds number
 $Re_{1}=10^{7}~\text{m}^{-1}$
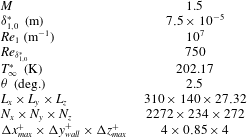
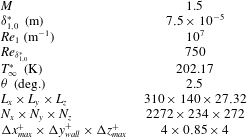
is impinged with an oblique shock wave. The inflow conditions are the same as in the experiments carried out at the Institute of Theoretical and Applied Mechanics (ITAM) in Novosibirsk, Russia, as part of the European TFAST Project (http://www.tfast.eu). For the present DNS study, the interaction is taken to be close to the leading edge and a Reynolds number based on the displacement thickness at the computational domain inlet is selected to be
 $Re_{{\it\delta}_{1,0}^{\ast }}=750$
, where
 ${\it\delta}_{1,0}^{\ast }=7.5\times 10^{-5}~\text{m}$
. The non-dimensional integration time step is
 ${\rm\Delta}t=0.04$
and the wall temperature is
 $T_{w}^{\ast }=279.20~\text{K}$
. An oblique shock wave, generated with a wedge angle
 ${\it\theta}=2.5^{\circ }$
, is introduced at the upper boundary of the computational domain at
 $Re_{x_{sw}}=0.95\times 10^{5}$
and impinges onto the boundary layer at
 $Re_{x_{imp}}=1.95\times 10^{5}$
, as represented schematically in figure 1. A 2D base flow is obtained for a numerical domain that extends far enough in the streamwise direction to contain the whole separation bubble and high enough in the wall-normal direction to avoid any potential reflections of the shock wave from the top boundary impinging on the boundary layer. The 2D base flow is then extruded in the spanwise direction over a width equal to the spanwise wavelength (
 ${\it\lambda}_{z}$
) of the unstable 3D mode within the separation bubble (this will be shown in detail in the next section). The domain size, normalized with the inlet displacement thickness, is therefore selected to be
 $(L_{x},L_{y},L_{z})=(310,140,27.32)$
, giving a streamwise range of Reynolds number
 $Re_{x}=(0.80{-}3.13)\times 10^{5}$
. The grid size is chosen in order to resolve transition and turbulence at the back of the bubble. For this reason, the grid is stretched in the streamwise and wall-normal directions to have more grid points clustered downstream of the impingement location and near the wall, respectively. The number of points in the streamwise, wall-normal and spanwise directions are chosen as
 $(N_{x},N_{y},N_{z})=(2272,234,272)$
, corresponding to grid sizes
 $({\rm\Delta}x_{max}^{+},{\rm\Delta}y_{wall}^{+},{\rm\Delta}z_{max}^{+})=(4,0.85,4)$
(where wall units are denoted by superscript
 $+$
and defined as
 $x_{i}^{+}=x_{i}u_{{\it\tau}}/{\it\nu}$
). The numerical set-up is summarized in table 1. The fully time-converged 2D-DNS base flow is obtained, and density contours (a), skin friction (b) and wall-pressure (c) distributions are plotted in figure 2. The laminar boundary-layer skin friction solution by Eckert (Reference Eckert1955) is also plotted in figure 2(b). A long steady separation bubble is formed for an adverse pressure gradient of
 $p_{d}/p_{\infty }=1.28$
(where
 $p_{d}$
indicates the pressure downstream of the reflected shock) and captured entirely within the numerical domain. Downstream of the interaction the flow does not fully recover to an equilibrium laminar boundary-layer solution within the domain.
Schematic representation of the numerical set-up. The shock generator plate with wedge angle
 ${\it\theta}$
introduces a shock wave from the top boundary at
 $x_{sw}$
that impinges onto the boundary layer at
 $x_{imp}$
. The displacement thickness at the numerical inlet
 ${\it\delta}_{1,0}^{\ast }$
is used as a characteristic length. Free-stream and downstream regions are indicated with the subscripts
 $\infty$
and
 $d$
, respectively.

Inflow conditions and numerical set-up of the 3D SWBLI case.
Two-dimensional steady base flow description: (a) density contours, (b) skin friction and (c) normalized wall-pressure distributions. The laminar boundary-layer skin friction result from Eckert (Reference Eckert1955) is also plotted (dashed line).

2.3 Transition tripping: modal forcing technique
To obtain transition to turbulence, the 3D steady base flow is forced by adding ‘modal’ disturbances, whose shape is defined by eigenfunctions corresponding to specifically selected eigenvalues. For the conservative variables vector
 $\boldsymbol{q}$
, the forcing at the inlet is
 $\boldsymbol{q}_{0}=\bar{\boldsymbol{q}}_{0}+\boldsymbol{q}_{0}^{\prime }$
, where
 $\bar{\boldsymbol{q}}_{0}$
is the steady base flow and
 $\boldsymbol{q}_{0}^{\prime }$
are the disturbances, which can be described as
 $$\begin{eqnarray}\boldsymbol{q}_{0}^{\prime }(y,z,t)=\boldsymbol{q}^{\prime }(x=0,y,z,t)=A_{o}\,\text{Re}\{\hat{\boldsymbol{q}}(y)\exp [\text{i}({\it\alpha}x\pm {\it\beta}z-{\it\omega}t)]\},\end{eqnarray}$$
where
 $A_{o}$
is the amplitude of the disturbances,
 $\hat{\boldsymbol{q}}(y)$
are the eigenfunctions calculated with local LST,
 ${\it\alpha}$
is the streamwise wavenumber,
 ${\it\beta}$
is the spanwise wavenumber and
 ${\it\omega}$
is the (single) frequency. The modal forcing is applied as a prescribed time-dependent inlet boundary condition. No-slip and isothermal (with the temperature equal to the laminar adiabatic wall temperature) conditions are enforced at the wall, an integrated characteristic method is applied at the top boundary and a standard characteristic boundary condition is used at the outflow. Periodic boundary conditions are applied in the spanwise direction. The instability of a boundary layer changes in the presence of a separation bubble and different modes can become unstable compared to a ZPG case. Temporal stability maps are calculated both at the inlet at
 $Re_{x}=0.80\times 10^{5}$
(virtually for a ZPG boundary layer) and within the separation bubble at
 $Re_{x}=1.78\times 10^{5}$
and respectively presented in figure 3(a,b), where the imaginary part of the frequency
 ${\it\omega}_{i}$
is plotted for different combinations of
 ${\it\alpha}$
and
 ${\it\beta}$
. For both cases, the unstable mode selected is a 3D wave that corresponds to
 ${\it\alpha}=0.240$
,
 ${\it\beta}=0.140$
with
 ${\it\omega}_{r}=0.123$
for the ZPG case and to
 ${\it\alpha}=0.200$
,
 ${\it\beta}=0.230$
and
 ${\it\omega}_{r}=0.101$
within the separation bubble. As expected, the separated boundary layer becomes more unstable and the imaginary part of
 ${\it\omega}$
increases by two orders of magnitude (from 0.00053 to 0.02546). Some differences might arise if the stability analysis was repeated using a spatial approach, especially in the presence of a separated boundary layer. Confirming the link between temporal and spatial unstable waves (Gaster Reference Gaster1962), for the ZPG boundary layer no differences are observed, while for the separated case the Gaster-transformed growth rate of the most unstable mode from spatial theory is within 15 % of that obtained from temporal theory. The scope of the present analysis is to find a combination of modes that effectively triggers transition to turbulence. Thus, the 3D unstable mode identified within the separation bubble is chosen and spatial linear stability is used to calculate the corresponding eigenfunctions at the inflow. An oblique mode breakdown has been shown to be the predominant transition scenario for low supersonic boundary layers (Fasel, Thumm & Bestek Reference Fasel, Thumm, Bestek, Kral and Zang1993; Sandham & Adams Reference Sandham and Adams1993; Sandham, Adams & Kleiser Reference Sandham, Adams and Kleiser1995; Mayer, Von Terzi & Fasel Reference Mayer, Von Terzi and Fasel2011); therefore a pair of oblique modes with
 $({\it\omega},{\it\beta})=(0.101,\pm 0.230)$
is selected to force the separated boundary layer. This information on the selected unstable mode is also used to set the width of the numerical domain to be equal to one wavelength of the identified 3D wave, therefore
 $L_{z}={\it\lambda}_{z}=2{\rm\pi}/{\it\beta}=27.32$
.
Temporal stability maps for (a) a ZPG boundary layer at
 $Re_{x}=0.80\times 10^{5}$
and (b) within the separation bubble at
 $Re_{x}=1.78\times 10^{5}$
. Contours of the imaginary part of the frequency/eigenvalue
 ${\it\omega}_{i}$
for combinations of the streamwise
 ${\it\alpha}$
and spanwise
 ${\it\beta}$
wavenumbers.

3 Linear stability of shock-induced separation bubbles
Given the non-parallel nature of the flow, LST can potentially be inaccurate for supersonic separated boundary layers. To test the applicability of linear stability, LST and LPSE methods are used to predict 2D and 3D disturbance growth rates for boundary layers at
 $M=1.5$
with increasingly significant non-parallel effects. By selecting shock waves at different strengths, marginal and large separation cases are obtained and used as base flows for the linear stability analysis.
3.1 Base flow selection
The same 2D base flow for a wedge angle
 ${\it\theta}=2.5^{\circ }$
presented in § 2.2 is here considered for the comparison between DNS and linear stability methods. For this case, the separation bubble is relatively large and, since the analysis is aimed to investigate different non-parallel effect intensities, a weaker shock at
 ${\it\theta}=1.3^{\circ }$
is also considered and a ‘marginal separation’ is obtained. The Reynolds number at the inlet is kept fixed and, in order to have the same impingement location of the shock wave on the boundary layer, the shock is introduced slightly earlier at
 $Re_{x_{sw}}=0.91\times 10^{5}$
for the marginal separation case. Since only a linear investigation is intended, the grid resolution is coarsened with respect to the one presented in § 2.2 and selected to be
 $(N_{x},N_{y})=(1000,200)$
. The 2D base flow is considered to be grid-independent when the difference in the separation bubble length
 $L_{SB}$
for different resolutions is less than
 $1\,\%$
, and a grid resolution study is presented in table 2. The 3D base flow is constructed by extruding the 2D base flow in the spanwise direction. A domain size
 $(L_{x},L_{y},L_{z})=(310,140,{\it\lambda}_{z})$
is selected for the large separation case and, for simplicity, also used for the marginal separation case. The domain width is fixed to be one spanwise wavelength (
 ${\it\lambda}_{z}$
) of the 3D mode selected and will be specified case by case. For small-amplitude (linear) problems
 $16$
grid points in the spanwise direction are sufficient as only one wave needs to be resolved. For validation and comparison purposes, a ZPG boundary layer is also analysed.
Skin friction (a) and wall-pressure (b) distributions for the ZPG (dashed line), marginal separation (dash-dotted line) and large separation (solid line) cases.

Grid resolution study for the marginal (
 ${\it\theta}=1.3^{\circ }$
) and large (
 ${\it\theta}=2.5^{\circ }$
) separation cases.

For each case, the simulations are run long enough in time to obtain a fully converged solution. It is possible to appreciate the differences in bubble size and pressure gradient for the investigated shock strengths by analysing the skin friction and wall-pressure distributions for the ZPG (dashed line), marginal separation (dash-dotted line) and large separation (solid line) cases reported in figures 4(a) and 4(b), respectively.
To verify the applicability of the stability tools to these separated flows, it is necessary to check whether the boundary layer is convectively unstable. The reverse flow magnitude within the separation bubble can be considered as an indicator. The maximum reverse flow magnitude for each streamwise location is plotted (dashed line) in the region around the separation bubble for both marginal and large separation cases in figure 5(a,b), where separation (S) and reattachment (R) points are also indicated. The streamwise velocity profiles at different locations are also plotted to show the regions where reverse flow exists (black solid lines). The maximum reverse flow magnitude is 0.06 % for the marginal separation case and 6 % for the large separation case. Following the criterion given by Alam & Sandham (Reference Alam and Sandham2000) and Rist (Reference Rist2004), for which separated boundary layers are absolutely unstable when the maximum reverse flow magnitudes are larger than 20 %, the boundary layers under investigation can be considered almost certainly convectively unstable.
Marginal (a) and large (b) separation cases: streamwise distribution of the maximum reverse flow magnitude (dashed line) and streamwise velocity profiles (black solid lines) in the region around the separation bubble. Separation and reattachment points are indicated with (S) and (R), respectively.

These DNS base flows are used for the LST and LPSE analysis and are interpolated in the wall-normal direction over
 $250$
grid points using the mapping Chebyshev collocation method. For the local LST analysis, the streamwise evolution of the streamwise wavenumber is obtained by repeating the analysis at different
 $x$
locations independently. For the non-local analysis, the streamwise derivatives of the pressure terms are retained and the method is stabilized by choosing a sufficiently large marching integration step
 ${\rm\Delta}x_{PSE}$
. The sensitivity of the LPSE solution to the marching integration step is analysed by using
 ${\rm\Delta}x_{PSE}=3{\it\delta}_{1,0}^{\ast },6{\it\delta}_{1,0}^{\ast },12{\it\delta}_{1,0}^{\ast }$
and
 $24{\it\delta}_{1,0}^{\ast }$
.
While the
 $n$
-factor from the stability analysis methods is calculated as
 $$\begin{eqnarray}n_{LST/LPSE}(x)=-\int _{x=0}^{x}{\it\alpha}_{i}\,\text{d}\tilde{x}=\ln \left(\frac{A}{A_{x=0}}\right),\end{eqnarray}$$
the DNS
 $n$
-factor is defined to be
 $$\begin{eqnarray}n_{DNS}(x)=\ln \left[\frac{A_{DNS}(x)}{A_{DNS}(x=0)}\right],\end{eqnarray}$$
where
 $$\begin{eqnarray}A_{DNS}=\sqrt{\int _{0}^{y_{e}}(|\hat{{\it\rho}}|^{2}+|\hat{u} |^{2}+|\hat{v}|^{2}+|{\hat{w}}|^{2}+|\hat{T}|^{2})\,\text{d}y}.\end{eqnarray}$$
The integration is evaluated between the wall and the edge of the boundary layer (
 $y_{e}$
) using fast Fourier transforms (FFTs) of time series of the primitive variable flow quantities (indicated with the hat symbol). The time series are accumulated over four periods of the forced mode.
3.2 ZPG boundary layer
Modal disturbances, as described in § 2.3, are applied at the inlet to force the ZPG boundary layer, and the temporal stability map reported in figure 3(a) is used to select the modes of interest. A 2D wave (
 ${\it\alpha}=0.240$
,
 ${\it\beta}=0.00$
and
 ${\it\omega}=0.124$
) and a 3D one (
 ${\it\alpha}=0.240$
,
 ${\it\beta}=0.140$
and
 ${\it\omega}=0.123$
) are chosen and the domain spanwise width is therefore fixed to
 $L_{z}={\it\lambda}_{z}=2{\rm\pi}/{\it\beta}=44.9$
.
Streamwise evolution of the maximum
 $n$
-factor for a 2D (a) and 3D (b) mode. Comparison between DNS (circles), LST (dashed line) and LPSE (solid line with error bars).

Figure 6 shows the streamwise evolution of the maximum
 $n$
-factors for the 2D (a) and the 3D (b) waves calculated from DNS (circles), LST (dashed line) and LPSE (solid line with error bars showing the standard deviation of the variations due to the integration step size sensitivity). The modes selected are unstable at the inlet and initially grow, but they become stable and decay further downstream. While it is clear that the LST suffers because of the non-parallelism of the base flow, very good agreement is obtained between DNS and LPSE for both regions of the flow when the disturbances grow and decay.
3.3 Shock-induced separated boundary layer
The same 2D and 3D waves used for the validation of the LPSE tool on the ZPG non-parallel boundary layer are selected to force the marginal and large separation cases and modal forcing is applied at the inlet. With
 ${\it\beta}=0.14$
, the spanwise width of the numerical domain is again
 $L_{z}=44.9$
. Similarly to the previous case, the streamwise evolution of the
 $n$
-factors for the 2D and 3D waves calculated from DNS (circles) are compared with the predictions of LST (dashed line) and LPSE (solid line) and reported in figure 7(a,b) for the marginal separation case, and in figure 7(c,d) for the large separation case. The effect of the integration step size on the LPSE growth rates is represented by the error bars, which indicate the mean standard deviation. It is interesting to see that, for both 2D and 3D waves, the LPSE tool is able to accurately reproduce the disturbance growth rates when the boundary layer is marginally separated. When the shock strength increases and a large separation occurs, the LPSE tool agrees very well with the DNS for the 2D wave but is less accurate when a 3D wave is considered. In this case, the errors accumulate in the streamwise direction and lead to a disagreement in the second half of the bubble. Differently from what was observed by Hein (Reference Hein2005), the growth at the separation point is still well predicted and deviates only when the reverse flow is stronger. On the other hand, LST suffers due to the non-parallelism of the base flows; nevertheless the disturbance growth rates do not differ excessively from DNS or LPSE. For example, if we consider the large separation case, where the growth rates are high, the maximum relative error between DNS and LST is only approximately 11 %. For the marginal separation case the relative error is bigger, but only because small growth of the disturbances is observed.
Streamwise evolution of the
 $n$
-factor for 2D (a,c) and 3D (b,d) modes for the marginal separation (a,b) and large separation (c,d) cases. Comparison between DNS (circles), LST (dashed line) and LPSE (black line with error bars).

As highlighted in § 2.3, it is important to note that the previously selected waves are unstable at the inlet and that, in the presence of separation, different modes become unstable. The comparison between DNS, LST and LPSE is therefore repeated for the large separation case by considering a 2D wave that corresponds to
 ${\it\alpha}=0.200$
,
 ${\it\beta}=0.000$
and
 ${\it\omega}=0.098$
and a 3D wave with
 ${\it\alpha}=0.200$
,
 ${\it\beta}=0.230$
and
 ${\it\omega}=0.101$
. Thus, the spanwise width of the numerical domain is now
 $L_{z}=27.3$
. In figure 8(a,b) the streamwise evolutions of the 2D and 3D waves in the separated boundary layer are plotted for DNS (circles), LST (dashed line) and LPSE (solid line with error bars). It is important to note that this set of unstable modes within the separation bubble reaches higher
 $n$
-factors with respect to the set of unstable modes at the inlet, confirming that the separation bubble acts like a spatial filter–amplifier. It appears again that the LPSE tool struggles to represent the growth of the 3D wave in the streamwise direction when strong reverse flow is present. In this case, the LPSE calculations have been performed by neglecting the
 $\partial p/\partial x$
terms in order to stabilize the code, and a higher sensitivity to the integration step size is found as shown by the increase in the error bars. Similarly to Pagella et al. (Reference Pagella, Babucke and Rist2004), LST still does not match DNS but is not excessively inaccurate, with a maximum relative error of 15 %.
Streamwise evolution of the
 $n$
-factor for a 2D (a) and 3D (b) mode for the large separation bubble case and modes calculated at
 $Re_{x}=1.31\times 10^{5}$
. Comparison between DNS (circles), LST (dashed line) and LPSE (solid line with error bars).

Time- and span-averaged (black solid line) and instantaneous span-averaged (light grey solid line) skin friction distributions of the 3D forced SWBLI configuration. Laminar (Eckert Reference Eckert1955) (black dashed line), turbulent (Young Reference Young1989) (black dash-dotted line) and 2D base flow (dark grey solid line) skin friction distributions are also plotted for reference.

4 Low-frequency unsteadiness for the large separation case
The large separation case is extruded in the spanwise direction and the resulting 3D base flow is selected to investigate the existence of a low-frequency unsteadiness. Modal forcing is applied at the inlet, as shown in § 2.3, and breakdown to turbulence is obtained. Before starting the collection of wall-pressure time series for spectral analysis, the 3D-DNS base flow is brought to statistical convergence. Features of the transition process and the main findings of the spectral analysis are discussed.
Transition visualization. (a) Isosurfaces of the wall-normal vorticity for the levels
 ${\it\omega}_{y}=+0.08$
(red) and
 ${\it\omega}_{y}=-0.08$
(black) and coloured with the streamwise velocity. (b) Contours of the streamwise vorticity for
 $z$
–
 $y$
planes at different
 $x$
locations showing the appearance of strong streamwise vortices associated with the oblique-mode breakdown (25 levels between
 ${\it\omega}_{x}=\pm 1$
).

4.1 Breakdown to turbulence
Transition happens in the vicinity of the reattachment point and reduces significantly the separation length as shown by the time- and span-averaged skin friction distributions in figure 9 (black solid line) with respect to the 2D base flow (dark grey solid line). The laminar (black dashed line) and turbulent (black dash-dotted line) boundary-layer solutions by Eckert (Reference Eckert1955) and Young (Reference Young1989), respectively, are also plotted. An instantaneous span-averaged skin friction distribution at the non-dimensional time
 $t=55\,000$
(light grey solid line) is also reported to show the strong unsteady character of the flow near the reattachment point and further downstream. Isosurfaces of the instantaneous wall-normal vorticity are plotted for the levels
 ${\it\omega}_{y}=+0.08$
(red) and
 ${\it\omega}_{y}=-0.08$
(black) and coloured with the streamwise velocity in figure 10(a) to illustrate the breakdown scenario. It is also interesting to see from figure 10(b), where contours of the streamwise vorticity
 ${\it\omega}_{x}$
in
 $z$
–
 $y$
planes are plotted at different streamwise locations, that the oblique-mode transition causes the appearance of strong streamwise vortices (see the
 $z$
–
 $y$
plane at
 $Re_{x}\approx 2.32\times 10^{5}$
) that develop downstream and break down to turbulence. The modes selected to force the separated boundary layer affect the breakdown to turbulence and the separation bubble size. In this case, the symmetric nature of the forcing imposed at the inlet causes the breakdown also to be symmetric in the whole domain except for a small region towards the outlet. Similarly to what was obtained numerically by Nikitin (Reference Nikitin2008) and later experimentally by Borodulin, Kachanov & Roschektayev (Reference Borodulin, Kachanov and Roschektayev2011), the turbulence obtained at the back of the bubble is essentially deterministic turbulence that is reproducible over a period of the forcing frequency. An analogous phenomenon was also seen in the DNS transition study by Sandham & Kleiser (Reference Sandham and Kleiser1992) for a plane channel flow, for which the shear-layer roll-up into discrete vortices was happening while the imposed initial spanwise symmetry was still preserved, defining the process as deterministic rather than triggered by the growth of the random background numerical noise.
Amplitude of the time-transformed Fourier modes of the span-averaged wall-pressure fluctuations,
 $|\mathscr{F}_{t}(p_{w}-\bar{p}_{w})|$
, calculated at the streamwise locations (a)
 $Re_{x}=1.29\times 10^{5}$
, (b)
 $Re_{x}=1.74\times 10^{5}$
, (c)
 $Re_{x}=2.15\times 10^{5}$
and (d)
 $Re_{x}=3.09\times 10^{5}$
.

4.2 Spectral analysis
A spectral analysis is carried out for wall-pressure time series collected over a time period long enough to ensure that the minimum frequency of the spectra is two orders of magnitude smaller than the forcing frequency (
 $f=0.016$
). The time series are recorded over the whole wall plane with
 $16$
samples for each period. The recorded signals are broken into three segments with 50 % overlapping (Welch Reference Welch1967; Hu, Morfey & Sandham Reference Hu, Morfey and Sandham2006). A Strouhal number,
 $St$
, based on the time- and span-averaged separation bubble length
 $L_{SB}=67.8$
(see figure 9), is used to plot the amplitude of the Fourier transform in time of the wall-pressure fluctuations,
 $|\mathscr{F}_{t}(p_{w}-\bar{p}_{w})|$
;
 $St$
is linked to the dimensionless frequency as
 $St=L_{SB}\,f$
. The spectral analysis is performed for each
 $x$
and
 $z$
location on the wall. However, the spectra are found to be unaffected by the spanwise position, except for the
 $z$
locations corresponding to the zero node of the spanwise modulation applied to the forcing, i.e. at
 $z=L_{z}/4$
and
 $3L_{z}/4$
. Thus, the wall-pressure time series at each streamwise location can be span-averaged before the calculation of the spectra. Figure 11 shows the
 $|\mathscr{F}_{t}(p_{w}-\bar{p}_{w})|$
frequency distribution at different streamwise locations moving from the inlet towards the outlet, chosen as (a) upstream of the separation point and at the beginning of the interaction region at
 $Re_{x}=1.29\times 10^{5}$
, (b) at the separation point
 $Re_{x}=1.74\times 10^{5}$
, (c) at the reattachment point
 $Re_{x}=2.15\times 10^{5}$
and (d) in the turbulent region at
 $Re_{x}=3.09\times 10^{5}$
. Each location shows a narrow peak at
 $St=1.091$
that corresponds to the applied forcing. This causes the appearance of higher harmonics, visible as narrow peaks at multiples of the forcing Strouhal number. It is interesting to see from figure 11 that a low-frequency broadband peak appears. The low-frequency unsteadiness starts to become energetically significant at the beginning of the interaction region (figure 11
b). The deterministic components associated with the applied forcing cause the rise of the unforced/non-deterministic modes and, moving downstream towards the turbulent region (figure 11
d), the energy content at high frequencies increases, the spectrum flattens out and only the forcing frequency and its harmonics can be distinguished. The spatial extent of the low-frequency broadband peak can be more clearly seen by plotting the contours of the frequency-weighted wall-pressure Fourier modes
 $f\,|\mathscr{F}_{t}(p_{w}-\bar{p}_{w})|$
normalized with its maximum in frequency for each streamwise location as a function of the streamwise location and Strouhal number in figure 12. A broadband peak at frequencies around
 $St=0.04$
is localized just upstream of the separation point, marked by the vertical black dashed line on the figure. This low-frequency broadband peak is located at a Strouhal number that is comparable to the low-frequency unsteadiness found for the turbulent interactions (Dussauge, Dupont & Debiéve Reference Dussauge, Dupont and Debiéve2006; Touber & Sandham Reference Touber and Sandham2009), suggesting a close analogy between the laminar and turbulent cases. However, it is important to note that the mechanism producing the low-frequency unsteadiness in the laminar case yields only very low amplitude levels, whereas in the turbulent case both the background disturbances and the low-frequency response are large.
From the results shown in figures 11 and 12, it is now possible to identify the origin of the low-frequency unsteadiness in the breakdown of deterministic turbulence, which creates a broadband white noise spectrum (zero slope in figure 11
d) downstream of the reattachment. Similarly to the 2D interaction presented in Sansica et al. (Reference Sansica, Sandham and Hu2014), where the low frequency was explicitly forced with white noise, these disturbances can travel upstream in the subsonic region of the boundary layer and the low-frequency unsteadiness becomes relatively more significant just upstream of the separation point. The presence of upstream-travelling disturbances is demonstrated in figure 13, where the Strouhal number/streamwise wavenumber spectrum calculated in the streamwise range
 $Re_{x}=(1.00{-}2.88)\times 10^{5}$
is presented. For positive values of
 ${\it\alpha}$
, the amplitude of the double Fourier transform in space and time of the span-averaged wall-pressure fluctuations shows the deterministic downstream-travelling component of the forcing at
 $({\it\alpha},St)=(0.200,1.091)$
and its first harmonic. The upstream-travelling disturbances are visible for negative values of
 ${\it\alpha}$
, where a straight line with constant phase speed
 $c_{ph}\approx -0.6$
stretches from low to high frequencies. Considering the near-zero velocity of the flow within the separation bubble, this value is very close to the speed of an upstream-travelling acoustic wave at
 $M=1.5$
, suggesting the acoustic nature of the waves responsible for the appearance of the low-frequency unsteadiness.
Contours of
 $f\,|\mathscr{F}_{t}(p_{w}-\bar{p}_{w})|$
normalized with its maximum in frequency for each streamwise location as a function of the streamwise location and Strouhal number. Contour levels are set on a logarithmic scale between
 $10^{-11}$
and
 $10^{-7}$
. The vertical black dashed line indicates the streamwise location of the separation point.

Strouhal number/streamwise wavenumber spectrum. The amplitude of the double Fourier transform in space and time of the span-averaged wall-pressure fluctuations shows the deterministic downstream-travelling components and upstream-travelling waves. The black dashed line indicates zero values of
 ${\it\alpha}$
.

4.2.1 Low-frequency unsteadiness sensitivity
The low-frequency energy content that arises from the broadband white noise created by the breakdown of the deterministic turbulence is at very low amplitudes and might be sensitive to the numerical details of the simulation. Here, grid resolution and domain size (to study the influence of outflow and free-stream boundaries) are considered as the two major parameters that can affect the response of the separated region.
A grid resolution study is carried out on the 3D base flow configuration for a grid that was coarsened by a factor of 2 in all three directions. The time- and span-averaged skin friction distributions for the coarse and fine grid cases are in good agreement and the fine grid is therefore considered suitable for the present study (Sansica Reference Sansica2015). This base flow is used here to repeat the spectral analysis previously presented, and the amplitude of the Fourier transform in time of the wall-pressure fluctuations,
 $|\mathscr{F}_{t}(p_{w}-\bar{p}_{w})|$
, is reported for different
 $x$
locations in figure 14 (black line). Using the same resolution, an additional simulation was performed with the domain increased in height by
 $20{\it\delta}_{1,0}^{\ast }$
and in length by
 $30{\it\delta}_{1,0}^{\ast }$
further downstream. The spectral analysis relative to this enlarged numerical domain is also presented in figure 14 (light grey line).
Grid resolution and domain size sensitivity. Amplitude of the Fourier transform in time of the wall-pressure fluctuations,
 $|\mathscr{F}_{t}(p_{w}-\bar{p}_{w})|$
, calculated from span-averaged wall-pressure time series at the streamwise locations (a)
 $Re_{x}=1.29\times 10^{5}$
, (b)
 $Re_{x}=1.74\times 10^{5}$
, (c)
 $Re_{x}=2.15\times 10^{5}$
and (d)
 $Re_{x}=3.09\times 10^{5}$
. Fine grid (dark grey line; the lowest curve in each case), coarse grid (black line) and coarse grid with enlarged domain (light grey line).

The low-frequency response of the separation bubble still exists and arises from the broadband numerical white noise. However, it is interesting to see the sensitivity of the energy content for both low-frequency and non-deterministic parts of the spectra, which increase both for the coarse grid and coarse grid enlarged domain cases with respect to the fine grid simulation (dark grey line). This is because the numerical background noise generated by the coarse grid is higher, as is visible upstream of the separation point (figure 14 a) where the non-deterministic part of the spectra at high frequencies reaches an amplitude approximately three orders of magnitude larger than the fine grid case. However, the energy of the low-frequency broadband peak only increases by one order of magnitude. This observation again links the low-frequency unsteadiness with the broadband white noise spectrum created by the breakdown to turbulence that also increases by approximately one order of magnitude (figure 14 d). This is also true for the coarse grid enlarged domain case, where, despite some small differences in the amplitude of the non-deterministic white noise component due to the influence of the outflow boundary, the energy level of the low frequency is practically unchanged. It could be argued that the low frequency could be reduced by further refining the numerical grid, but the existence of broadband white noise will always be present in real-world applications (i.e. noise generated by wind tunnel walls, free-stream turbulence, etc.) and contribute to the appearance of the unsteadiness.
This analysis shows that different types of broadband perturbations can produce the low-frequency unsteadiness, as already shown in Sansica et al. (Reference Sansica, Sandham and Hu2014). While in that case an energetically higher low-frequency response was obtained by explicitly forcing the low-frequency unsteadiness with random white noise, here the unsteadiness is indirectly created by the breakdown of the deterministic turbulence.
5 Conclusions
It has been shown that low-frequency unsteadiness exists in an oblique shock wave–laminar boundary layer interaction, analogous to the phenomenon that is known for turbulent interactions. A 3D laminar shock-induced separation bubble is forced at the inlet with a pair of oblique unstable eigenmodes calculated by local linear stability theory within the separation bubble. Despite the strongly non-parallel nature of the flow, linear stability analysis is shown to reproduce with reasonable accuracy the growth of 2D and 3D waves when applied to marginal and relatively large separated cases. LPSE showed good accuracy in the prediction of modal growth with respect to DNS, apart from minor differences seen in the second half of the separation bubble due to the error accumulation in the streamwise marching integration procedure. The non-parallelism of the configurations studied led to the LST approach giving larger errors (approximately 15 %) but still representing a remarkable accuracy considering its low computational cost. The modes selected to force the 3D laminar separation bubble have higher frequencies with respect to the unsteadiness of interest and only indirectly affect the low-frequency energy content of the interaction region. Whereas in Sansica et al. (Reference Sansica, Sandham and Hu2014) the low-frequency response was explicitly forced, here it develops as a consequence of the transition process. Oblique-mode transition occurs near the reattachment point and the breakdown of deterministic turbulence fills up the spectrum. This causes the appearance of a low-frequency broadband peak near the separation point via nonlinear contributions that travel upstream in the subsonic region of the boundary layer. A frequency/wavenumber analysis suggests the acoustic nature of the upstream-travelling waves. A sensitivity study showed that the energy of the unsteadiness is influenced by grid resolution and domain size but its existence is confirmed. The separation bubble acts as a low-pass spatial amplification filter and does not need an upstream low-frequency spectral content as a precondition for the low-frequency unsteadiness seen in shock wave–boundary layer interactions.
Acknowledgements
This work is supported through the European Union (EU) FP7 project TFAST. Computer time is provided by UK Turbulence Consortium under grant EP/L000261/1.