Implications
The strong use of artificial selection to increase the frequency of favourable alleles at the loci affecting phenotypic performance (e.g. milk production), coupled with intense selection that featured heavily in some breeds, has resulted in reduced genetic diversity within breed and has affected the extent of genomic homozygosity. In this study high-density genotypic data on a large number of individuals of different breeds was available to make inferences of population structure for the different breeds used in temperate cattle production systems.
Introduction
Domestic cattle (Bos taurus and Bos indicus) originated from populations of the wild extinct aurochs ~10 000 years ago (Diamond, Reference Diamond2002). The complex origins that led to the domestication of the modern cow have led to numerous different cattle breeds specialised for different traits, such as milk and meat products, disease and pest resistance, drafting ability and religious beliefs. The differentiation among breeds is a result of natural selection, geographical variability due to drift, and more recently, strong artificial selection for traits of economic importance. Consequently, modern cattle breeds, of which there are more than 1000 recognised breeds worldwide (Felius, Reference Felius2007), display extensive phenotypic variety depending on the economic and cultural goals.
Pioneering studies have quantified cattle population genetic structure and variation primarily using polymorphic microsatellite markers (MacHugh et al., Reference MacHugh, Shriver, Loftus, Cunningham and Bradley1997; MacHugh et al., Reference MacHugh, Loftus, Cunningham and Bradley1998; Canon et al., Reference Canon, Alexandrino, Bessa, Carleos, Carretero, Dunner, Ferran, Garcia, Jordana, Laloe, Pereira, Sanchez and Moazami-Goudarzi2001; Beja-Pereira et al., Reference Beja-Pereira, Alexandrino, Bessa, Carretero, Dunner, Ferrand, Jordana, Laloe, Moazami-Goudarzi, Sanchez and Canon2003). The advent of affordable high-throughput genotyping technologies (Hayes et al., Reference Hayes, Bowman, Chamberlain and Goddard2009; Calus, Reference Calus2010) can however provide greater insight into the effect of selection on the distribution of genetic variation and evolution of domestic cattle. Because selection alters the allele frequencies of markers that are in close proximity to the selected mutation (Bamshad and Wooding, Reference Bamshad and Wooding2003), the availability of tens of thousands of single nucleotide polymorphism (SNP) information overcomes the previous constraints where only markers of limited density were available. This technology facilitates the detection of breed-specific signatures of selection (Xu et al., Reference Xu, Bickhart, Cole, Schroeder, Song, Tassell, Sonstegard and Liu2015; Zhao et al., Reference Zhao, McParland, Kearney, Du and Berry2015), and can be used to broadly cluster cattle breeds into distinct groups as well as estimate the genetic diversity within and among breeds. Such information may be useful for producers in the design of herd mating programmes, especially those exploiting crossbreeding. Heterosis, which is the added increase in performance when animals are crossbred, is associated with an increase in genomic heterozygosity levels. Therefore, genomic information has the potential to provide more accurate estimates of the breed composition and genomic distance among breeds compared to conventionally recorded pedigree data. Although previous studies have investigated population substructure and genetic diversity using high-density genotype technology (Matukumalli et al., Reference Matukumalli, Lawley, Schnabel, Taylor, Allan, Heaton, O’Connell, Moore, Smith, Sonstegard and Van Tassell2009; Decker et al., Reference Decker, McKay, Rolf, Kim, Molina Alcalá, Sonstegard, Hanotte, Götherström, Seabury, Praharani, Babar, Correia de Almeida Regitano, Yildiz, Heaton, Liu, Lei, Reecy, Saif-Ur-Rehman, Schnabel and Taylor2014; Edea et al., Reference Edea, Bhuiyan, Dessie, Rothschild, Dadi and Kim2015), larger sample sizes per population may be required to demonstrate more confidence in the inferences made (Pruett and Winker, Reference Pruett and Winker2008).
The objective of the present study was to differentiate a population of dairy and beef purebred cattle used in Ireland into different strata of breeds using high-density SNP data on a large number of individuals. All individuals were sires used in either commercial artificial insemination programmes or natural mating bulls in Ireland and are therefore representative of germplasm used in Irish dairy and beef breeding programmes.
Material and methods
Genotypic data
Illumina high-density genotypes (777 962 SNPs) were available on 4623 purebred artificial insemination and natural service bulls of different breeds used in Ireland; the exception was the Holstein and Friesian breeds which were grouped as Holstein-Friesian with animal ‘breed’ in the present study dictated by the recorded major breed proportion. All animals had a genotype call rate of >0.95. Breed composition of all animals for K ancestral populations was verified using the ADMIXTURE 1.23 software (Alexander et al., Reference Alexander, Novembre and Lange2009). An unsupervised ADMIXTURE analysis was used to estimate individual admixture proportions from the SNP data using a maximum likelihood method without prior information of individual ancestry. The programme ran for 38 iterations with a specified number of clusters (K=10) assumed to reflect the major genetic components of the data set. Breeds represented included Angus (n=430), Belgian Blue (n=298), Charolais (n=893), Friesian (n=174), Hereford (n=327), Holstein (n=1087), Jersey (n=75), Limousin (n=943), Montbéliarde (n=33) and Simmental (n=363) bulls; all animals with the exception of Holstein and Friesian were predicted to be >87.5% pure. The pedigree of all animals was traced back to founder animals. Mendelian inconsistencies were used to validate animal identification through parentage assessment but also to discard autosomal SNPs that did not adhere to Mendelian inheritance. SNPs with <0.02 minor allele frequency and SNPs that deviated from Hardy–Weinberg equilibrium (P<1×10⁻⁹) within breed were also discarded. After edits a total of 624 179 autosomal SNPs remained.
Analysis
Effective population size
For data quality control, the effective population size was investigated using the SNeP tool described by Barbato et al. (Reference Barbato, Orozco-terWengel, Tapio and Bruford2015). The method examines the relationship between the variance in linkage disequilibrium and effective population size in the presence of mutation.
 $$N_{{T\left( T \right)}} \,{\equals}\,\left{\bigg(} {4f\left( {c_{(t)} } \right)^{{{\minus}1}} } \right\left({E\left[ {r^{\mid {c{t}}}_{{adj}}} \right]^{{{\minus}1}} {\minus}\alpha } {\bigg)}\right)$$
where N
T
is the effective population size T generations ago calculated as
 $$T\,{\equals}\,2f(c_{(t)} )^{{{\minus}1}} $$
(Hayes et al., Reference Hayes, Visscher, McPartlan and Goddard2003), c
t
the recombination rate for specific physical distance between markers calculated by the SNeP tool using default values, r
adj
the linkage disequilibrium value adjusted for sample size, and α={1, 2, 2.2} is the correction for the occurrence of mutation (Ohta and Kimura, Reference Ohta and Kimura1971).
Principal component analysis
Population substructure for all animals was determined using principal component analysis (PCA) in the EIGENSOFT package (Price et al., Reference Price, Patterson, Plenge, Weinblatt, Shadick and Reich2006). This algorithm uses a computationally efficient variant of eigenanalysis to determine the probability of population substructure according to Tracy–Widom distribution. The Tracy–Widom distribution describes the density of the largest eigenvalue of a random Hermitian matrix (Tracy and Widom, Reference Tracy and Widom2009). It is assumed that nonzero eigenvalues of the matrix are within the Tracy–Widom distribution and was used in the present study to test the statistical significance of whether an eigenvector was a significant principal component or not of the matrix (Patterson et al., Reference Patterson, Price and Reich2006). PCA plots were constructed using the first four components from the analysis.
Genetic diversity
Genetic diversity analyses were performed using PLINK v1.07 software (Purcell et al., Reference Purcell, Neale, Todd-Brown, Thomas, Ferreira, Bender, Maller, Sklar, de Bakker, Daly and Sham2007). For each population, genetic diversity was measured as the observed heterozygosity (HO) averaged over loci, and the expected heterozygosity (HE) under the assumptions of Hardy–Weinberg equilibrium. Expected heterozygosity was calculated using the following equation:
 $$H_{E} {\equals}{{\mathop{\sum}\nolimits_{k\,{\equals}\,1}^r {h_{k} } } \over r}$$
where
 $$h_{k} {\equals}{{2n\left( {1{\minus}\mathop{\sum}{x_{i}^{2} } } \right)} \over {\left( {2n\,{\minus}\,1} \right)}}$$
where h k is the population heterozygosity at the kth locus, r the total number of loci studied, n the number of individuals per locus, and x i the frequency of the ith allele at locus x in a sample population n (Nei, Reference Nei1978). Genomic inbreeding coefficients (F) were computed based on the observed v. the expected number of homozygous genotypes (Purcell et al., Reference Purcell, Neale, Todd-Brown, Thomas, Ferreira, Bender, Maller, Sklar, de Bakker, Daly and Sham2007):
 $$F\,{\equals}\,f_{i} {\plus}\left( {1{\minus}f_{i} } \right)\left( {p^{2} {\plus}q^{2} } \right)$$
where fi is the probability that individual i is homozygous by decent, (1−fi ) is the probability that individual i is homozygous by chance, for a particular SNP with known allele frequencies p and q (Purcell et al., Reference Purcell, Neale, Todd-Brown, Thomas, Ferreira, Bender, Maller, Sklar, de Bakker, Daly and Sham2007). Pedigree-based inbreeding coefficients for each animal were also estimated using the Meuwissen and Luo (Reference Meuwissen and Luo1992) algorithm as described by McParland et al. (Reference McParland, Kearney, Rath and Berry2007b) where the pedigree was traced back to the founders.
The pair-wise genetic differentiation among breeds was calculated using the F st statistic. The F st was calculated as:
 $$F_{{{\rm st}}} \,{\equals}\,{{s^{2} } \over {\bar{p}(1\,{\minus}\,\bar{p})}}$$
where s
2 is the variance of allele frequency among breeds and
 $\tf="Frutiger_condfont_roman" {\bar p}$
the mean allele frequency across breed (Weir and Cockerham, Reference Weir and Cockerham1984). A phylogenetic tree was computed based on the breed pair-wise F
st using the APE package in R software (Paradis et al., Reference Paradis, Claude and Strimmer2004). The software provides functions to estimate phylogenetic trees with distance-based DNA information to facilitate comparative and diversification analyses.
The within-breed allele frequencies for each SNP were calculated as pair-wise breed correlations of the allele frequencies per SNP (Kuehn et al., Reference Kuehn, Keele, Bennett, McDaneld, Smith, Snelling, Sonstegard and Thallman2011). The delta value (Δ ij ) was calculated as the breed pair-wise absolute differences in allele frequency (p A ) between each population i and j, averaged over n SNPs:
 $$\Delta _{{ij}} \,{\equals}\,{{\mathop{\sum}{\left| {p_{{A_{i} }} \,{\minus}\,\left. {p_{{A_{j} }} } \right|} \right.} } \over n}$$
Results and discussion
Knowledge of the genomic distance between cattle breeds is particularly useful in the identification of distinct cattle breeds that might be exploited to maximise heterosis in crossbreeding programmes. The primary rationale for adopting a crossbreeding strategy is the enhanced phenotypic performance observed in the crossbred offspring, relative to their parental mean performance. The superior performance accruing from heterosis is attributable to the increased genomic heterozygosity due to the crossing of different breeds (Falconer and Mackay, Reference Falconer and Mackay1996). Although pure-breeding in dairy has traditionally dominated, results from our study reveal that the effective population size has rapidly decreased in recent years (Supplementary Figure S1) which is in agreement with previous studies in international dairy populations (de Roos et al., Reference De Roos, Hayes, Spelman and Goddard2008; Gibbs et al., Reference Gibbs, Taylor, van Tassell, Barendse, Eversole, Gill, Green, Hamernik, Kappes, Lien, Matukumalli, McEwan, Nazareth, Schnabel, Weinstock, Wheeler, Ajmone-Marsan, Boettcher, Caetano, Garcia, Hanotte, Mariani, Skow, Sonstegard, Williams, Diallo, Hailemariam, Martinez, Morris, Silva, Spelman, Mulatu, Zhao, Abbey, Agaba, Araujo, Bunch, Burton, Gorni, Olivier, Harrison, Luff, Machado, Mwakaya, Plastow, Sim, Smith, Thomas, Valentini, Williams, Womack, Woolliams, Liu, Qin, Worley, Gao, Jiang, Moore, Ren, Song, Bustamante, Hernandez, Muzny, Patil, San Lucas, Fu, Kent, Vega, Matukumalli, McWilliam, Sclep, Bryc, Choi, Gao, Grefenstette, Murdoch, Stella, Villa-Angulo, Wright, Aerts, Jann, Negrini, Goddard, Hayes, Bradley, Barbosa da Silva, Lau, Liu, Lynn, Panzitta and Dodds2009). Preliminary analyses revealed little genomic contribution from the founder animals; the standard deviation in genomic relationships varied from 0.035 (Limousin) to 0.150 (Holstein). The observed pattern in effective population size is possibly due to bottlenecks associated with intense selection and domestication (de Roos et al., Reference De Roos, Hayes, Spelman and Goddard2008) thereby intensifying the interest in crossbreeding strategies internationally (e.g. Sørensen et al., Reference Sørensen, Norberg, Pedersen and Christensen2008; Buckley et al., Reference Buckley, Lopez-Villalobos and Heins2014; LIC, 2015). Beef production, on the contrary, has had a strong tradition of crossbreeding in many countries (Kahn and Cottle, Reference Kahn and Cottle2014). For example, Williams et al. (Reference Williams, Aguilar, Rekaya and Bertrand2010) reported individual heterosis estimates ranging between 0.63 kg (Continental×Continental) to 2.43 kg (British×Zebu), 3.47 kg (Continental×Continental) to 25.93 kg (Continental×Zebu), and 1.49 kg (Continental×Zebu) to 14.68 kg (British×Zebu), for increased birth weight, weaning weight, and post weaning BW gain in beef populations, respectively. The greater the genetic distance between breeds, the greater, on average, the extent of heterosis observed (Ehiobu et al., Reference Ehiobu, Goddard and Taylor1990). Therefore, further investigation into the genomic differences between breeds is a very pertinent and relevant question in aiding the decision on what breeds to include in a crossbreeding strategy. This is especially true where breed effective population sizes have undergone rapid reductions possibly due to intense within breed selection.
Principal component analysis
PCA is based on a mathematical algorithm that reduces the dimensionality of the number of possibly correlated variables (e.g. SNPs) into a fewer number of uncorrelated variables (i.e. principal components), while retaining most of the variability in the data set under investigation (Jolliffe, Reference Jolliffe2002). Principal component analysis has previously been used to visualise the genomic relationships among cattle breeds (Gautier et al., Reference Gautier, Laloë and Moazami-Goudarzi2010; Lewis et al., Reference Lewis, Abas, Dadousis, Lykidis, Paschou and Drineas2011; Harris et al., Reference Harris, Winkelman and Johnson2014; Edea et al., Reference Edea, Bhuiyan, Dessie, Rothschild, Dadi and Kim2015).
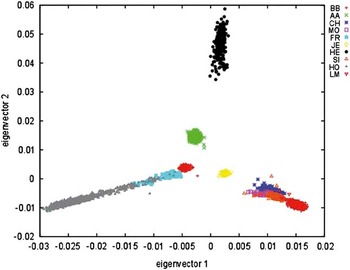
The principal component analysis in the present study was successful in separating out breed clusters based on the genotypic data. The first and second principal components accounted for 37.20% and 27.22% of the variation, respectively (Figure 1). The third and fourth principal components accounted for 21.10% and 14.48% of the variation, respectively. Pair-wise plots (Supplementary Figure S2) and the cumulative proportion of variance (Supplementary Figure S3) were plotted for each principal component.
Principal component analysis of the purebred animals (AA=Angus; BB=Belgian Blue; CH=Charolais; FR=Friesian; HE=Hereford; HO=Holstein; JE=Jersey; LM=Limousin; MO=Montbéliarde; SM=Simmental) distributed across the first two principal components explaining 64.42% of the variation.

PCA revealed that the three cattle breeds, Angus, Jersey and Hereford formed clear, non-overlapping clusters that represented separate populations. The first principal component depicted a distinct pattern of separation between these British Isle breeds and the remaining breeds in the study. The original stock of (Aberdeen) Angus developed from native polled and predominately black cattle of remote counties of Aberdeenshire and Angus in Northeast Scotland in the early 19th century (http://www.ansi.okstate.edu/breeds/cattle). The Jersey breed originated from Jersey Island in the English Channel off the coast of France. Effectively, the Jersey breed has developed in genetic isolation due to strict importing and breeding practices for over 200 years (MacHugh et al., Reference MacHugh, Shriver, Loftus, Cunningham and Bradley1997). The Hereford breed is an older breed than the Angus and Jersey, and formed in the 18th century in county Herefordshire in England. At this time, there was a growing food demand owing to the British Industrial Revolution which resulted in farmers selecting for high carcass yield and efficiency of production from grass and grain. The original Hereford was a much larger animal (i.e. mature bull weight of 1300 kg or more) than the modern Hereford today but gradually reduced in size in order to prioritise meat eating quality (http://www.ansi.okstate.edu/breeds/cattle). The second principal component axis of the PCA analysis revealed a clear distance between the Hereford and the other British Isle breeds as well as all other breeds in the current study. These results corroborate MacHugh et al. (Reference MacHugh, Loftus, Bradley, Sharp and Cunningham1994) in that the Hereford does not exhibit a great deal of affinity to other breeds and may be as a result of northern Europe influence before the establishment of the breed in the mid-19th century.
The Holstein-Friesian and Belgian Blue populations each formed distinct clusters but were in close proximity to each other, with some Friesian individuals positioned within the Holstein breed cluster. The Holstein and Friesian clusters were widely distributed along the first principal component and were overlapping, characterising the relatedness between these dairy black and white breeds. The genetic similarity between these two breeds is in agreement with previous studies (Harris et al., Reference Harris, Winkelman and Johnson2014; Kim and Rothschild, Reference Kim and Rothschild2014). Both breeds originated from two Northern provinces, North Holland and West Friesland, in the Netherlands which are located on either side of the shallow bay of the Zuider Zee (Del Bo et al., Reference Del Bo, Polli, Longeri, Ceriotti, Looft, Barre-Dirie, Dolf and Zanotti2001). Approximately 2000 years ago the original black and white cattle were bred to generate the high producing Holstein-Friesian. The differences between the Holstein and Friesian became prominent as a consequence of differing selection objectives and the subsequent ban on importations of livestock in the late-19th century as a precaution against the outbreak of Foot and Mouth in Europe. For instance, the North American Holstein was established when Holstein-Friesians were exported from the Netherlands into the United States in the mid-19th century (Porter, Reference Porter1991). Intense selection for high milk yield to satisfy the growing market demands has resulted in the separation of the original Holstein-Friesian into Holstein and Friesian. The Friesian, primarily residing in United Kingdom, the Netherlands and New Zealand, was selected as a dual purpose breed and tends to be of smaller stature, of better carcass conformation and produce less milk compared to the Holstein (Harris and Kolver, Reference Harris and Kolver2001; Horan et al., Reference Horan, Dillon, Faverdin, Delaby, Buckley and Rath2005). There was some degree of overlap between the Holstein and Friesian in the PCA. The pedigree-based and genotype-based information for assignment of breed for these animals were, however, not always in agreement, as depicted by overlapping clusters between both breeds on both principal component axes. This may be as a result of errors in differentiation of breed at the time of registration of the animal (i.e. Holstein and Friesian animals look very similar) but also due to the difficulty arising from accurately identifying the primary breed of the animal since Mendelian sampling during meiosis can influence what proportion of each breed of a crossbred parent has been inherited. The Belgian Blue cluster resided in close proximity to the Friesian on the PCA plot. The Belgian Blue may share common ancestry to the Friesian as a result of the crossing of Dutch Black Pied (which are similar to Friesian) and Shorthorn (Blott et al., Reference Blott, Williams and Haley1998). The Belgian Blue breed is well known for their exceptional muscular development. Originally, the breed was selected as a dual purpose breed. Selection for increased muscular hypertrophy intensified as a result of premiums paid for double-muscled carcasses. The uptake in use of artificial insemination also contributed to the fixation of the breed’s defining features in less than 20 years, between the 1960s and 1980s.
The French and Swiss breeds, Limousin, Charolais, Simmental and Montbéliarde formed clusters in close proximity and overlapping with each other on the first two principal components (Figure 1). However the third principal component clearly shows that the Charolais does not overlap with the remaining French and Swiss breeds (Supplementary Figure S2) similar to that documented by Lewis et al. (Reference Lewis, Abas, Dadousis, Lykidis, Paschou and Drineas2011). The establishment of both the Limousin and Charolais breeds is not known, but thought to have occurred centuries ago, in relatively isolated parts of central and southwest France which reduced genetic interference from other cattle breeds. The Simmental is also thought to be amongst the oldest and most widely distributed of breeds worldwide. These dual purpose red and white cattle originated from western Switzerland (http://www.ansi.okstate.edu/breeds/breeds/cattle). The Montbéliarde breed (also known as the French Dairy Simmental) bears a close visual resemblance and coat markings to that of the Simmental. The Montbéliarde originated in a neighbouring region to the Simmental, in the Haute Saône-Doubs region of east France. Overall, the continental breeds appear to have some similarities in their gene pools and may be a result of several factors such as less intensive selection, absence of geographic barriers, and increased admixture over the years.
Heterozygosity
Heterozygosity is a measure of genetic diversity and is sensitive to the frequency of alleles (Hawksworth, Reference Hawksworth1995). The observed heterozygosity is the observed occurrence of heterozygous individuals (at a locus). The expected heterozygosity, on the other hand, is the expected heterozygosity level under random mating conditions (Melka and Schenkel, Reference Melka and Schenkel2012). Similar observed and expected heterozygosity (HO=0.379 and HE=0.381, respectively) for all SNPs were estimated in the present study, corroborating previously documented statistics in similar breeds where SNP average heterozygosity values were estimated as 0.30, 0.30 and 0.38 (Matukumalli et al., Reference Matukumalli, Lawley, Schnabel, Taylor, Allan, Heaton, O’Connell, Moore, Smith, Sonstegard and Van Tassell2009; Gautier et al., Reference Gautier, Laloë and Moazami-Goudarzi2010; Melka and Schenkel, Reference Melka and Schenkel2012, respectively). Greater levels of heterozygosity indicate that the population in question could have greater adaptive genetic variation and fitness in comparison to populations of lower levels of heterozygosity. The heterozygosity statistics however reported in the present study, and elsewhere, must take cognisance of the selection of SNPs for inclusion in the SNP arrays and thus the associated ascertainment bias. Only a small number of individuals from a selected population are used to develop the SNP array panels, and therefore may not be representative of other populations (Matukumalli et al., Reference Matukumalli, Lawley, Schnabel, Taylor, Allan, Heaton, O’Connell, Moore, Smith, Sonstegard and Van Tassell2009; Albrechtsen et al., Reference Albrechtsen, Nielsen and Nielsen2010). Although only European breeds were considered in the present study, not all breed sequences are represented on the SNP arrays used and therefore may underestimate genetic diversity differences between breeds to make breeds appear more homogeneous or more different from each other than they really are.
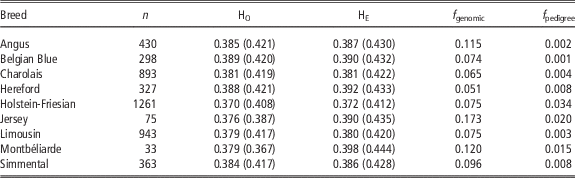
Across all breeds, the differences between the observed heterozygosity and expected heterozygosity values were either nominally smaller or not different at all from the expected values (χ 2=0.0015, P>0.05; Table 1). Montbéliarde had the greatest difference between the observed and expected heterozygosity values, albeit the observed differences may be an artefact of the small sample size (n=33) in the present study (Pruett and Winker, Reference Pruett and Winker2008). The Belgian Blue population had the greatest mean heterozygosity of all breeds (HO=0.389) while the Holstein-Friesian population had the lowest mean heterozygosity (HO=0.370). Globally, the dairy breeding objective for Holstein-Friesians focussed traditionally on a narrow selection of elite sires propagated throughout the world (Miglior et al., Reference Miglior, Muir and Van Doormaal2005). The loss of genetic diversity (i.e. high genetic uniformity), as well as economic concerns associated with compromised long-term biological functionality of breeds are a real concern particularly with the use of advanced reproductive technologies that may accelerate the problem further (Thompson et al., Reference Thompson, Everett and Hammerschmidt2000). Genetic uniformity reduces the fitness and sustainability of breeds because individuals have a reduced ability to react to perturbations such as climate change (Kristensen et al., Reference Kristensen, Hoffmann, Pertoldi and Stronen2015).
Number of animals, mean (median in parentheses) observed heterozygosity (HO), mean (median in parentheses) expected heterozygosity (HE), as well as the mean genomic (f genomic) and pedigree inbreeding (f pedigree) coefficients of each breed

Inbreeding
Mean genomic-based inbreeding and mean pedigree-based inbreeding of each breed is in Table 1. The level of genomic inbreeding ranged from 0% and 36% across all breeds. Median genomic inbreeding estimates per breed were greatest for Jersey (f genomic=0.173) and least for Hereford (f genomic=0.051). A weak spearman correlation (r=0.171; P<0.001) existed between the genomic-based and pedigree-based inbreeding coefficients. The intercept (0.074; SE=0.0005) of the regression of the genomic inbreeding coefficient on the pedigree inbreeding coefficient was greater than zero suggesting that the pedigree inbreeding coefficient may be underestimating the true level of inbreeding by ~7 percentage units. This statistic corroborates similar findings by Purfield et al. (Reference Purfield, Berry, McParland and Bradley2012) where runs of homozygosity (ROH) were used to determine the extent of inbreeding within individuals. Purfield et al. (Reference Purfield, Berry, McParland and Bradley2012) documented that the pedigree-based inbreeding coefficient underestimated the genomic inbreeding, as measured by ROH, by ~9 percentage units. Only considered in the present study was actual genomic inbreeding at a global level; it is however possible to quantify locus-specific, or region-specific level of inbreeding (Pryce et al., Reference Pryce, Haile-Mariam, Goddard and Hayes2014).
Inbreeding depression is the opposite of crossbreeding and reduces the phenotypic performance of the inbred offspring as compared to the average of its parents (Weigel, Reference Weigel2001). The rate of inbreeding in Ireland is increasing by 0.10% per annum in dairy populations and up to 0.13% in some beef populations (McParland et al., Reference McParland, Kearney, Rath and Berry2007b). Greater accumulation of inbreeding exacerbates the risk of homozygous recessive deleterious alleles that affect phenotypic performance (Thompson et al., Reference Thompson, Everett and Hammerschmidt2000). Resulting offspring are more susceptible to compromised performance particularly in reproductive ability (Wall et al., Reference Wall, Brotherstone, Kearney, Woolliams and Coffey2005; McParland et al., Reference McParland, Kearney, Rath and Berry2007a) and vigour (Thompson et al., Reference Thompson, Everett and Hammerschmidt2000; Weigel, Reference Weigel2001). The Jersey was the most inbred breed in the present study corroborating results from Stachowicz et al. (Reference Stachowicz, Sargolzaei, Miglior and Schenkel2011) where the percentage inbreeding in the Jersey breed has increased since the 1980s to 14% between the years 2000 and 2007.
Fixation index
The F st is a measure of genetic differentiation, measured as the reduction in heterozygosity of subpopulations relative to the total population (Weir and Hill, Reference Weir and Hill2002). The F st is calculated as the correlation between a pair of random alleles in the subpopulation and randomly sampled alleles from the entire population. Values for F st range between 0 and 1. Low F st values among subpopulations indicate low levels of genetic divergence in the population, where a value of 0 implies no subdivision between the populations. High F st values indicate greater genetic differentiation between subpopulations, implying that individuals within subpopulations are more related to each other compared to individuals between subpopulations. A F st value of 1 indicates complete isolation of the subpopulation from the total population; in other words, the genomic structure of an entire population can be explained by the subpopulation.
The mean F st value across all loci for all individuals in the population was 0.108. This result corroborates similar levels of differentiation between lineages of 0.112 and 0.107 reported in microsatellite marker studies of European cattle by MacHugh et al. (Reference MacHugh, Loftus, Cunningham and Bradley1998) and Kantanen et al. (Reference Kantanen, Olsaker, Holm, Lien, Vilkki, Brusgaard, Eythorsdottir, Danell and Adalsteinsson2000), respectively. McKay et al. (Reference McKay, Schnabel, Murdoch, Matukumalli, Aerts, Coppieters, Crews, Dias Neto, Gill, Gao, Mannen, Wang, Van Tassell, Williams, Taylor and Moore2008) estimated a mean F st value of 0.100 from a whole genome SNP panel of Bos taurus cattle populations. The lower F st for the French and Swiss breeds suggests a greater genetic differentiation within these breeds compared to the other breeds in the study, a conclusion that is supported by the previous genetic differentiation analyses in the present study (Table 1). The high F st for Jersey is further supported by previous studies that have documented a reduced genetic variation in Jersey (MacHugh et al., Reference MacHugh, Loftus, Bradley, Sharp and Cunningham1994; Chikhi et al., Reference Chikhi, Goossens, Treanor and Bruford2004). The positive moderate correlation (r=0.48) between the mean breed F st and mean genomic-based inbreeding values indicates that genetically isolated breeds (i.e. high F st values) are more likely to be more inbred (i.e. high genomic inbreeding coefficient).
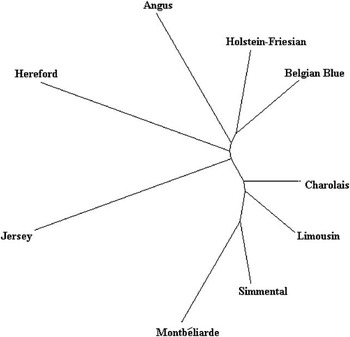
The breed pair-wise F st was used to estimate the degree of population genetic differentiation among breeds (Table 2). The measure of genetic differentiation between breed populations relative to the total population (i.e. pair-wise F st) ranged from 0.049 (Limousin and Charolais) to 0.165 (Jersey and Hereford). The observed genetic distance between the cattle breeds using pair-wise F st estimates is further illustrated in an unrooted phylogenetic tree in Figure 2. Populations originating from the same branch depict closeness in genetic relationships between breeds (i.e. Belgian Blue and Holstein-Friesian; Montbéliarde and Simmental). The French and Swiss breeds (Charolais, Limousin, Montbéliarde and Simmental) resided in close proximity, similar to that seen in Figure 1, suggesting that the location of origin was central in determining relatedness (Gautier et al., Reference Gautier, Laloë and Moazami-Goudarzi2010). The phylogenetic tree complements the PCA (Figure 1). The British Isles breeds (i.e. Angus, Jersey and Hereford) had the longest branches of the phylogeny and appeared quite distinctive from the other breed groups. Although F st values were used on a genome-wide basis in the present study, it is also possible to quantify F st values for each individual locus or genomic region; locus-specific F st values could be useful to make inferences about selection signatures. Zhao et al. (Reference Zhao, McParland, Kearney, Du and Berry2015) used such an approach of using regional F st values on a subset of the data used in the present study and documented 704 individual SNPs suggestive of selection signatures.
Genetic distance between breeds based on pair-wise F st estimates for Irish cattle breeds.

Mean F st values among breeds

In a genome-wide analysis of sheep breeds, Kijas et al. (Reference Kijas, Lenstra, Hayes, Boitard, Porto Neto, San Cristobal, Servin, McCulloch, Whan, Gietzen, Paiva, Barendse, Ciani, Raadsma, McEwan and Dalrymple2012) highlighted that short branches on the phylogenetic tree were associated with greater breed heterozygosity whereas long branches were associated with low breed heterozygosity. The Jersey had the longest and isolated branch from all of the other studied breeds. In general, the phylogenetic tree separated the individuals in the study by geographical origin. Furthermore, breeds that have branched from a common source or breeds in close placement (e.g. the relationship between Holstein-Friesian and the Belgian Blue) depict the admixed nature of populations and closer genomic relationships compared to longer branches that suggest the breed diverged a long time ago (e.g. Hereford). These findings, combined with the PCA results, suggest that breeds of considerable genomic distance have the potential to result in greater levels of heterosis, relative to more related breeds (Ehiobu et al., Reference Ehiobu, Goddard and Taylor1990). For instance, Penasa et al. (Reference Penasa, López-Villalobos, Evans, Cromie, Dal Zotto and Cassandro2010) reported that the first generation Holstein-Jersey crossbred dairy cows yielded 477 kg more milk, 25.3 kg more fat and 17.4 kg more protein, compared to the parental average. However, the heterosis effects for the Holstein-Friesian crossbred were approximately half the size for the Holstein-Jersey crossbreds (Penasa et al., Reference Penasa, López-Villalobos, Evans, Cromie, Dal Zotto and Cassandro2010).
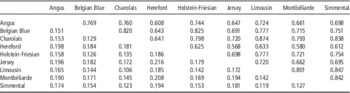
Delta and allele frequency
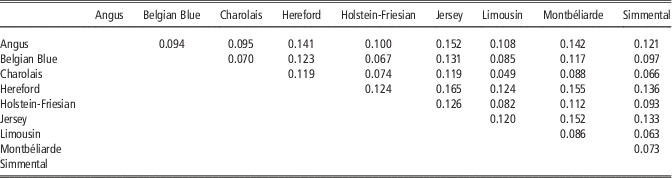
Mean allele frequencies per population can be used as a measure of the genetic diversity. Inferences of the population substructure were similar, irrespective of whether they were based on the delta statistic (Δ) or the correlations between breed pair allele frequencies (r allele; Table 3). The Limousin and Charolais were most similar genetically (Δ=0.106 and r allele=0.874) and the Jersey and Hereford were the most genetically different (Δ=0.216 and r allele=0.568). These findings further corroborate the PCA and the F st results. Breed pairs with a strong interchange of germplasm had a low genetic differentiation and small differences in allele frequencies (i.e. Δ). It is thought that the use of breed herd books over time has accentuated the separation of breeds by reducing the degree of genetic exchange with other breeds (MacHugh et al., Reference MacHugh, Shriver, Loftus, Cunningham and Bradley1997).
Mean delta values (below diagonal) and correlations in allele frequencies per single nucleotide polymorphism (above diagonal) among breeds

Conclusions
The alternative measures of genetic diversity in the present study are complementary to each other and, in general, support the conclusion that the geographic origin of breed has had a strong influence on the current genetic makeup of the alternative breeds. Use of the high-density SNP chip data can be used to quantify the genetic structure among cattle breeds and to reduce errors in pedigree recording. The most genetically isolated breeds were the British Isle breeds, whereas the French and Swiss breeds represented a strong genetic flow due to common origin and admixture over time. Genetically uniform breeds are at a greater risk of homozygous recessive allele expression and reduced fitness and performance. Some genetic variability could be recovered through the use of crossbreeding thus maximising performance. Although the analyses performed in the present study were at a genome-wide level, similar approaches such as region-specific genomic inbreeding (Pryce et al., Reference Pryce, Haile-Mariam, Goddard and Hayes2014), runs of homozygosity (Purfield et al., 2012) or selection signatures (Zhao et al., Reference Zhao, McParland, Kearney, Du and Berry2015) may also be used to describe interesting breed-specific differentiation patterns.
Acknowledgement
Financial support from the Irish Department of Agriculture Stimulus Research Fund Multi GS and Science Foundation Ireland Precision Breeding is gratefully acknowledged.
Supplementary Material
To view supplementary material for this article, please visit http://dx.doi.org/10.1017/S1751731116001099