Background
All industrialised countries have been ageing. Fertility has been at sub replacement level in almost all countries since the 1980s and life expectancy has been increasing. Childhood and retirement are the two life stages when individuals receive most help from the state in cash benefits and in-kind services. In 2007, OECD countries spent an average of 6.4 per cent of GDP on benefits and services for the retired compared to an average of 2.0 per cent on benefits and services for families with children. Some of the public expenditure on a declining population of children can be employed in supporting an increasing retired population, but each retired person costs a great deal more than each child. Given this, it might be expected that, as well as a shift in total expenditure from children to the retired due to demography, there would also be a shift in expenditure from children to the retired in order to maintain their living standards in retirement. Esping-Andersen and Sarasa (Reference Esping-Andersen and Sarasa2002) have expressed anxiety that population ageing might impose pressures on governments to maintain high spending on the retired at the expense of children and have argued on the basis of welfare regime types that the bias in favour of the aged is especially pronounced in Southern European welfare states while Scandinavian welfare states are more youth biased.
Indeed, there may be political reasons which can explain why this has happened (Hinrichs, Reference Hinrichs2002). The retired are voters and children are not (though their parents are). Increasing grey power may have led governments to favour policies that benefit the retired over policies that favour children.
This is part of a longstanding, if episodic, interest in life-cycle distributional justice by social policy analysts. Rowntree's (Reference Rowntree2000) insights into the five alternating periods of want and plenty first raised the issue. The American demographer Sam Preston (Reference Preston1984) called attention to the changing balance of public spending on children and older people in his presidential keynote address to the Population Association of America in the early 1980s. Johnson and Falkingham (Reference Johnson and Falkingham1988) looked at spending on different age groups in the post-war period and concluded that the British welfare state had been remarkably neutral in its allocation of resources between generations. But there has not been much attention to it since analysis of it reached a new apotheosis with the Falkingham and Hills book (Reference Falkingham and Hills1995) which used a micro-simulation model LIFEMOD to explore the impact of the welfare state over the life-cycle including an analysis of the receipts and payments by welfare generations.
This paper is not a study in intergenerational equity. Piachaud et al. (Reference Piachaud, Macnicol and Lewis2009) have recently contributed to clarifying the multiple and complex meanings of intergenerational equity. They distinguish between:
• equity between different contemporary generations;
• private transfers between generations;
• public transfers between generations; and
• equity between contemporary and future generations.
They also point out that the word generation is not clear-cut, but tends to be used to describe successive cohorts. The analysis in this paper is concerned with the first of their meanings – distribution between contemporary generations; in other words between different age groups. We only address one element that contributes to fairness between contemporary generations – the distribution and redistribution of income and services organised by the state through cash benefits, taxes and the provision of in-kind services.
Piachaud et al. (Reference Piachaud, Macnicol and Lewis2009: para 2.3) also argue that analysing generational equity calls for a life-course perspective: ‘one has to consider and evaluate the totality of experiences over a completed life, identifying and balancing out “gains” and “losses”. An instantaneous, cross-sectional view is misleading, since older people are “our future selves”.’ However, data to permit detailed, longitudinal income and redistribution analyses across extended time periods within such life-course perspectives are not readily available. As such, the comparison in this paper is not of completed lives, nor between successive generations, but focuses on a thirty-four year cross-sectional time series of households with children and retired households.
A recent contribution has come from the British conservative politician David Willetts (Reference Willetts2010) who argues that in the UK the post-war baby boomers born between 1945 and 1965 have taken a greater share of national resources than the generation that came before and after them. His thesis is quite complex but he argues that the baby boomers had higher real incomes, partly due to the increase in two earner households; they also avoided the effects of globalisation which impacted on the earnings of subsequent generations. They have benefited from low inflation and have been the main beneficiaries of the house price boom. The welfare state in the form of public social policy is not an important player in the Willetts's thesis; indeed it is almost completely ignored. But if, as he concludes, we are going to have to ‘protect the interest of the future generation’, then it is likely that social policies will have to play a part. What part have they been playing in recent decades?
To answer this question, this paper exploits two sources of data on social expenditure over recent years to analyse whether there has been a shift in redistributive effort from families with children to the retired or vice versa, and, if so, what form this shift has taken.
Analysis of OECD expenditure data
The first analysis is based on the OECD Social Expenditure Database. There the OECD publishes data on expenditure on cash benefits and services for the retired (pensions, early retirement pensions, ‘other’ cash benefits, residential care or home help services and ‘other’ benefits in kind), and cash benefits and services for children (family allowances, maternity and parental leave, ‘other’ cash benefits, day care or home help services and ‘other’ benefits in kind). What evidence is there that welfare state effort has shifted between the retired and children – the two groups who are the main beneficiaries of social expenditure?
We cannot rely on trends in raw expenditure because this may be due to demographic change – expenditure on children may be going down because there are fewer children needing to receive benefits and services and expenditure on the retired may be going up because there are more retired. This does not imply a deliberate shift of resources in favour of the retired. So we control for demography by estimating expenditure per capita older person and per capita child.
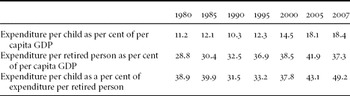
In Table 1, we present the OECD data for the UK. According to the OECD, expenditure per child on family benefits and services fell as a percentage of per capita gross domestic product (GDP) between 1980 and 1990 and then increased again to 2007. There was an unfortunate break in the retired series between 1989 and 1990 due to a change of methodology in the ESSPROS (European System of Integrated Social Protection Statistics) series. Nevertheless, we see a steady increase in spending per retired person as a percentage of per capita GDP until 2007.
Social spending per child and per retired person as per cent of per capita GDP and expenditure per child in $ purchasing power parity as a proportion of expenditure per retired person in $ purchasing power parity, UK

Source: Derived from OECD Social expenditure database http://stats.oecd.org/Index.aspx?datasetcode=SOCX_AGG
The question we are interested in is – has expenditure on children suffered at the expense of spending on the retired? The best way to explore this is to look at ratios, to estimate social expenditure per capita child as a per cent of social expenditure per capita retired person. We can see in Table 1 that the ratio fell between 1980 and 1990 but increased sharply by 2007. So there is no evidence here of a serial trend in favour of pensioners at the expense of children in the UK; if anything, the reverse has been true.
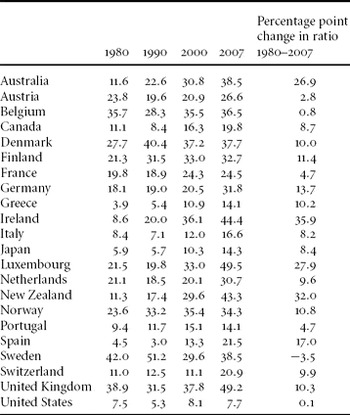
What has happened in other OECD countries? Table 2 presents these results for the OECD countries for which there is a complete series between 1980 and 2007. In all countries, spending per child is lower than spending per retired person. The ratio varies considerably from country to country. In the USA in 2007, spending per child was only 7.7 per cent of spending per retired person compared to 49.5 per cent in Luxembourg and 49.2 per cent in the UK. However, the main point to note about this table is that the ratio has increased in all countries except Sweden over the period 1980–2007. It has also increased in the other countries for which we have data for only some of the period, including the Czech Republic, Hungary, Iceland, South Korea, Mexico, Poland and Slovakia.
Expenditure per child in $ purchasing power parities as a percentage of expenditure per retired person in $ purchasing power parities

Source: Derived from OECD Social expenditure database http://stats.oecd.org/Index.aspx?datasetcode=SOCX_AGG
Generally, there is no evidence that social expenditure on the retired has increased at the expense of social expenditure on children in the OECD and the reverse is often true. However there are some countries which have become relatively less generous to children – Denmark and Sweden since 1990.
There are some serious limitations to this analysis. There are reasons to be anxious about the consistency of the OECD classification of social expenditure between countries. This may be particularly problematic as countries use different policies to deliver the same outcomes. The OECD classification of public social expenditure does not include tax expenditures, mandatory occupational provision, occupational benefits, housing benefits, health expenditure or child support (alimony). Education expenditure is available but not included here. Nor does it take account of the fact that benefits are taxed in some countries and not others. In its work on net social expenditure, the OECD has been working to take account of some of these problems (Adema, Reference Adema2001) and although there is net social expenditure data available, only from 2001 onwards, it is not disaggregated by age group.
For the same reasons, there may be reasons to be anxious about the consistency of the classification in any one country over time. For example, some countries have turned elements of their cash benefits for children into tax benefits in recent years which may not be classified as social expenditure. The latest data we have is up to 2007– well before the current recession began. Finally, these data do not allow us to observe distributional changes, or which elements of the tax and benefit system have contributed to the changes described.
So this led us to the analysis of UK micro data.
Analysis of UK data
Methods
The Office for National Statistics (ONS) publishes an annual analysis The Effects of Taxes and Benefits on Household Incomes in the UK and, from 1994/5 onwards, has also made the dataset, on which the analysis is based, available in the UK Data Archive. Our analyses uses the reports from 1977 to 2010/11 to examine how five different stages of the distributional process have become more or less favourable to retired households and households with children over this time period. We also use the datasets from 1994/5 to 2009/10 to assess how income inequality after each distributional stage has changed over this shorter time period within these two family types.
The five stages of the distributional process examined are as follows:
• Original income: cash income before any form of taxation or receipt of any benefits or services in kind.
• Gross income: original income plus cash benefits.
• Disposable income: gross income minus direct taxation and National Insurance contributions.
• Post-tax income: disposable income minus indirect taxation.
• Final income: post-tax income plus benefits received in kind.
The Effects of Taxes and Benefits on Household Income reports provide a detailed breakdown of the mean household income at each of these distributional stages and the mean values of the government transfers which comprise the distributional process for a range of household types. Retired households are defined as households ‘where the combined income of retired members amounts to at least half the total gross income of the household, where a retired person is defined as anyone who describes themselves as ‘retired’ or anyone over minimum National Insurance pension age describing themselves as ‘unoccupied’ or ‘sick or injured but not intending to seek work’ (Barnard, Reference Barnard2010: 44). Households with children are non-retired households containing a child ‘aged under 16 or aged 16, 17 or 18 but unmarried and receiving full-time, non-advanced further education’ (Barnard, Reference Barnard2010: 43).
As datasets were only available from 1994/5, we relied on the published data for the first stage of our analyses to provide a longer time series. However, this limited our analyses in three main ways.
First, the reports do not provide equivalised income by household type for all distributional stages, only for disposable income. Therefore, in parts of the analysis we are reporting unequivalised mean incomes and those mean incomes may have to meet the needs of households whose composition has been changing over time. Over the period since 1977, the ratio of single to couple retired households has hardly changed and the ratio of equivalised to unequivalised average disposable income of retired households was the same in 1977 as it was in 2009/10 (123 per cent). However, over the same period household with children have become smaller with fewer couples with three or more children (15 per cent of households with children in 1977 compared to 10 per cent in 2009/10) and more lone parent households (8 per cent of households with children in 1977 and 17 per cent in 2009/10). These changes have resulted in the ratio of equivalised disposable income to non-equivalised disposable income rising over the period from 66 per cent in 1977 to 71 per cent in 2010/11. Therefore, some of the increase we will be observing in the unequivalised average income of households with children will be less than it would have been if we had been able to use equivalent income. Also when we show ratios of retired households to families with children they will be slightly lower than they would have been if we had been able to use equivalised income. We will return to this in the discussion of Figure 8.
Second, we are subject to a range of assumptions made by the ONS authors (e.g. definitions, treatment of negative incomes and values of in-kind benefits). Full details of these assumptions can be found in the report appendices for individual years.
Third, prior to 1991/2 for households with children and 1990/1 for retired households, aggregated means were not reported by household composition within each household type. For these years, we estimated weighted means for each household type from the reported values for the disaggregated household types (e.g. single person retired households, two-person retired households, lone parents with children, couples with one, two, three and more children and other households with children). The reliability of this approach was confirmed by calculating weighted means from disaggregated information in the datasets for later years and comparing these to the reported aggregated means.
An additional limitation arose due to the survey data from which the reports and datasets are compiled not containing sample weights until 1996/7. Given datasets were only available from 1994/5 onwards, adjusting most of the unweighted years’ means was impracticable. Therefore, we report unweighted data from 1977 to 1995/6 and weighted data from 1997/8 onwards. Sensitivity analyses using the micro-level datasets suggest using unweighted data in the later years would not substantively alter our findings.
Results
First we analyse each stage of the distributional process.
Original income
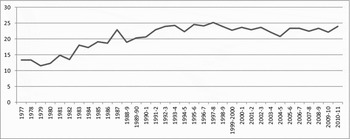
Figure 1 shows the average original income of retired households as a proportion of the average original income of households with children. This is what the market produced before any taxes and benefits. It can be seen that the original income of retired households is smaller than that of households with children – only 13 per cent in 1977 at the beginning of the period and only 24 per cent at the end. It can be seen that the retired improved their relative position under the Conservative governments between 1979 and 1997 (when Labour took power). After that, the income of households with children improved relative to retired people, probably as a result of rising levels of employment and increased earnings. However this improvement began to dissipate after 2004/5. Over the whole period, in terms of original income the retired were slightly better off in comparison with households with children at the end of the period than they had been at the start. This appears to be almost entirely due to the growth of occupational pension income.
Trend in the average original income of retired households as a percentage of the average income of households with children
Source: Own calculations from ONS (various years) ‘The effects of taxes and benefits on household income.’

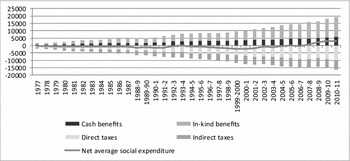
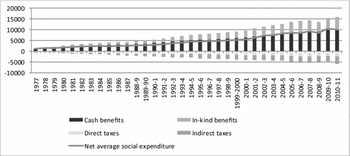
Figures 2 and 3 present an overall summary of trends in the average amount of cash benefits and in-kind benefits received and direct and indirect taxes paid in cash terms. The lines represent the net average social expenditure.
Mean transfers to households with children, £ per year
Source: Own calculations from ONS (various years) ‘The effects of taxes and benefits on household income.’

Mean transfers to retired households, £ per year
Source: Own calculations from ONS (various years) ‘The effects of taxes and benefits on household income.’

It can be seen in Figure 2 that for households with children cash benefits and in-kind benefits increased over the period in cash terms but so did direct and indirect taxes. As a result, average net social expenditure on households with children was negative for most of the period. However, thanks largely to a reduced tax burden after 2008/9, perhaps due to rising unemployment, net social expenditure increased over the whole period by about £3,487.
For retired households in Figure 3 cash benefits and in-kind benefits increased and so did direct and indirect taxes but at a lower rate than for households with children and over the whole period net social expenditure rose by £8,826 on average.
These are cash comparisons and in this paper we are interested in the relationship between the incomes of retired households and households with children. So we now explore each of those elements in more detail.
Cash benefits
Original income is supplemented through the provision of cash benefits – for retired households this is mainly the basic state pension and also income support/minimum income guarantee/pension credit, housing benefit and disability-related benefits. For families it includes child benefit, family/tax credits, housing benefits and benefits for the unemployed and people with disabilities. Many of the benefits received by families with children are subject to cyclical fluctuations in employment rates.
Figure 4 shows trends in the ratio of average cash benefits paid to retired households over cash benefits paid to households with children. In 1977, the average retired household received roughly three times the cash benefits paid to households with children. The ratio fell quite steeply during the 1980s recession, picked up towards the end of the 1980s before falling again in the early 1990s recession. Then the ratio fluctuated up and down and in 2010/11 the cash benefits of the retired were 1.7 times that of families with children. The Labour Government made real improvements in the level of both pensions and family benefits after 1999, and if anything there was a slight tendency for cash benefits for the retired to improve relative to households with children, thanks probably to the uprating formula. The reduction in the ratio after 2008/9 may be the early results of increased spending on unemployed families in the great recession. However, there is really no evidence here that cash benefits have moved serially in favour of the retired at the expense of children.
Ratio of cash benefits for retired households over average cash benefits for households with children
Source: Own calculations from ONS (various years) ‘The effects of taxes and benefits on household income.’

Direct and indirect taxes
Then the distribution is influenced by direct (income tax, national insurance contributions, net council tax) and indirect taxation (mainly VAT but also duties on alcohol, tobacco, etc.). In Figure 5, it can be seen that the retired pay less direct taxes on average than households with children. Their share increased during the 1980s until the Lawson boom but since then they have paid proportionately less ever since – the ratio has fallen from 35 per cent of what households with children pay in 1987 to 25 per cent in 2010/11. The ratio of indirect taxes paid by the retired also increased during the 1980s but since then reductions in direct taxes has been offset by an increase in indirect taxes. In 1977, the retired paid 32 per cent of what households with children paid in indirect taxes and by 2010/11 that had increased to 53 per cent. The decline in more progressive direct taxes and the increase in more regressive indirect taxes may have an impact on the distributional picture below.
Ratio of direct and indirect taxes paid by retired households as a percentage of those paid by households with children
Source: Own calculations from ONS (various years) ‘The effects of taxes and benefits on household income.’

In kind services
Finally social expenditure on in-kind services is taken into account by expressing the expenditure as a cash value per household. The major part of this is spending on education and health but also includes housing subsidies, rail and bus travel subsidies, school meals and Healthy Start (the old welfare foods programme). Retired households receive less value from services than households with children mainly because they consume very little education. Figure 6 shows that the retired had been receiving increased value from services relative to households with children, especially in the period of the Labour Government after 1999 – due to increased spending on the NHS. Unfortunately, the ONS changed the method used to estimate the value of benefits in kind after 2005/6 and although they have published an article (ONS, 2012) covering the methodological changes in the measurement of benefits in kind and applied the current methodology to the years 2005/06 to 2010/11 in order to produce consistent time series for each benefit in kind over this period, it is only available for all households.
Ratio of average in kind services for retired households as a percentage of average in kind services for households with children (note break in series after 2005/6)
Source: Own calculations from ONS (various years) ‘The effects of taxes and benefits on household income.’

Overall
Figure 7 brings the analysis together by combining receipts (cash benefits and in-kind benefits) and combining the tax takes (direct and indirect). The ratio of average benefit receipt fell in the early 1980s and again in the 1990s. It fluctuated over the period but was lower in 2010/11 than it had been in 1977. The ratio of the tax take increased in the 1980s but since then has hardly moved at all.
Ratio of retired households as percentage of households with children: benefits (cash and kind) and taxes (direct and indirect)
Source: Own calculations from ONS (various years) ‘The effects of taxes and benefits on household income.’

Figure 8 summarises what has gone before by comparing the ratios of original, disposable income (equivalised and unequivalised) and final income. In all cases, the ratios have changed slightly in favour of the retired over the whole period. In 1977, the equivalent disposable income of retired households was 71 per cent of that of families with children. In 2010/11, it was 77 per cent. The ratio was lowest in 1979 at 65 per cent and highest in 1998 at 81 per cent. Between 1977 and 2010/11, the ratio of retired persons to households with children's original income increased by 44 per cent, disposable income increased by 17 per cent, equivalent disposable income by 9 per cent – indicating that some of the improvement in the mean income was due to changes in the size and structure of households. The ratio of final income improved by 10 per cent. Almost all of the relative change can be ascribed to an improvement in the original income of the retired and almost all of the increase in original income has been due to an increase in occupational pensions. The UK welfare state has remained remarkably neutral between the retired and child households over this thirty-four-year period. The most that can be said is that it reduced the relative improvement of the original income of the retired.
Ratio of retired households’ income as a percentage of those of households with children's income at stages of the distributional process
Source: Own calculations from ONS (various years) ‘The effects of taxes and benefits on household income.’

Distribution
So far this has been a picture of the average. What about the distribution? For the reasons discussed in the methods section this analysis has to be based on the raw data, which are available only since 1994/5. For the second stage of our analysis, we constructed three measures of inequality within our two household types at each distributional stage from the datasets for 1994/5 through to 2009/10 and equivalising using the square root of the number of household members. The inequality measures constructed were the Gini coefficient and the 80/20 ratio. Gini coefficients were constructed using adapted syntax code obtained from the online SPSS support forum (SPSS, 2010). The same definitions are used as in the first stage of the analysis and data were weighted from 1997/8 onwards (earlier data were not weighted as no weights were available for 1994/5 and 1995/6 and the 1996/7 weighting variable containing an error). Because of the change in method for calculating in-kind benefits, we examined changes in inequality for post-tax income (before in-kind benefits) and final income (after in-kind benefits). Our conclusions were not substantially affected by the methodological change so we report results for final income here. In Figure 9, we compare the gini coefficients and the 80/20 ratios for households with children and the retired. For the retired, there has been a reduction in overall inequality as measured by the Gini and a downward trend from 2000/1 onwards in the 80/20 ratio. For households with children, the results are complicated. There were marked rises and falls in inequality across the period with no overall trend. The Gini peaked in 1999/2000 and 2006/7 and reached a low in 2004/5 whilst the 80/20 ratio fell between 1997/8 and 2004/5 but rose thereafter.
Final income Gini coefficient (right-hand axis) and 80/20 ratios (left-hand axis)
Source: Own analysis of ‘the effects of taxes and benefits on household incomes’, microdata on the ESRC data archive.

It can be seen in Figure 10 that the ratio of the retired Gini to the family with children Gini has fallen slightly over the period for all stages of the distribution process. Recent increases in the inequality of original income amongst families with children are in contrast to a static trend for the retired. Figure 10 suggests the distributional process has not responded to these disparate trends and inequality amongst families with children has increased relative to retired households as a result.
Components of the change in the ratios of Gini coefficients of retired households to those of households with children
Source: Own analysis of ‘the effects of taxes and benefits on household incomes’, microdata on the ESRC data archive.

Figure 11 shows the percentage increase in incomes between 1994/5 and 2009/10. At the 80th percentile families have had a slightly larger increase in the original income than the retired over this period. At the 90th percentile families with children have had a much larger increase at all income stages than the retired. At the 20th percentile and 10th percentile few households have original income and so the mean is unreliable (and not shown here) but at each of the other stages of the income distribution at both the 20th and 10th percentile these low income households have had a higher percentage increase in their incomes, and families with children have done slightly better than the retired.
Percentage increase in incomes 1994/5-2009/10
Source: Own analysis of ‘the effects of taxes and benefits on household incomes’, microdata on the ESRC data archive.

This is quite curious given what we know from trends in poverty rates (based on a different source – the Family Resources Survey, and using individuals rather than households). Pensioner poverty rates have fallen slightly faster than the child poverty rates since 1994/5 (see Figure 12). This suggests a fairly complicated distributional picture with results probably highly sensitive to where poverty thresholds and percentile points fall in the distribution.
Poverty rates per cent with equivalent income less than 60 per cent median before housing costs
Source: DWP, 2012

Conclusion
The analysis of OECD public expenditure data, based on national accounts over the period 1980 to 2007, gives no support to the hypothesis that in the face of an ageing population the welfare state in the UK or most other countries has become less generous to children. The analysis of UK data at a micro level takes into account the impact of direct and indirect taxes and health and education spending not included in the OECD analysis. The conclusion is that the impact of taxes and benefits on the retired households vis-à-vis households with children has been extraordinarily stable over the last twenty years. A small improvement in the relative value of cash benefits for families with children has been offset by a small deterioration in their tax take thanks mainly to indirect taxes. The relative value of services in kind for the retired increased until 2006/7. The final incomes of retired households have improved relative to families with children but this was achieved entirely as a result of the relative improvement in retired household original income, almost entirely due to occupational pensions.
This picture of the average does not change much if we focus on the distribution. Ratios of inequality between retired and families with children have changed very little, although retired households have become slightly more equal relative to families with children in recent years.
What does this tell us about distributional equity between age groups? There is little evidence that public policy is contributing to a shift in resources between age groups or at least not the benefits, taxes and services aspects of social policy. Of course, public policy is only part of the story. Most of the discussion of generational equity focuses on earned income, the value of housing, access to higher education and other capital.
Furthermore, we should be wary of predicting the future from the past. The retired population rose by 1.6 million between 1991 and 2010. It will rise by 6 million between 2010 and 2030. The impact of the retirement of the baby boomers is only just beginning. Then there is also the Coalition Government's response to the recession and to the deficit which has included an extraordinary list of cuts imposed on benefits and services for families with children (Joyce, Reference Joyce2012) and hardly any cuts to cash benefits for the retired. Indeed, the government intends to reintroduce the link between the basic retirement pension and movements in earnings (Yeates et al., Reference Yeates, Haux, Jawad and Kilkey2011). There are also aspirations to replace contributory retirement pension with a citizenship pension at a high enough level to remove the need for Pension Credit, which will involve a large increase in spending on better-off pensioners. It would be as well to maintain vigilance.