1 Introduction and background
Shock–turbulence interactions (STI) are observed in a number of contexts including supersonic aerodynamics, turbulent combustion and astrophysical flows making them an important topic in fluid dynamics. The existence of a shock in a turbulent flow can significantly alter both the mean fields and turbulent characteristics. At the same time, turbulence can also change the structure of a shock. This two-way coupling makes well-known laminar theories predicting, for example, properties jumps across the shock inapplicable in the general case (Lele Reference Lele1992b ; Lee, Lele & Moin Reference Lee, Lele and Moin1993; Larsson & Lele Reference Larsson and Lele2009; Velikovich, Huete & Wouchuk Reference Velikovich, Huete and Wouchuk2012; Larsson, Bermejo-Moreno & Lele Reference Larsson, Bermejo-Moreno and Lele2013). The complexities associated with such flows have made investigations very challenging from the theoretical, experimental and numerical standpoints. To make progress, therefore, it seems necessary to devise flow configurations that reduce complexity yet maintain the essential physics and features of interest. Thus, the canonical interaction of isotropic turbulence with a normal shock has received substantial interest and a large body of literature is devoted to the topic (Sagaut & Cambon Reference Sagaut and Cambon2008; Gatski & Bonnet Reference Gatski and Bonnet2009).
Early theories studied the adjustment of one-dimensional shock waves to changing conditions produced by, e.g. non-uniform media and non-uniform channels (Moeckel Reference Moeckel1952; Chisnell Reference Chisnell1955; Whitham Reference Whitham1958). However, it was the more general theoretical work of Ribner and Moore (Moore Reference Moore1954; Ribner Reference Ribner1954a ,Reference Ribner b ) who analysed the impingement of different small disturbances on a normal shock in an inviscid flow that provided impetus to the field for decades to come. The incoming disturbance was constructed as a linear combination of simple waves, typically following the first-order decomposition of Kovasznay (Reference Kovasznay1953). If the governing equations and jumps conditions across the shock are linearized, one can obtain a closed solution, known as the linear interaction analysis (LIA). Although LIA can predict, under certain conditions, some of the trends associated with amplification of turbulence, evidence from experiments (Andreopoulos, Agui & Briassulis Reference Andreopoulos, Agui and Briassulis2000) and simulations (Lee et al. Reference Lee, Lele and Moin1993; Mahesh et al. Reference Mahesh, Lee, Lele and Moin1995; Lee, Lele & Moin Reference Lee, Lele and Moin1997; Larsson & Lele Reference Larsson and Lele2009; Donzis Reference Donzis2012a ) have shown that other characteristics of the incoming turbulence not taken into account in the theory can strongly modify the outcome of the interaction. Alternatively, since the shock is essentially a very strong longitudinal velocity gradient, rapid distortion theory (RDT) has also been exploited to provide complementary insight (Jacquin, Cambon & Blin Reference Jacquin, Cambon and Blin1993; Kitamura et al. Reference Kitamura, Nagata, Sakai and Ito2016). However, RDT was found to overestimate turbulence amplification, in part, due to the non-homogeneous compression induced by the shock (Jacquin et al. Reference Jacquin, Cambon and Blin1993).
Because of the analytical intractability of the problem, direct numerical simulations (DNS) have become an invaluable tool to seek fundamental insight into STI. A number of DNS studies that investigated STI have also presented comparisons with different theories (Jacquin et al.
Reference Jacquin, Cambon and Blin1993; Lee et al.
Reference Lee, Lele and Moin1993, Reference Lee, Lele and Moin1997; Mahesh et al.
Reference Mahesh, Lee, Lele and Moin1995; Mahesh, Lele & Moin Reference Mahesh, Lele and Moin1997; Jamme et al.
Reference Jamme, Cazalbou, Torres and Chassaing2002; Larsson & Lele Reference Larsson and Lele2009; Larsson et al.
Reference Larsson, Bermejo-Moreno and Lele2013; Ryu & Livescu Reference Ryu and Livescu2014; Quadros, Sinha & Larsson Reference Quadros, Sinha and Larsson2016a
,Reference Quadros, Sinha and Larsson
b
). A general conclusion from those studies is that turbulence is indeed amplified due to the shock compression. With the enhanced turbulence, various quantities were shown to increase across the shock such as Reynolds stresses, enstrophy and thermodynamic fluctuations. Other variables, on the other hand, were observed to decrease across the shock such as the Taylor and Kolmogorov length scales. Some investigations utilized Kovasznay (Reference Kovasznay1953) decomposition to understand the contributions from different modes (Lee et al.
Reference Lee, Lele and Moin1997; Mahesh et al.
Reference Mahesh, Lele and Moin1997; Jamme et al.
Reference Jamme, Cazalbou, Torres and Chassaing2002; Quadros et al.
Reference Quadros, Sinha and Larsson2016a
). However, such a method is based on a strong linearization of the fluctuations and is therefore not clear how applicable it is in the case of strong turbulence. Experimental investigations, while very challenging, have also been pursued using different facilities and means of turbulence generation (Honkan & Andreopoulos Reference Honkan and Andreopoulos1992; Barre, Alem & Bonnet Reference Barre, Alem and Bonnet1996; Agui, Briassulis & Andreopoulos Reference Agui, Briassulis and Andreopoulos2005; Inokuma et al.
Reference Inokuma, Watanabe, Nagata, Sasoh and Sakai2017). Qualitatively, results are consistent with simulations. However, also consistent with simulations, data suggest that the interaction depends on other characteristics not included in classical theoretical approaches of the incoming turbulence (Agui et al.
Reference Agui, Briassulis and Andreopoulos2005). Indeed, careful comparisons (Donzis Reference Donzis2012a
) between DNS, experiments, and LIA show significant discrepancies which depend not only on the mean Mach number (
 $M$
) as predicted by LIA, but also – and more importantly – systematically on the turbulent Mach number (
 $M_{t}$
) and the Reynolds number (
 $R_{\unicode[STIX]{x1D706}}$
).
To account for these observed dependencies, the collection of amplification factors of streamwise velocity (
 $G\equiv u_{2}^{\prime 2}/u_{1}^{\prime 2}$
, where primes indicate root-mean-square (r.m.s.) quantities and 1 and 2 indicate locations upstream and downstream of the shock) in Donzis (Reference Donzis2012a
) shows, as mentioned above, systematic trends with Reynolds and turbulent Mach numbers. These observations suggest that some of the assumptions behind LIA (linearity, no viscosity effects, shock wave as a discontinuity) are not satisfied for some conditions. It was then proposed an alternative scaling parameter,
 $K$
, that includes not only the mean Mach number but also the turbulent Mach number and the Reynolds number. This parameter
 $K\equiv M_{t}/R_{\unicode[STIX]{x1D706}}^{1/2}(M-1)$
, which can be written as the ratio of shock thickness (
 $\unicode[STIX]{x1D6FF}_{l}$
) to Kolmogorov length scale (
 $\unicode[STIX]{x1D702}$
), was shown to provide good collapse of the available data. While some new numerical studies have appeared since then, the main focus has been on relatively strong shocks. Regimes where, instead, turbulence is relatively strong – and where assumptions behind classical theories may be inapplicable – have thus received relatively less attention, and is a thrust in this work.
Of interest also is the effect of turbulence on the shock, especially when turbulence is relatively intense. At high enough turbulent intensities it has been found that the shock may present ‘holes’ on its surface along which variables do not undergo a steep change consistent with classical one-dimensional inviscid theoretical results. Instead, variables can change smoothly or present multiple peaks. These two qualitatively distinct regimes have been termed wrinkled and broken (Lee et al.
Reference Lee, Lele and Moin1993; Larsson & Lele Reference Larsson and Lele2009) and have been traditionally determined from visual observations of flow fields. To quantify the effects of turbulence on the shock, one can consider the r.m.s.-to-mean ratio of dilatation at the shock,
 $\unicode[STIX]{x1D6E9}$
. Under the so-called quasi-equilibrium (QE) assumption (described more precisely below), we have derived an expression for
 $\unicode[STIX]{x1D6E9}$
which depends solely on the parameter
 $M_{t}/\unicode[STIX]{x0394}M$
(Donzis Reference Donzis2012b
) where
 $\unicode[STIX]{x0394}M=M-1$
and that collapsed the data available then. Furthermore, we proposed a mechanisms for the creation of holes due to subsonic regions resulting from strong turbulent fluctuations. While the proposed criterion (
 $M_{t}/\unicode[STIX]{x0394}M\approx 0.6$
) indeed identified correctly wrinkled and broken regimes (Donzis Reference Donzis2012b
), no data were available to test directly the appearance of subsonic regions. Here we test this result and extend analytical expressions to the case of strong turbulence.
It has also been observed that turbulence fluctuations can affect the mean properties around the shock. The well-known Rankine–Hugoniot (RH) relations provide an exact solution for the change of properties across a one-dimensional normal shock (Thompson Reference Thompson1984). These expressions depend only on
 $M$
. When turbulence is present, however, one can expect the results to depend also on turbulent characteristics. Lele (Reference Lele1992b
) considered shock jumps of density and pressure in the presence of turbulence using an RDT closure and derived closed expressions for these jumps as a function of
 $M$
and
 $M_{t}$
. However, Larsson et al. (Reference Larsson, Bermejo-Moreno and Lele2013) suggested that while results were in qualitative agreement with DNS data, there were substantial quantitative disagreements and proposed an empirical dependence on
 $M_{t}/M$
instead. In addition to its fundamental importance, understanding the effect of turbulence on mean fields has implications for stability of shock waves in practical devices such as scramjets as well as in simulations of STI. In the latter, corrections to obtain a stationary shock are typically found in a trial-and-error manner (Larsson & Lele Reference Larsson and Lele2009; Ryu & Livescu Reference Ryu and Livescu2014). Thus, there is a clear need to further our fundamental understanding of the effect of turbulence on mean fields, an effort that is undertaken here as well.
The rest of the paper is organized as follows. In § 2, the details of the numerical methods used including grid convergence and domain size effects are introduced. In § 3, the quasi-equilibrium assumption is described and utilized to obtain thermodynamic jumps and r.m.s.-to-mean dilatation at the shock which are compared with DNS data. Amplification factors are discussed in § 4. Finally, conclusions are presented in § 5.
2 Direct numerical simulations
2.1 Governing equations
The simulations presented here are based on the compressible Navier–Stokes equations:
 $$\begin{eqnarray}\displaystyle & \displaystyle \frac{\unicode[STIX]{x2202}\unicode[STIX]{x1D70C}}{\unicode[STIX]{x2202}t}+\unicode[STIX]{x1D735}\boldsymbol{\cdot }(\unicode[STIX]{x1D70C}\boldsymbol{u})=0, & \displaystyle\end{eqnarray}$$
 $$\begin{eqnarray}\displaystyle & \displaystyle \frac{\unicode[STIX]{x2202}}{\unicode[STIX]{x2202}t}(\unicode[STIX]{x1D70C}\boldsymbol{u})+\unicode[STIX]{x1D735}\boldsymbol{\cdot }(\unicode[STIX]{x1D70C}\boldsymbol{u}\boldsymbol{u})=-\unicode[STIX]{x1D735}p+\unicode[STIX]{x1D735}\boldsymbol{\cdot }\text{}\underline{\unicode[STIX]{x1D749}}+\unicode[STIX]{x1D70C}\boldsymbol{f}+\boldsymbol{S}, & \displaystyle\end{eqnarray}$$
 $$\begin{eqnarray}\displaystyle & \displaystyle \frac{\unicode[STIX]{x2202}}{\unicode[STIX]{x2202}t}(\unicode[STIX]{x1D70C}e)+\unicode[STIX]{x1D735}\boldsymbol{\cdot }(\unicode[STIX]{x1D70C}e\boldsymbol{u})=-p\unicode[STIX]{x1D735}\boldsymbol{\cdot }\boldsymbol{u}+\unicode[STIX]{x1D735}\boldsymbol{\cdot }(\unicode[STIX]{x1D705}\unicode[STIX]{x1D735}T)+\text{}\underline{\unicode[STIX]{x1D749}}\boldsymbol{\cdot }\unicode[STIX]{x1D735}\boldsymbol{u}+S_{e}, & \displaystyle\end{eqnarray}$$
where
 $\unicode[STIX]{x1D70C}$
is density,
 $\boldsymbol{u}$
is the velocity vector,
 $p$
is pressure,
 $\text{}\underline{\unicode[STIX]{x1D749}}$
is the stress tensor for a Newtonian fluid given by
 $\unicode[STIX]{x1D70F}_{ij}=\unicode[STIX]{x1D707}(\unicode[STIX]{x2202}u_{i}/\unicode[STIX]{x2202}x_{j}+\unicode[STIX]{x2202}u_{j}/\unicode[STIX]{x2202}x_{i}-(2/3)\unicode[STIX]{x1D6FF}_{ij}\unicode[STIX]{x2202}u_{k}/\unicode[STIX]{x2202}x_{k})$
with zero bulk viscosity,
 $\boldsymbol{f}$
is the body force vector used to generate turbulence,
 $\boldsymbol{S}$
is a sponge vector,
 $e$
is internal energy,
 $\unicode[STIX]{x1D705}$
is thermal conductivity and
 $T$
is temperature. The viscosity follows a power law with temperature as
 $\unicode[STIX]{x1D707}=\unicode[STIX]{x1D707}_{0}(T/T_{0})^{0.75}$
(
 $\unicode[STIX]{x1D707}_{0}$
and
 $T_{0}$
are reference values) and the Prandtl number is assumed to be constant at
 $Pr=0.72$
. To close the system of equations, an ideal gas is assumed which follows the equation of state
 $p=\unicode[STIX]{x1D70C}RT$
with
 $R$
being the gas constant of the fluid. The ratio of specific heats is
 $\unicode[STIX]{x1D6FE}=1.4$
. As in virtually all previous studies (§ 1), the flow is assumed to be a continuum which is justified at the conditions presented here (Moser Reference Moser2006). As in Donzis & Jagannathan (Reference Donzis and Jagannathan2013) and Jagannathan & Donzis (Reference Jagannathan and Donzis2016), discretization of spatial derivatives is performed with tenth-order compact schemes whose numerical and computational advantages are well known (Lele Reference Lele1992a
).
2.2 Numerical methods
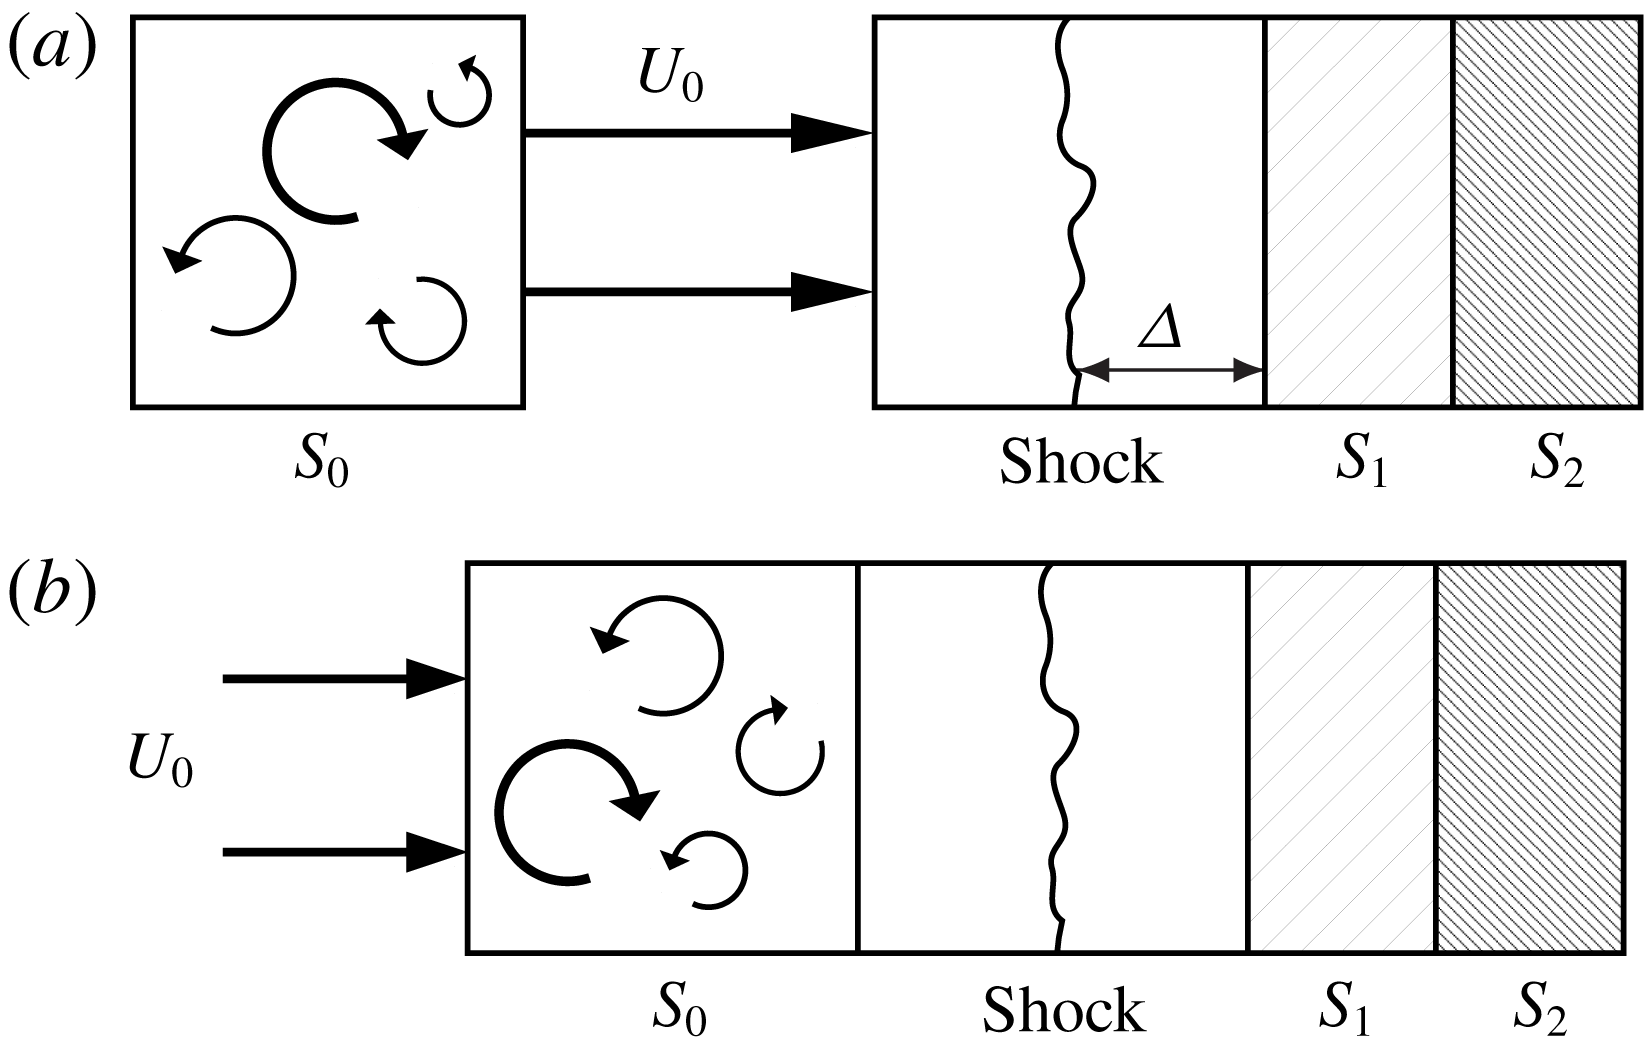
In order to assess the generality of the theoretical results presented here, two approaches are used to generate turbulence which yield isotropic and anisotropic fluctuations. The two methods used the same code and adopt the same forcing. The difference between the two approaches lies on where the forcing is applied (
 $S_{0}$
) as is seen in the schematic diagrams given in figure 1. This forcing consists of an additional body force in the momentum equation which is stochastic and applied at large scales. This force is constructed using integrated Ornstein–Uhlenbeck processes with finite-time correlation in Fourier space. In physical space, the forcing can be written as
 $$\begin{eqnarray}\boldsymbol{f}=\mathop{\sum }_{|k|<k_{F}}\hat{\boldsymbol{f}}_{\bot }(\boldsymbol{k})\text{e}^{-\text{i}\boldsymbol{k}\boldsymbol{\cdot }\boldsymbol{x}},\end{eqnarray}$$
where
 $\hat{\boldsymbol{f}}_{\bot }(\boldsymbol{k})=(\boldsymbol{I}-\boldsymbol{k}\boldsymbol{k}/k^{2})\boldsymbol{\cdot }\hat{\boldsymbol{f}}$
is the projection of the mode at wavenumber
 $\boldsymbol{k}$
onto a plane perpendicular to the wave vector itself. This guarantees that the stirring mechanism is, by construction, solenoidal. The forcing parameters are chosen to achieve a given
 $R_{\unicode[STIX]{x1D706}}$
and
 $M_{t}$
and, at the same time, yield integral length scales which are a fraction of the domain size. Further details of the forcing and statistics of the resulting turbulence fields are described in Donzis & Jagannathan (Reference Donzis and Jagannathan2013) and Jagannathan & Donzis (Reference Jagannathan and Donzis2016).
A schematic of the shock interacting with (a) isotropic turbulence and (b) anisotropic turbulence in the computational domains.

The two approaches that result in isotropic and anisotropic turbulence, respectively, are now described.
Isotropic turbulence (IT). In this procedure a separate simulation of isotropic turbulence in a triply periodic domain (
 $S_{0}$
) is conducted (figure 1
a). Once in stationary state, the turbulence is convected through the inlet using Taylor hypothesis at a velocity
 $U_{0}$
which corresponds to a mean Mach number,
 $M$
. A similar procedure has been used before in the literature with forced (e.g. Ryu & Livescu Reference Ryu and Livescu2014) and decaying turbulence (e.g. Mahesh et al.
Reference Mahesh, Lele and Moin1997; Larsson & Lele Reference Larsson and Lele2009) though forcing details are somewhat different.
Spatially developing turbulence (SDT). In this approach, turbulence is generated upstream of the shock in
 $S_{0}$
in a single simulation as it is convected at
 $U_{0}$
(figure 1
b). The domain is longer in the streamwise direction than that for the isotropic approach above. The interaction between the fluctuations and the mean flow in
 $S_{0}$
, results in unequal production rates in the streamwise and transverse components (Taylor Reference Taylor1935). The result is a slightly anisotropic flow with a streamwise component of the velocity variance larger than transverse components. Such flow is closer to grid-generated turbulence in wind tunnels where anisotropy in the turbulence has been consistently observed (Grant & Nisbet Reference Grant and Nisbet1957; Mohamed & Larue Reference Mohamed and Larue1990).
To sustain a statistically stationary shock at a prescribed location in the domain it is necessary to impose a relatively high pressure downstream of the shock which is done here using a sponge region (
 $S_{1}$
in figure 1). For a shock in a uniform flow, the appropriate pressure jump is given by standard Rankine–Hugoniot relations. However, the interaction of turbulent fluctuations with the normal shock produces a well-known slow drift of the shock (Lee et al.
Reference Lee, Lele and Moin1993; Larsson et al.
Reference Larsson, Bermejo-Moreno and Lele2013; Ryu & Livescu Reference Ryu and Livescu2014) which is due to the changes in post-shock pressure when upstream fluctuations are present. In a typical STI simulation the back pressure is commonly adjusted in a trial-and-error fashion. Our analytical results below, instead, provide the explicit dependence of pressure jumps on characteristics of the upstream turbulence.
In addition, care has to be taken to avoid boundary reflections as the flow becomes subsonic downstream of the normal shock. Thus, we use a second sponge (
 $S_{2}$
in figure 1) between
 $S_{1}$
and the outlet. In this region the flow is smoothly accelerated to supersonic speeds such that no characteristic travels upstream from the outlet avoiding potential effects from outflow boundary conditions. This approach has been used and tested in previous studies (Freund Reference Freund1997; Ryu & Livescu Reference Ryu and Livescu2014). In both sponge regions
 $S_{1}$
and
 $S_{2}$
we include a body force of the following form:
 $$\begin{eqnarray}S_{q}=A\langle q\rangle \frac{(x-x_{s1})^{n_{1}}(x-x_{s2})^{n_{2}}}{l_{s}^{n1+n2+1}}(q_{ref}-q),\end{eqnarray}$$
where
 $A$
is a constant,
 $\langle \cdot \rangle$
represents an average over the sponge region,
 $x_{s1}$
and
 $x_{s2}$
are the beginning and the end points of a sponge,
 $l_{s}$
is the length of a sponge,
 $n_{1}$
and
 $n_{2}$
are constant exponents and subscript ‘ref’ stands for the specified value that a variable inside the sponge converges to (pressure in
 $S_{1}$
and streamwise velocity in
 $S_{2}$
).
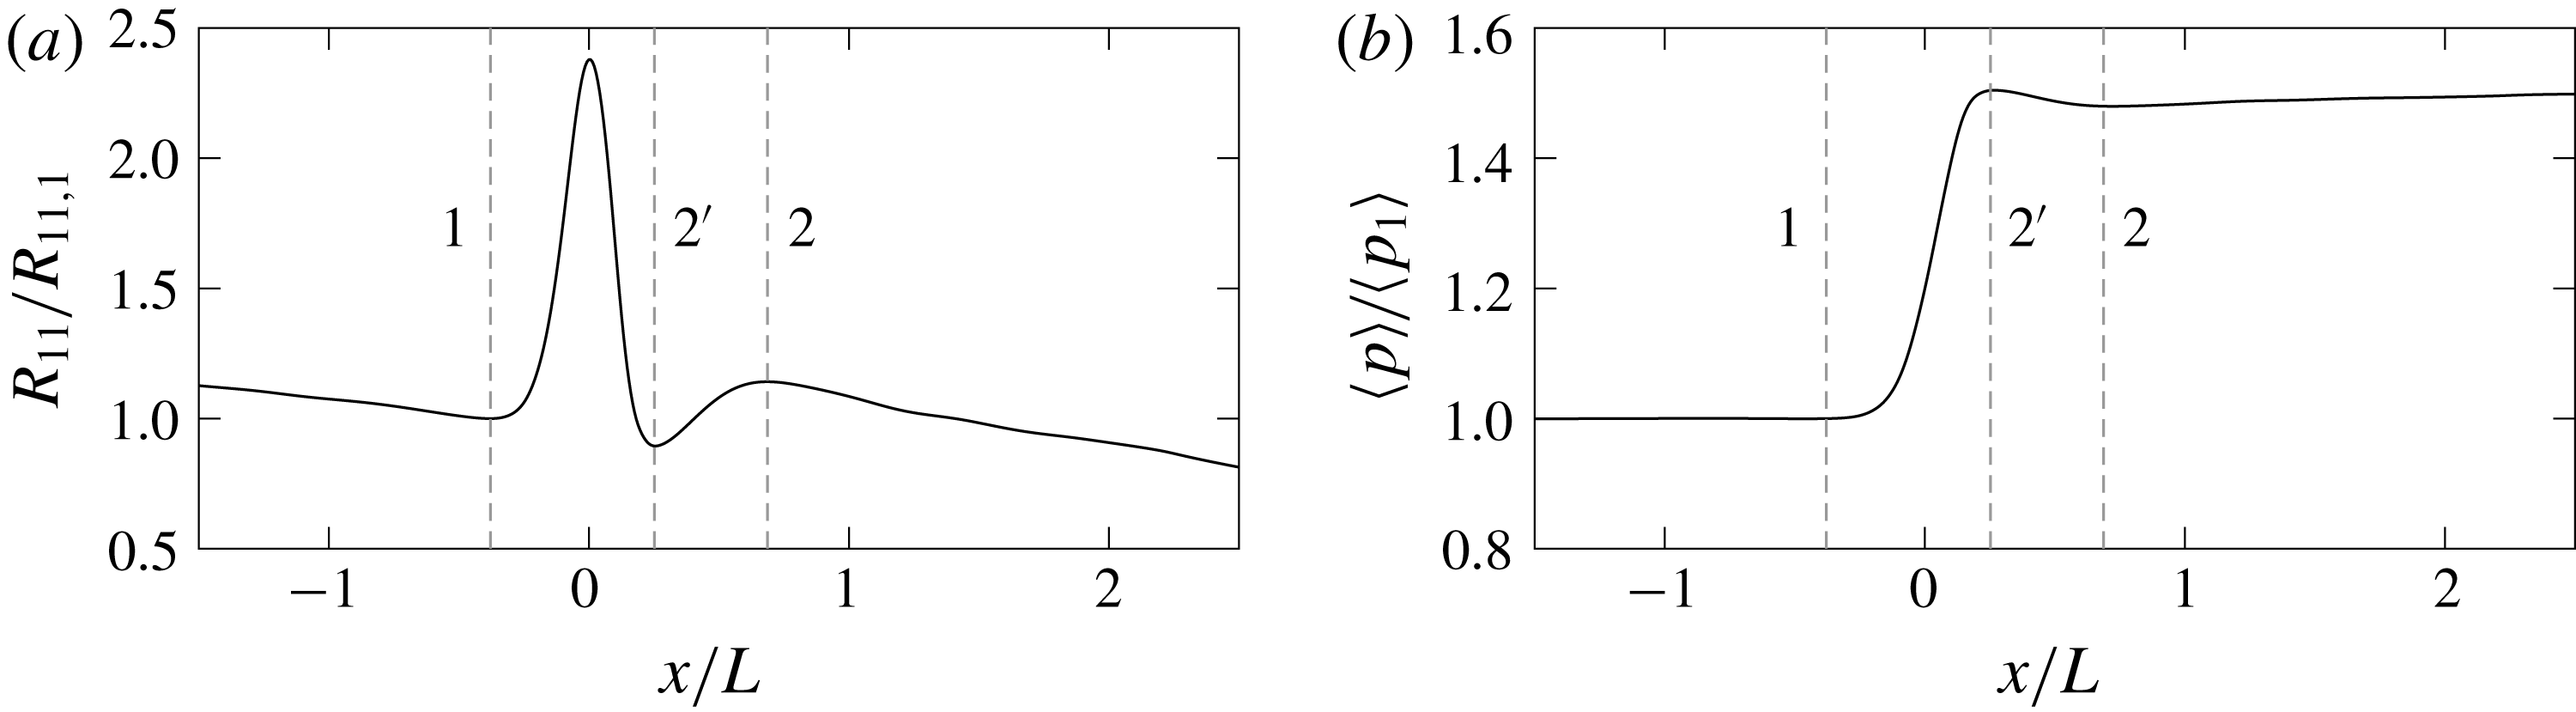
Typical streamwise distribution of (a) Reynolds stress
 $R_{11}$
and (b) pressure, both normalized by their upstream value at
 $M=1.2$
,
 $R_{\unicode[STIX]{x1D706}}\approx 25$
and
 $M_{t}=0.21$
. Vertical dashed lines at
 $x_{1}$
,
 $x_{2^{\prime }}$
and
 $x_{2}$
for reference.

There is some freedom in choosing the sponge parameters,
 $A$
,
 $n_{1}$
and
 $n_{2}$
. However, we found that some combinations were potentially unstable. From numerical experimentation we found that
 $(n_{1},n_{2})=(1,1)$
in
 $S_{1}$
and (2, 0) in
 $S_{2}$
provide adequate results such that the simulations are stable and both turbulence and shock statistics are insensitive to the parameters in the sponge region.
2.3 Averages and characteristic locations
It is often convenient to decompose the flow using Reynolds decomposition, that is
 $f=\langle f\rangle +f^{\prime }$
where
 $\langle f\rangle$
is a suitably defined mean and
 $f^{\prime }$
is the fluctuating part which satisfies
 $\langle f^{\prime }\rangle =0$
. In compressible flows, it is also common to use Favre averages (e.g. Gatski & Bonnet Reference Gatski and Bonnet2009) defined as
 $\tilde{f}=\langle \unicode[STIX]{x1D70C}f\rangle /\langle \unicode[STIX]{x1D70C}\rangle$
. The fluctuations around the Favre averages are denoted by
 $f^{\prime \prime }$
such that
 $f=\tilde{f}+f^{\prime \prime }$
and
 $\langle \unicode[STIX]{x1D70C}f^{\prime \prime }\rangle =0$
.
The specific space over which averaging is done depends naturally on the flow of interest. In the present simulations, since the streamwise direction (
 $x$
) is not homogeneous, averages can be taken over the other two homogeneous directions, that is over
 $y$
–
 $z$
planes. Furthermore, since the flows presented here are also statistically stationary, one can improve statistical convergence by averaging over time as well. Unless otherwise noted, angular brackets represent plane and time averages in what follows.
We make a few remarks here to identify specific characteristic locations in the flow. Figure 2(a) shows a typical well-resolved (as shown in § 2.4) distribution of the streamwise Reynolds stress,
 $R_{11}=\widetilde{u^{\prime \prime }u^{\prime \prime }}$
, as a function of the streamwise direction. Turbulence enters the domain from the left, and it undergoes a viscous decay. As turbulence reaches the vicinity of the shock, these Reynolds stresses, as well as other thermodynamic properties such as
 $p$
(figure 2
b), begin to increase. The local minimum thus formed has been defined in the literature as the upstream location of the shock and will be denoted here by a subscript 1. Assessing amplification or reduction across the shock can be then performed by normalizing a quantity of interest by its value at this upstream condition. The non-dimensional parameters that characterize the flow are naturally defined at
 $x_{1}$
. These are the mean Mach number of the incoming flow (
 $M\equiv \langle u_{1}\rangle /\langle c\rangle$
) which for a stationary shock is also the so-called shock Mach number, the Taylor Reynolds number (
 $R_{\unicode[STIX]{x1D706}}\equiv \langle \unicode[STIX]{x1D70C}\rangle u_{1,rms}\unicode[STIX]{x1D706}/\langle \unicode[STIX]{x1D707}\rangle$
) and the turbulent Mach number (
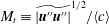 $M_{t}\equiv \widetilde{|\boldsymbol{u}^{\prime \prime }\boldsymbol{u}^{\prime \prime }|}^{1/2}/\langle c\rangle$
).
Inside the shock region, stresses reach a peak at a location where the pressure gradient is largest. Reynolds stresses then decrease and reach a downstream minimum where pressure attains a maximum. This location, identified as
 $2^{\prime }$
, indicates the end of the region dominated by shock compression. An expansion wave would follow behind the shock (Larsson & Lele Reference Larsson and Lele2009) where the stress reaches its downstream maximum. This process is dominated by pressure-dilatation exchanges that transfer internal energy to turbulent kinetic energy (Lee et al.
Reference Lee, Lele and Moin1993). The Reynolds stresses increase but eventually viscous dissipation dominates the energy exchanges and turbulence undergoes again a classical viscous decay. The local maximum of
 $R_{11}$
downstream of the shock is denoted here by a subscript 2.
2.4 Resolution and DNS database
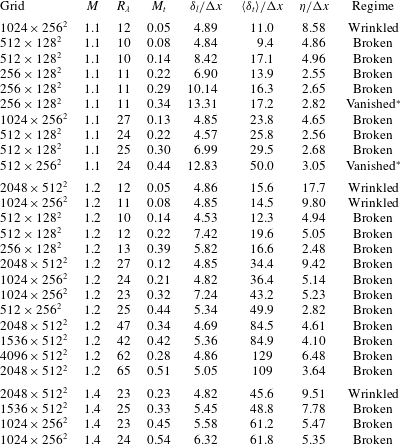
DNS database of isotropic turbulence (IT) passing through a shock: number of grid points, mean Mach number (
 $M$
), turbulent Mach (
 $M_{t}$
), Taylor Reynolds numbers (
 $R_{\unicode[STIX]{x1D706}}$
), normalized shock thicknesses and Kolmogorov length scale. The wrinkled and broken regimes correspond to the criterion in Donzis (Reference Donzis2012b
). Conditions for vanished regimes (marked with
 $^{\ast }$
) are computed at the upstream minimum for pressure (§ 3.3).

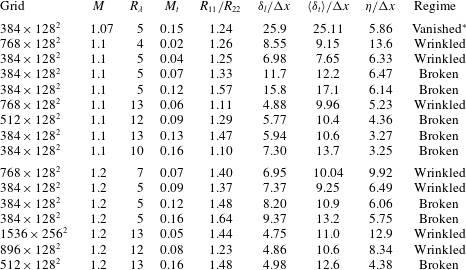
DNS database of anisotropic turbulence (SDT).

In table 1 we summarize the parameters for the simulations of STI with IT. The incoming turbulence is at turbulent Mach numbers ranging from 0.05 to 0.54 and Reynolds numbers up to 65. These parameters are obtained at location
 $x_{1}$
. The table also includes the ratio of Kolmogorov length scale to grid size
 $\unicode[STIX]{x1D702}/\unicode[STIX]{x0394}x$
, and the shock thickness to grid size,
 $\unicode[STIX]{x1D6FF}_{l}/\unicode[STIX]{x0394}x$
, where (Thompson Reference Thompson1984)
 $\unicode[STIX]{x1D6FF}_{l}=2k_{1}\langle \unicode[STIX]{x1D707}_{1}\rangle /(\langle c_{1}\rangle \langle \unicode[STIX]{x1D70C}_{1}\rangle \unicode[STIX]{x0394}M)$
with
 $k_{1}=(4/3+(\unicode[STIX]{x1D6FE}-1)/Pr)$
. In our simulations
 $k_{1}\sim O(1)$
. We have also included the classification of the regime of the interaction based on the mechanism in Donzis (Reference Donzis2012b
) where a transition from wrinkled to broken was proposed at
 $M_{t}/\unicode[STIX]{x0394}M\approx 0.6$
, consistent with the regimes observed in the literature (Larsson et al.
Reference Larsson, Bermejo-Moreno and Lele2013; Ryu & Livescu Reference Ryu and Livescu2014).
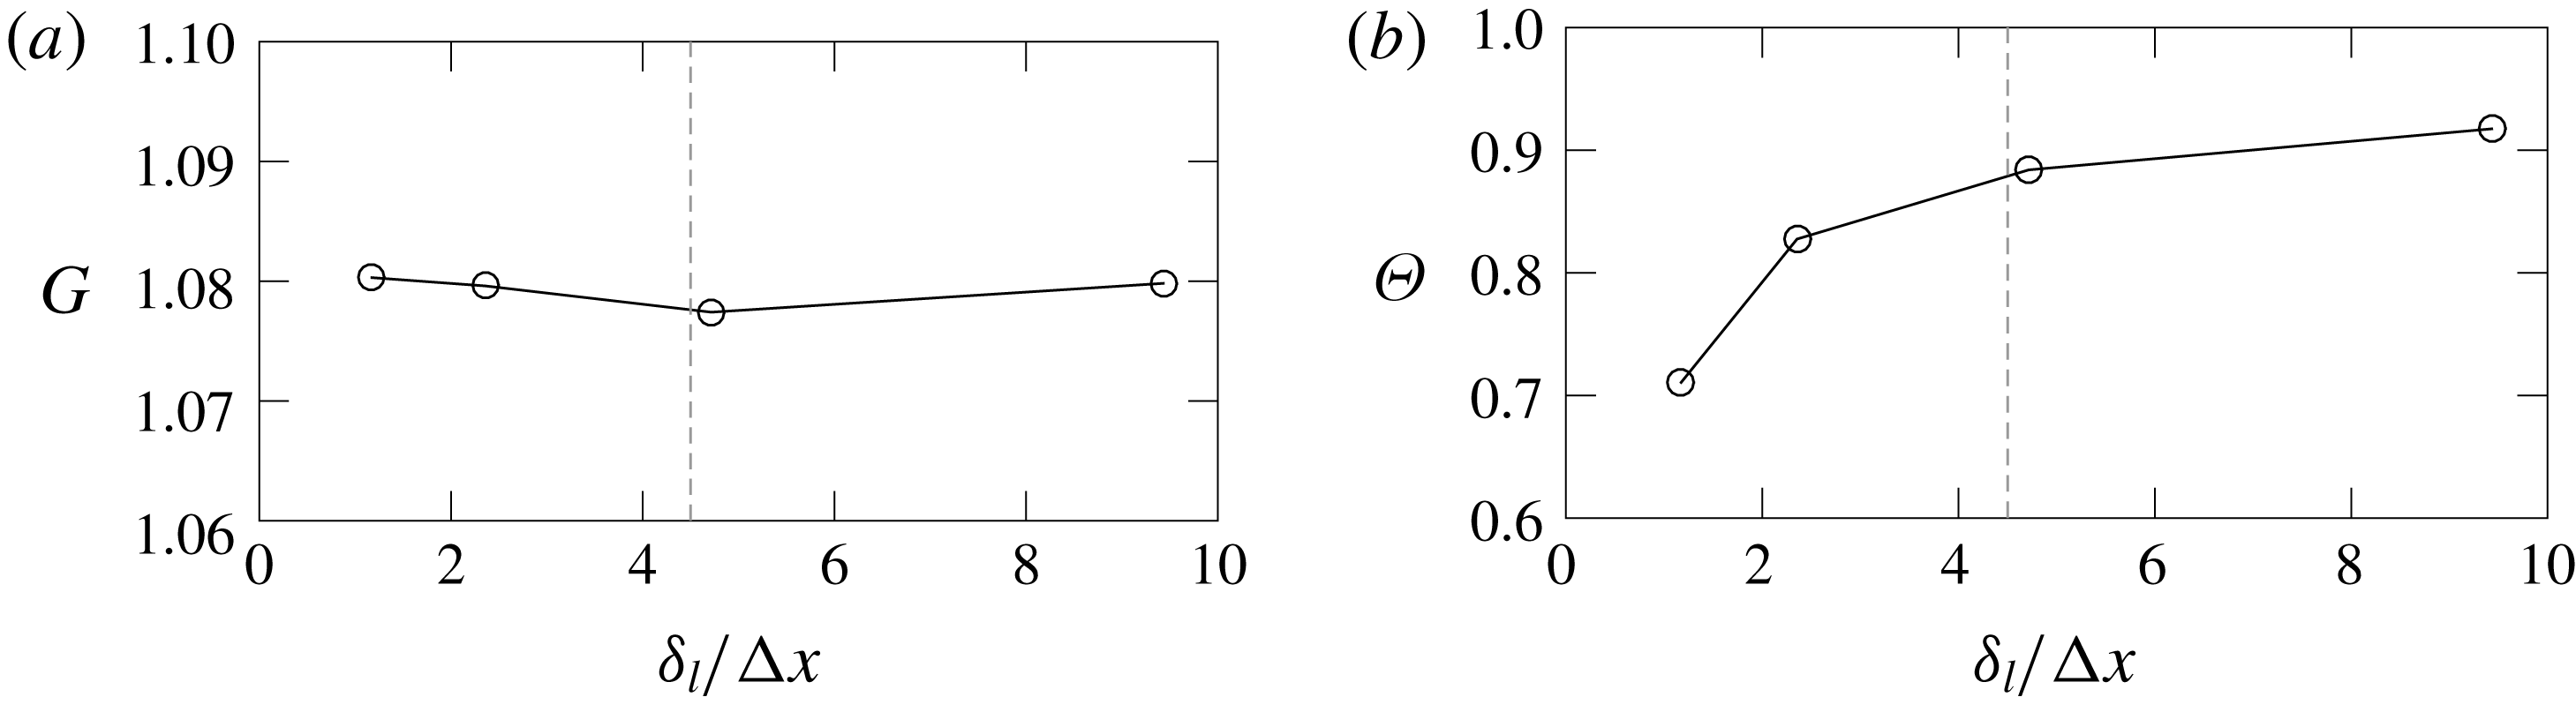
To ensure grid independence, convergence tests were conducted to assess the sensitivity of variables that characterize both large and, more critically, small scales. Two quantities that satisfy these requirements are the streamwise Reynolds stress, specifically its amplification factor, and the maximum dilatation at the shock. The latter is critically sensitive to resolution as it is computed at a location where gradients are largest (inside the viscous shock). In fact, this is a very strict resolution criterion but necessary for well-resolved shock-resolving simulations. In figure 3, we show the typical behaviour of the amplification factor of streamwise velocity,
 $G=R_{11,2}/R_{11,1}$
and r.m.s.-to-mean dilatation
 $\unicode[STIX]{x1D6E9}$
(Donzis Reference Donzis2012b
) as the ratio of shock thickness to grid spacing is increased. We see that beyond
 $\unicode[STIX]{x1D6FF}_{l}/\unicode[STIX]{x0394}x\approx 4.5$
, changes in these quantities are within 2 % and are thus considered grid converged. Similar results have been observed for the other conditions in our database. In addition, we have found (Jagannathan & Donzis Reference Jagannathan and Donzis2016) that a resolution of
 $\unicode[STIX]{x1D702}/\unicode[STIX]{x0394}x\approx 0.5$
is sufficient in isotropic turbulence to capture even fourth-order moments of velocity gradients at the conditions presented here. From tables 1 and 2 we can see that resolving the shock wave provides a stricter resolution criterion. In the table we also include
 $\langle \unicode[STIX]{x1D6FF}_{t}\rangle$
, the average thickness of the shock when turbulence is present (Donzis Reference Donzis2012b
) which is here computed as
 $(\langle u_{2}\rangle -\langle u_{1}\rangle )/(\unicode[STIX]{x2202}\langle u\rangle /\unicode[STIX]{x2202}x)_{max}$
. As expected and consistent with theoretical predictions (Donzis Reference Donzis2012b
), the difference between
 $\unicode[STIX]{x1D6FF}_{l}$
and
 $\langle \unicode[STIX]{x1D6FF}_{t}\rangle$
increases with
 $M_{t}$
. We do note that these definitions are estimates based on the maximum gradient at the shock and upon inspection represent only a fraction of the actual spatial extent occupied by the shock. In fact, even for the most stringent condition, at least 20 grid points are located between
 $x_{1}$
and
 $x_{2}$
(see figure 2). As mentioned above, however, this is for the most stringent cases and, as seen in the tables, most simulations have a larger number of grid points in the shock region. We have also verified grid convergence in the transverse direction since downstream of the shock, the Kolmogorov scale is reduced (Larsson & Lele Reference Larsson and Lele2009). At the most stringent conditions, we see a reduction of
 ${\sim}30\,\%$
in
 $\unicode[STIX]{x1D702}$
which when evaluated with our resolutions (tables 1 and 2) results in
 $\unicode[STIX]{x1D702}/\unicode[STIX]{x0394}y\approx 1.8$
which is also grid converged (Jagannathan & Donzis Reference Jagannathan and Donzis2016) for all cases here.
Grid-independence test with different
 $\unicode[STIX]{x1D6FF}_{l}/\unicode[STIX]{x0394}x$
at
 $M=1.1$
,
 $M_{t}=0.21$
and
 $R_{\unicode[STIX]{x1D706}}\approx 25$
for (a) amplification factor and (b) r.m.s.-to-mean dilatation. The dashed line represents
 $\unicode[STIX]{x1D6FF}_{l}/\unicode[STIX]{x0394}x=4.5$
.

To ensure the sponges downstream of the shock have negligible effect on the interaction, we have conducted simulations with varying distance between the shock and the sponges,
 $\unicode[STIX]{x1D6E5}$
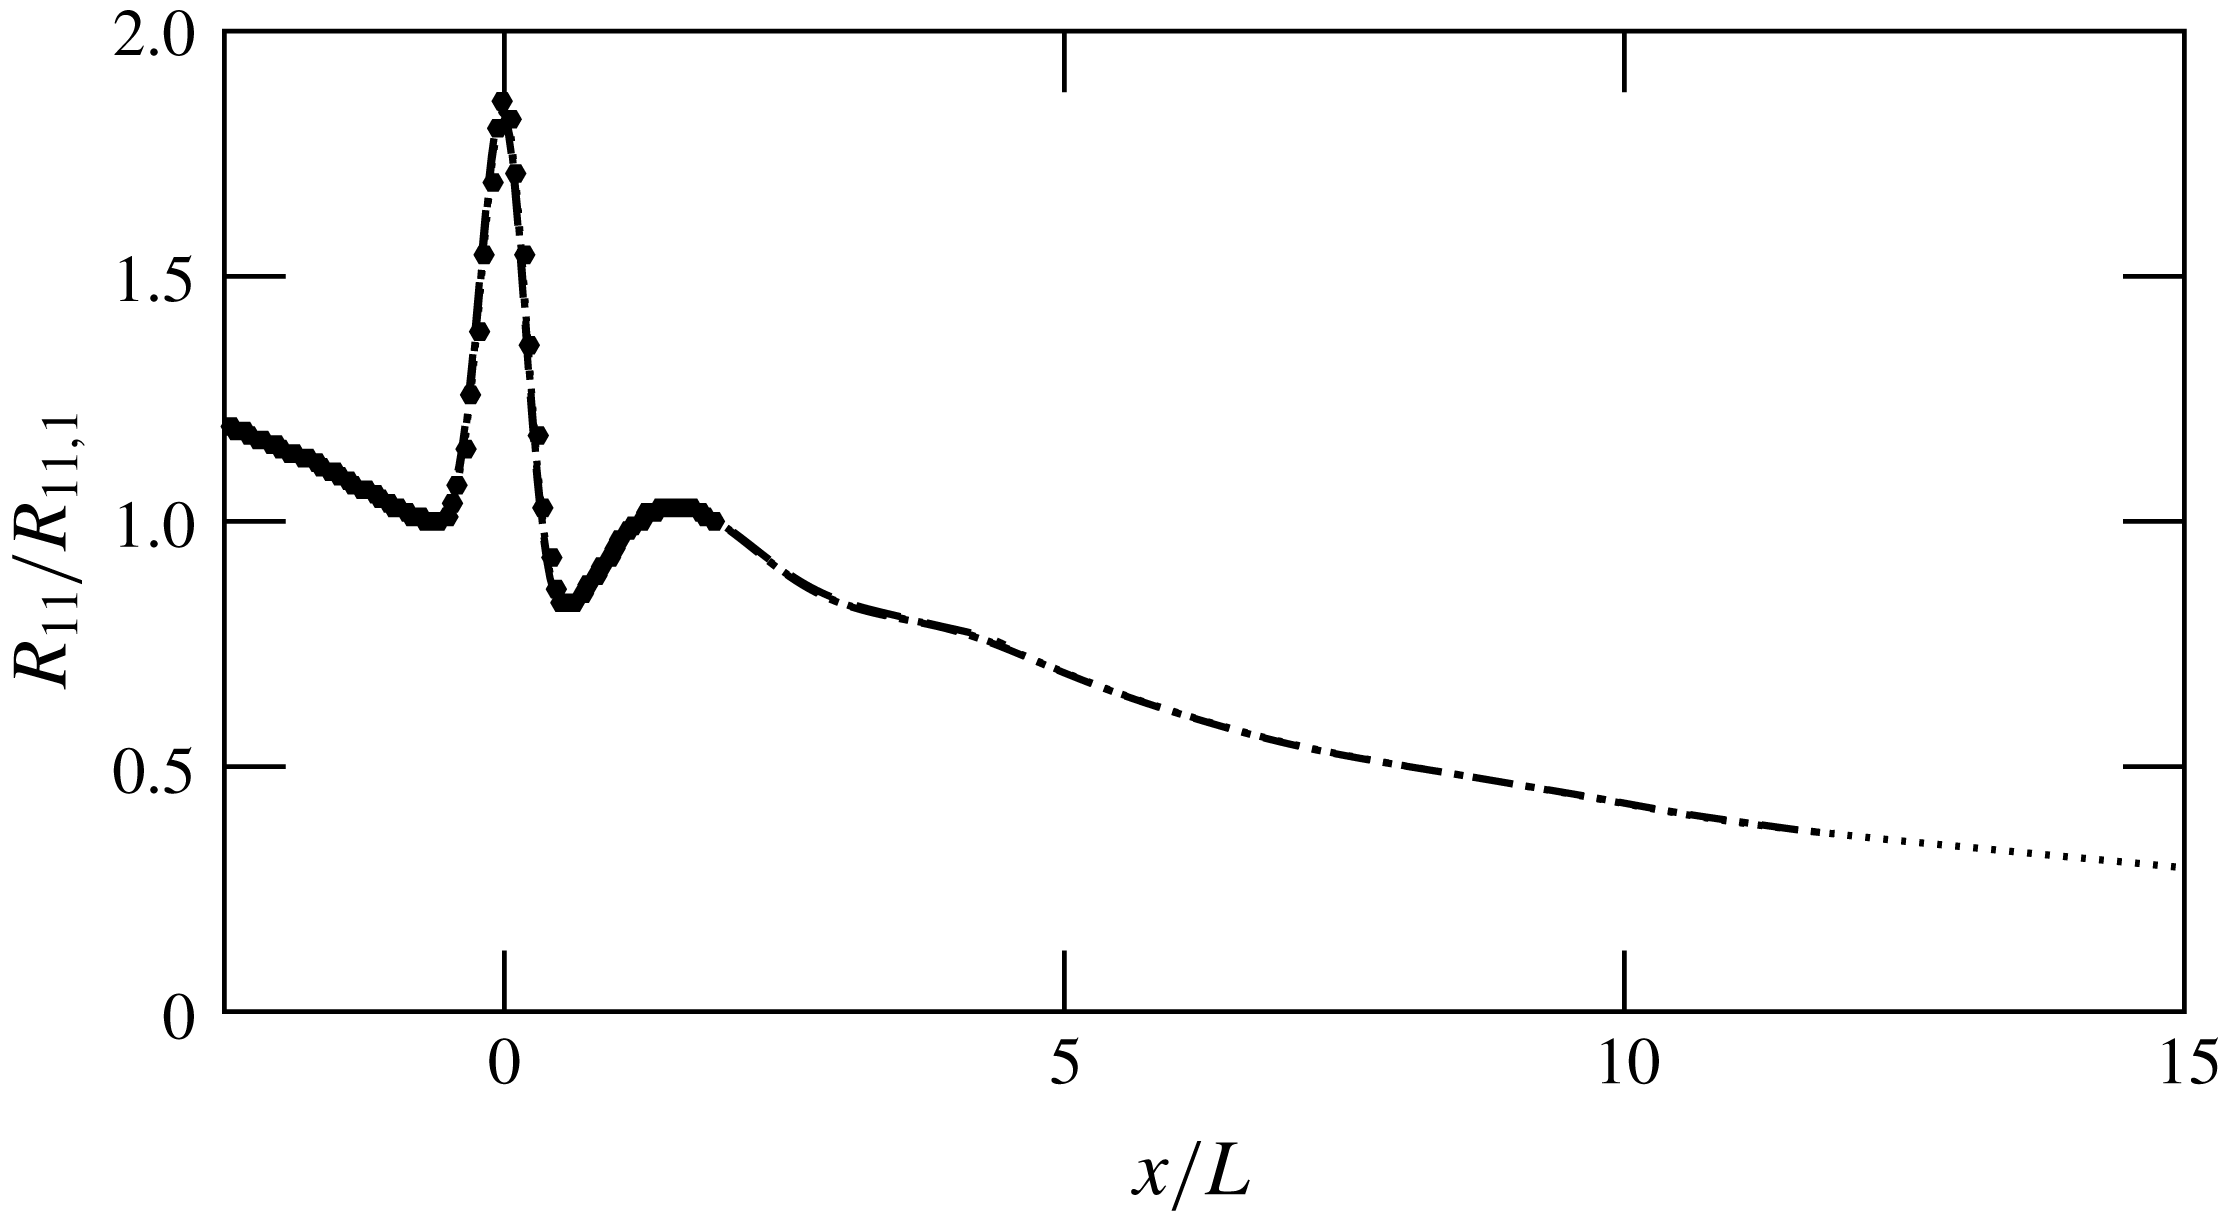
(see figure 1). The results are seen in figure 4 where we show the distribution of
 $R_{11}$
different values of
 $\unicode[STIX]{x1D6E5}$
. While all cases appear to collapse, some shock drifting is actually observed at
 $\unicode[STIX]{x1D6E5}=0.5\unicode[STIX]{x03C0}$
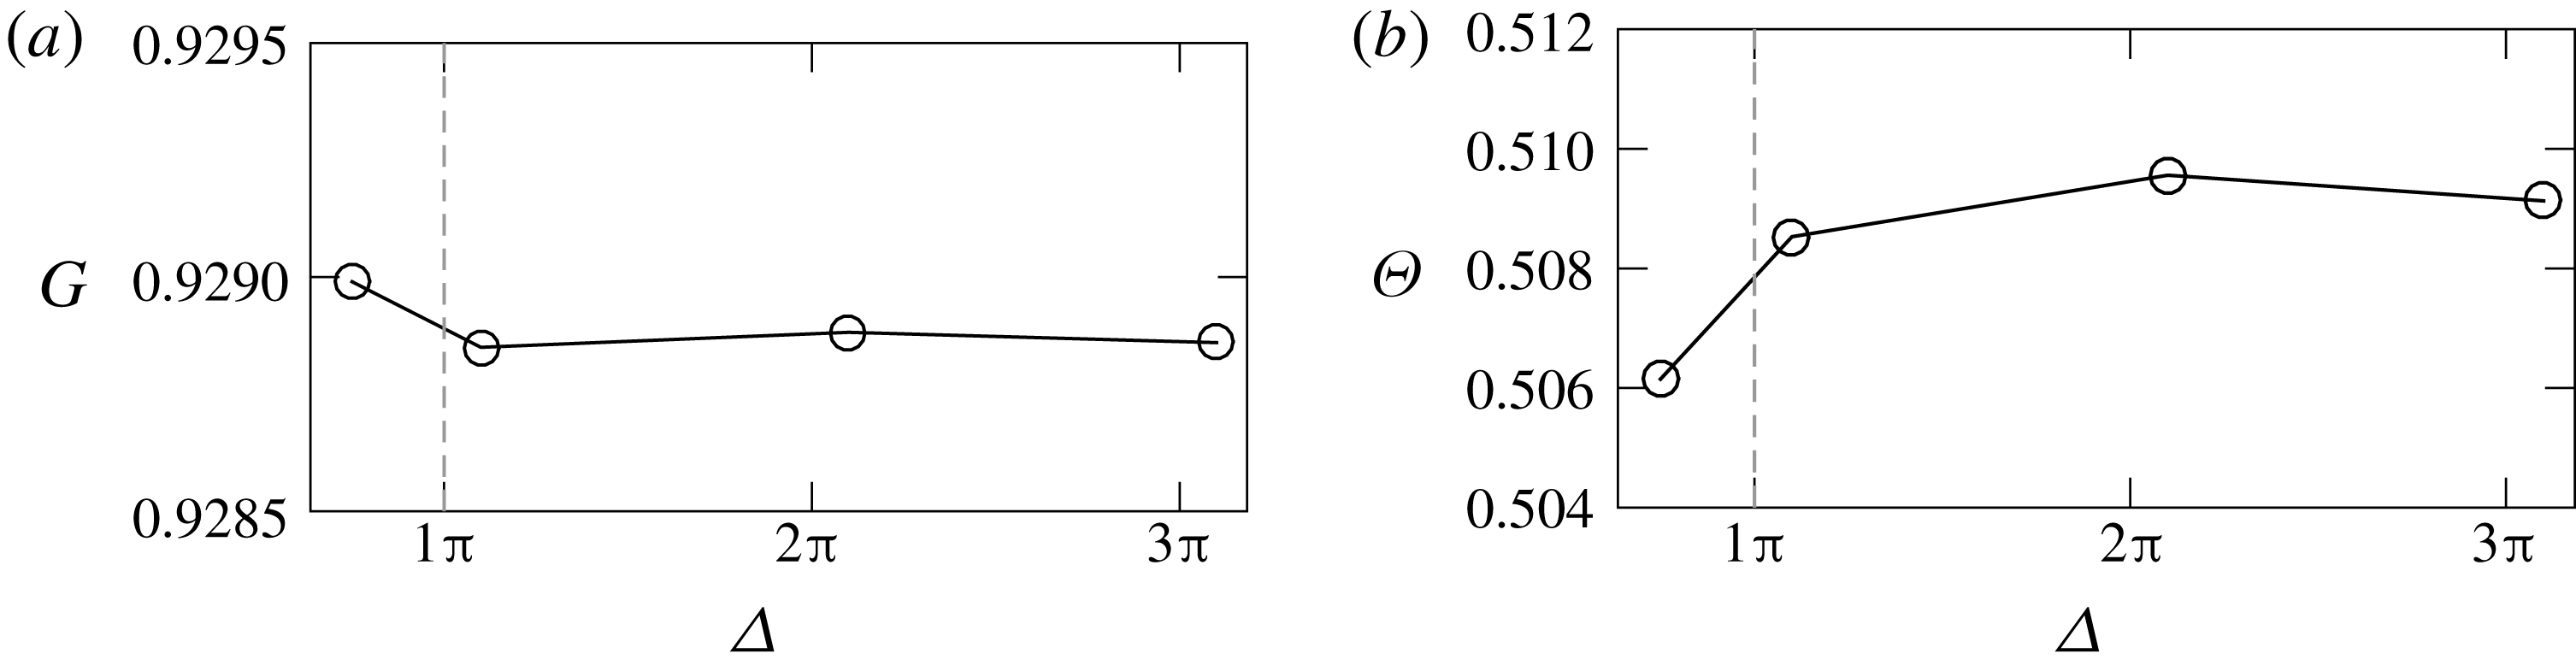
. This is more evident in figure 5 where we present
 $G$
and
 $\unicode[STIX]{x1D6E9}$
for different values of
 $\unicode[STIX]{x1D6E5}$
. Differences in this quantities for
 $\unicode[STIX]{x1D6E5}\gtrsim \unicode[STIX]{x03C0}$
are negligibly small. While data with
 $\unicode[STIX]{x1D6E5}=0.5\unicode[STIX]{x03C0}$
are also close, as a conservative measure especially at high
 $M_{t}$
, we have used
 $\unicode[STIX]{x1D6E5}=\unicode[STIX]{x03C0}$
. For reference, we mention that this distance corresponds to
 $\unicode[STIX]{x0394}\approx 2L$
where
 $L$
is the integral scale of the incoming turbulence.
Distribution of
 $R_{11}$
at
 $M=1.2$
,
 $M_{t}=0.23$
and
 $R_{\unicode[STIX]{x1D706}}\approx 10$
with
 $\unicode[STIX]{x1D6E5}=0.5\unicode[STIX]{x03C0}$
(●),
 $1.1\unicode[STIX]{x03C0}$
(dashed),
 $2.2\unicode[STIX]{x03C0}$
(dash-dotted) and
 $3.3\unicode[STIX]{x03C0}$
(dotted).

Test of distance between shock and sponges for (a)
 $G$
and (b)
 $\unicode[STIX]{x1D6E9}$
at
 $M=1.2$
,
 $M_{t}=0.23$
and
 $R_{\unicode[STIX]{x1D706}}\approx 10$
.

3 Turbulent shock jumps and shock structure
3.1 Theoretical background: quasi-equilibrium assumption and truncated integrals
Available results in the literature clearly show that characteristics of STI depend critically on the strength of turbulence (Andreopoulos et al.
Reference Andreopoulos, Agui and Briassulis2000) which is not captured by LIA. The theoretical work of Moeckel (Reference Moeckel1952), Chisnell (Reference Chisnell1955), Whitham (Reference Whitham1958), is also unable to capture the complex behaviour of STI because of its simplified configuration and restrictive assumptions. An alternative view was more recently put forward (Donzis Reference Donzis2012b
), in which it was assumed that the shock, locally, adjusts instantaneously to local flow conditions. This was referred to as the quasi-equilibrium assumption. If conditions are such that QE is satisfied, a shock in a turbulent flow can be treated as consisting of a collection of infinitesimal shocks each obeying RH relations based on local flow conditions. For QE to be valid, the time scale associated with the relaxation of the shock to a new incoming condition should be much shorter than changes in upstream conditions produced by the turbulence. We showed (Donzis Reference Donzis2012b
) that this is justified when
 $K\ll 1$
which is satisfied for virtually all cases in the literature. The main advantage of QE is that it provides a framework in which well-known laminar results can be used to analytically compute mean variables in STI. In this section we use QE to provide analytical results for thermodynamic jumps across the shock. For strong turbulence, however, we first need to introduce a generalization of the analysis (Donzis Reference Donzis2012b
) which requires a redefinition of integrals to compute statistical moments across planes parallel to the shock surface.
Consider a shock in a uniform flow and a quantity
 $q$
that depends on the upstream Mach number,
 $M$
, that is
 $q=q(M)$
. In the presence of turbulent fluctuations, QE allows one to still write
 $q$
as a function of the local instantaneous Mach number, that is
 $q=q(M+m)$
where
 $m$
is the fluctuating Mach number. In general, the
 $n$
th-order moment of
 $q$
is given by the integral
 $$\begin{eqnarray}\langle q^{n}\rangle =\int _{-\infty }^{\infty }q^{n}(M+m)f_{m}(m)\,\text{d}m,\end{eqnarray}$$
where
 $f_{m}(m)$
is the probability density function (p.d.f.) of
 $m$
. Note that
 $M+m$
is to be taken as the relative velocity between the shock and the upstream flow. Thus, while here we consider a stationary shock, this formulation can account for moving shocks by a simple Galilean transformation.
However, the actual functional form of
 $q(M+m)$
may depend on whether the flow is supersonic or subsonic. For example, in locations where the flow is supersonic upstream of the mean location of the shock, the pressure will change according to the RH relations. However, if the flow is subsonic (due to strong negative
 $m$
fluctuations), then RH relations are invalid. This, as argued in Donzis (Reference Donzis2012b
), creates holes in the shock surface.
For the flow to be supersonic one needs
 $M+m>1$
or, in terms of
 $\unicode[STIX]{x0394}M=M-1$
, one needs
 $m>-\unicode[STIX]{x0394}M$
. Similarly subsonic regions correspond to fluctuations that satisfy
 $m<-\unicode[STIX]{x0394}M$
. Thus, we split the integral in (3.1) as
 $$\begin{eqnarray}\langle q^{n}\rangle =\int _{-\unicode[STIX]{x0394}M}^{\infty }(q^{{>}})^{n}f_{m}(m)\,\text{d}m+\int _{-\infty }^{-\unicode[STIX]{x0394}M}(q^{{<}})^{n}f_{m}(m)\,\text{d}m,\end{eqnarray}$$
where
 $q^{{>}}$
and
 $q^{{<}}$
are the functional form of
 $q$
in supersonic and subsonic regions, respectively. For short, the supersonic and subsonic integrals will be denoted by
 $\langle q^{n}\rangle ^{{>}}$
and
 $\langle q^{n}\rangle ^{{<}}$
, respectively, that is
 $$\begin{eqnarray}\langle q^{n}\rangle =\langle q^{n}\rangle ^{{>}}+\langle q^{n}\rangle ^{{<}}.\end{eqnarray}$$
One can, for example, compute moments of the fluctuating Mach number itself, i.e.
 $q=m$
, for which supersonic and subsonic expressions are the same (
 $q^{{>}}=q^{{<}}$
). In this case we have:
 $$\begin{eqnarray}\langle m^{n}\rangle ^{{>}}=\int _{-\unicode[STIX]{x0394}M}^{\infty }m^{n}f_{m}(m)\,\text{d}m,\quad \langle m^{n}\rangle ^{{<}}=\int _{-\infty }^{-\unicode[STIX]{x0394}M}m^{n}f_{m}(m)\,\text{d}m.\end{eqnarray}$$
Obviously,
 $\langle m^{0}\rangle =1$
and
 $\langle m\rangle =0$
. Also note that by definition we can write the turbulent Mach number as:
 $$\begin{eqnarray}M_{t}=\sqrt{3}\langle m^{2}\rangle ^{1/2}=\sqrt{3}\left(\int _{-\infty }^{\infty }m^{2}f_{m}(m)\,\text{d}m\right)^{1/2}\end{eqnarray}$$
regardless of the specific velocity distribution.
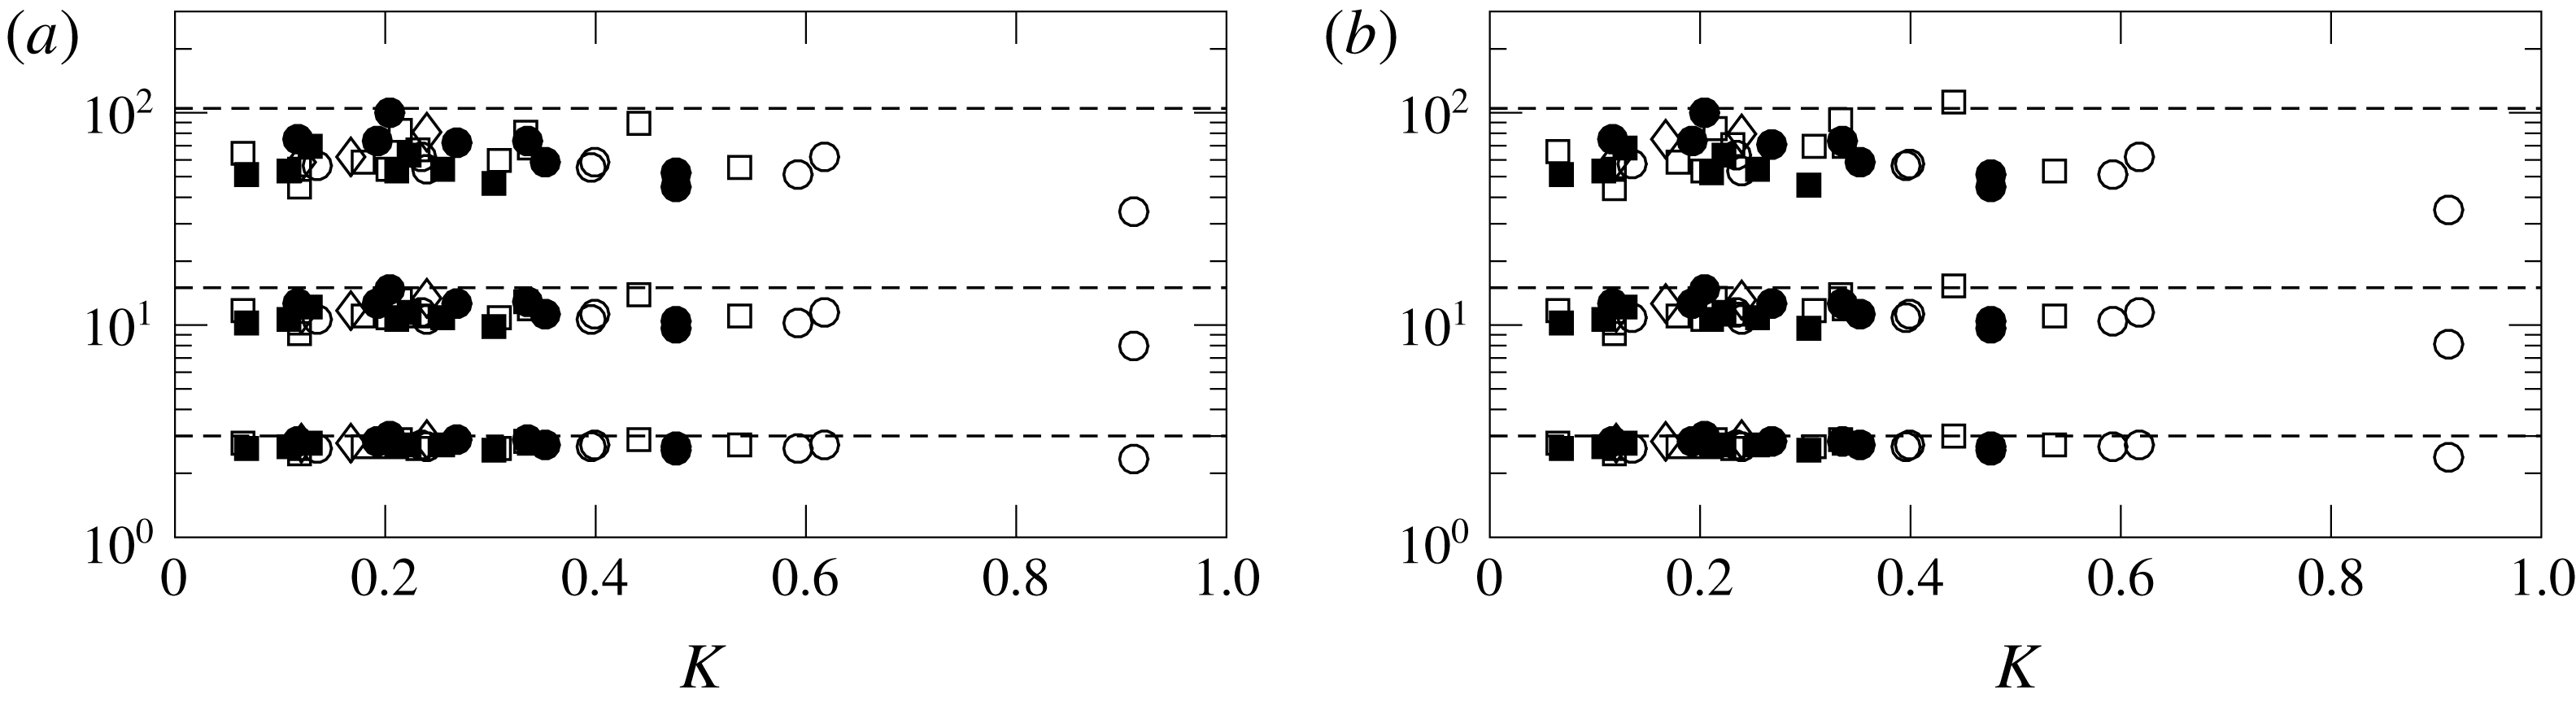
It is well known that the velocity field in isotropic turbulence is generally well represented by a Gaussian distribution (Batchelor Reference Batchelor1953; Monin & Yaglom Reference Monin and Yaglom1975). This is indeed the case for our data as seen in figure 6 where we show even moments of the streamwise velocity component and Mach number from our DNS database. Gaussian values are included as horizontal dashed lines for reference. We also see a slight sub-Gaussian behaviour for very high orders which has also been observed before (Noullez et al.
Reference Noullez, Frisch, Wallace, Lempert and Miles1997; Jimenez Reference Jimenez1998). In any case, our results will rely on at most second-order statistics for which a Gaussian behaviour is an excellent approximation. For reference, the first few truncated moments of
 $m$
for a Gaussian distribution are shown in appendix A.
Even moments of (a) velocity fluctuation
 $\langle u^{n}\rangle /\langle u^{2}\rangle ^{n/2}$
and (b) Mach number fluctuation
 $\langle m^{n}\rangle /\langle m^{2}\rangle ^{n/2}$
as functions of
 $K$
at location 1 for all the simulations in tables 1 and 2:
 $M=1.1$
(circles),
 $M=1.2$
(squares) and
 $M=1.4$
(diamonds). Open and closed symbols are for IT and SDT simulations. From bottom to top
 $n=4$
, 6 and 8. Dashed lines correspond to Gaussian values at 3, 15 and 105, respectively.

In Donzis (Reference Donzis2012b
) we argued that, consistent with QE, holes in the shocks are caused by locally subsonic conditions. Then
 $\langle m^{0}\rangle ^{{<}}$
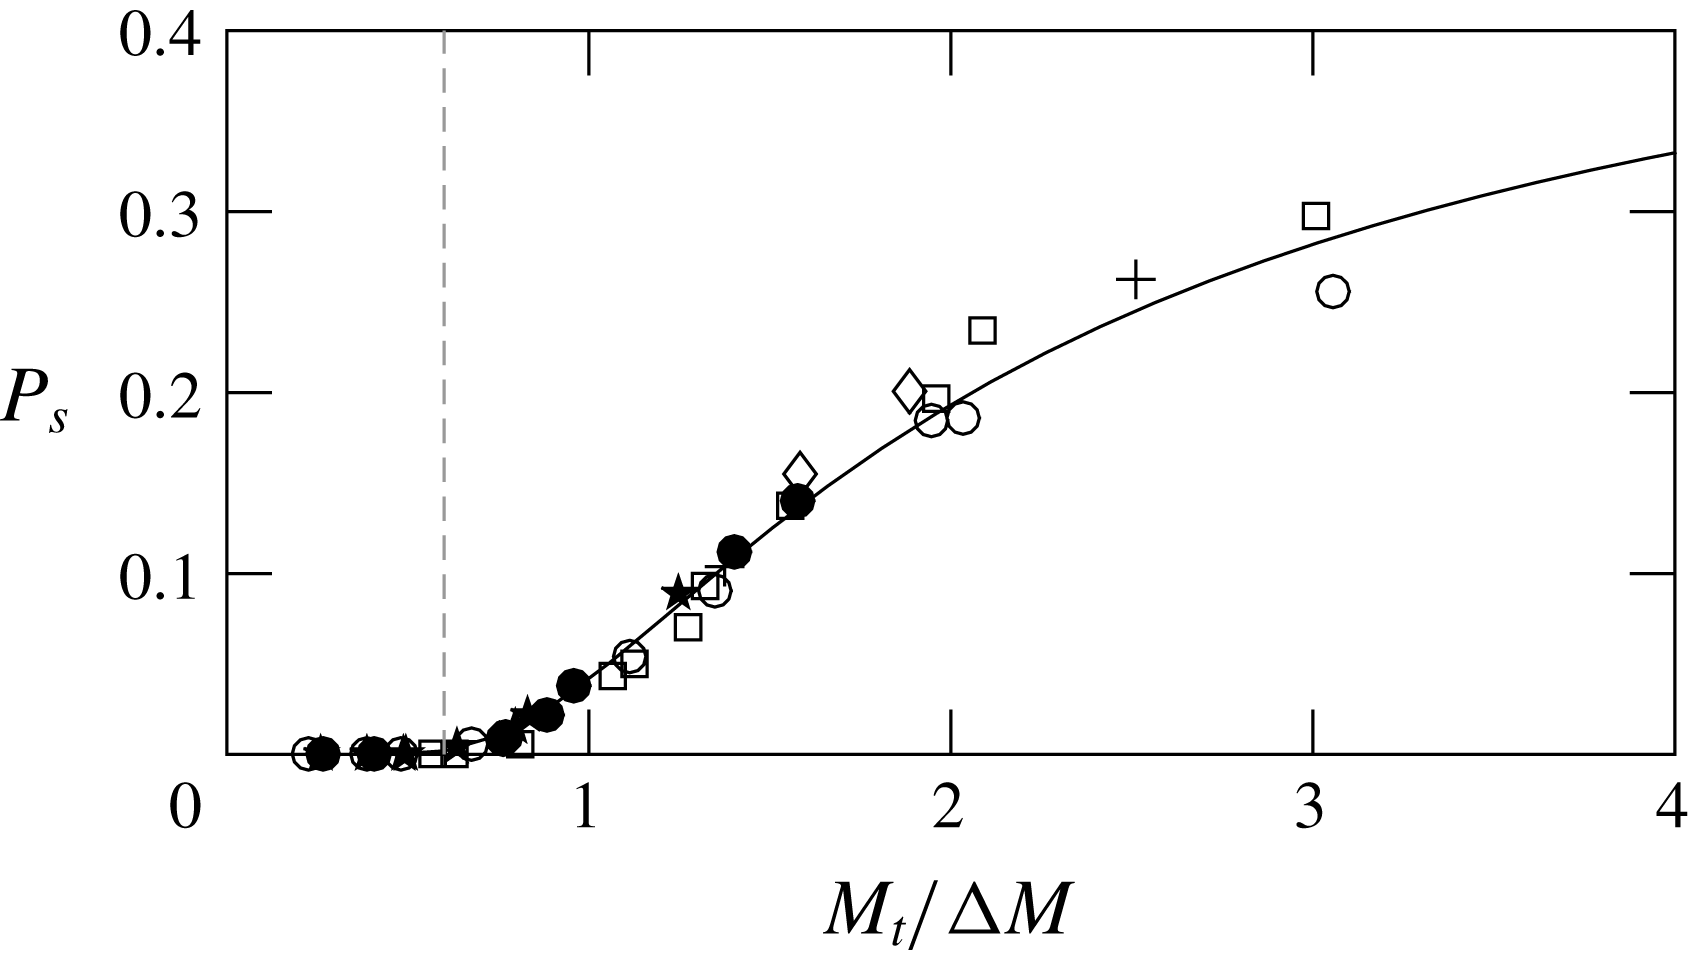
would represent the fraction of the shock with subsonic regions and, thus, holes. This analytical form is shown in figure 7. One can see that the subsonic fraction upstream of the shock is negligible for
 $M_{t}/\unicode[STIX]{x0394}M\lesssim 0.6$
but grows quickly with
 $M_{t}/\unicode[STIX]{x0394}M$
beyond that. Thus, one expects to observe holes only at
 $M_{t}/\unicode[STIX]{x0394}M\gtrsim 0.6$
(Donzis Reference Donzis2012b
) in what is now called the broken regime. This criterion has indeed been supported by more recent DNS data (Larsson et al.
Reference Larsson, Bermejo-Moreno and Lele2013). In the figure we also include results from our own DNS taken as the fraction of subsonic regions observed at
 $x_{1}$
. The excellent agreement supports both the Gaussian assumption for
 $m$
as well as the criterion
 $M_{t}/\unicode[STIX]{x0394}M=0.6$
to delineate the boundary between wrinkled and broken regimes. The last column in tables 1 and 2 indicates the regime based on this criterion.
Probability of subsonic regions upstream of the shock. Solid line: theoretical
 $P_{s}=P(m<-\unicode[STIX]{x0394}M)$
with Gaussian p.d.f. for
 $m$
. Symbols for DNS data at
 $R_{\unicode[STIX]{x1D706}}\approx 5$
(stars),
 $R_{\unicode[STIX]{x1D706}}\approx 10$
(circles),
 $R_{\unicode[STIX]{x1D706}}\approx 25$
(squares),
 $R_{\unicode[STIX]{x1D706}}\approx 45$
(diamonds) and
 $R_{\unicode[STIX]{x1D706}}\approx 65$
(plus signs). Open and closed symbols are for IT and SDT simulations, respectively. Grey dashed line at
 $M_{t}/\unicode[STIX]{x0394}M=0.6$
for reference.

3.2 Analytical solutions of turbulent shock jumps
3.2.1 Density, pressure and temperature
The Rankine–Hugoniot relations, which relate upstream and downstream conditions of a shock in a uniform flow, are a function of
 $M$
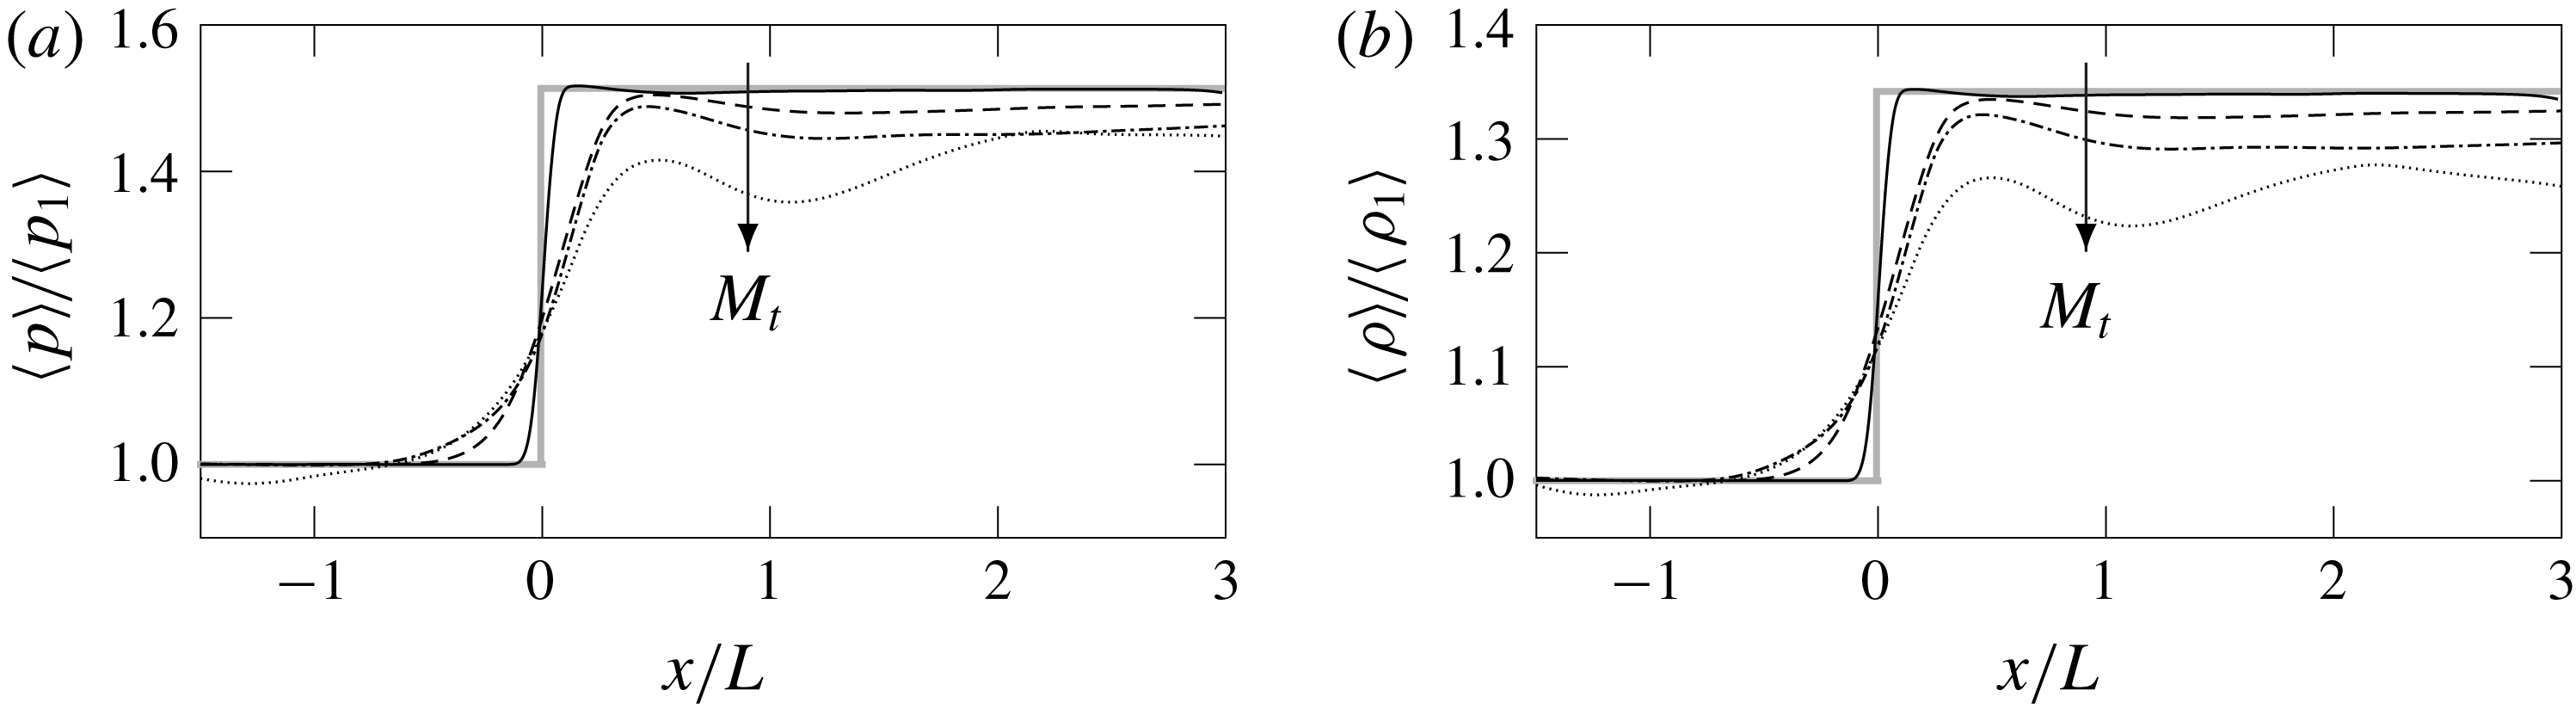
alone. In turbulent flows, however, fluctuations are found to modify these jumps, an effect that is more prominent as the strength of turbulence increases. This can be seen in figure 8 where we plot the distributions of pressure and density for different values of
 $M_{t}$
. As
 $M_{t}$
increases the jumps weaken compared to RH jumps (horizontal dotted lines) at a fixed
 $M$
. These results demonstrate that thermodynamic jumps depend not only on the mean flow but also on turbulent fluctuations. This effect is not captured by classical theories such as LIA whose results depend only on
 $M$
. Our objective here is to obtain analytical solutions for jumps of thermodynamic variables that can account for the effects of turbulence.
(a) Pressure and (b) density profile of normal shocks interacting with isotropic turbulence at
 $M=1.2$
,
 $R_{\unicode[STIX]{x1D706}}\approx 25$
and
 $M_{t}=0.12$
(solid), 0.21 (dashed), 0.32 (dashed-dotted) and 0.44 (dotted). Grey lines correspond to the laminar inviscid limit, namely, RH jumps.

Consider first the ratio of mean density upstream and downstream of the shock, that is,
 $\langle \unicode[STIX]{x1D70C}_{2^{\prime }}\rangle /\langle \unicode[STIX]{x1D70C}_{1}\rangle$
. To compute this ratio we will obtain
 $\langle \unicode[STIX]{x1D70C}_{1}\rangle$
and
 $\langle \unicode[STIX]{x1D70C}_{2^{\prime }}\rangle$
in turn. We first note that in general the mean density ahead of a shock depends on the levels of fluctuations. A convenient way to account for this is to write the instantaneous density upstream of the shock in terms of stagnation conditions,
 $$\begin{eqnarray}\unicode[STIX]{x1D70C}_{1}=\left[\frac{\unicode[STIX]{x1D6FE}-1}{2}(M+m)^{2}+1\right]^{-1/(\unicode[STIX]{x1D6FE}-1)}\unicode[STIX]{x1D70C}_{01},\end{eqnarray}$$
where subscript 0 indicates a stagnation property. If fluctuations are isentropic, then
 $\unicode[STIX]{x1D70C}_{01}$
would be a constant across a plane parallel to the shock (over which averages are taken) independent of local Mach number fluctuations. This is in fact a very reasonable approximation for fluctuations not very far from the mean (Donzis & Jagannathan Reference Donzis and Jagannathan2013) and will, thus, be adopted here.
Expanding (3.6) in Taylor series around the mean Mach number yields:
 $$\begin{eqnarray}\unicode[STIX]{x1D70C}_{1}=\unicode[STIX]{x1D70C}_{1}|_{m=0}+\left(\frac{\unicode[STIX]{x2202}\unicode[STIX]{x1D70C}_{1}}{\unicode[STIX]{x2202}m}\right)_{m=0}m+\frac{1}{2}\left(\frac{\unicode[STIX]{x2202}^{2}\unicode[STIX]{x1D70C}_{1}}{\unicode[STIX]{x2202}m^{2}}\right)_{m=0}m^{2}+\cdots \,,\end{eqnarray}$$
whose average can then be computed by
 $$\begin{eqnarray}\langle \unicode[STIX]{x1D70C}_{1}\rangle =\int _{-\infty }^{\infty }\unicode[STIX]{x1D70C}_{1}\,f_{m}(m)\,\text{d}m.\end{eqnarray}$$
Combining (3.6)–(3.8) and a Gaussian
 $f_{m}(m)$
(see table 3) we can obtain the final form for the mean upstream density:
 $$\begin{eqnarray}\langle \unicode[STIX]{x1D70C}_{1}\rangle =\mathbb{M}^{-1/(\unicode[STIX]{x1D6FE}-1)}\unicode[STIX]{x1D70C}_{01}+{\textstyle \frac{1}{12}}\mathbb{M}^{(-2\unicode[STIX]{x1D6FE}+1)/(\unicode[STIX]{x1D6FE}-1)}[(\unicode[STIX]{x1D6FE}+1)M^{2}-2]\unicode[STIX]{x1D70C}_{01}M_{t}^{2},\end{eqnarray}$$
where, for simplicity in notation, we have defined
 $\mathbb{M}\equiv (\unicode[STIX]{x1D6FE}-1)M^{2}/2+1$
. The first term in (3.9) corresponds to the laminar contribution while the second term corresponds to turbulence effects which depend explicitly on both
 $M$
and
 $M_{t}$
. Clearly, as
 $M\rightarrow \infty$
or
 $M_{t}\rightarrow 0$
, the second term vanishes, as expected.
Under the QE assumption, the density immediately downstream of the shock (i.e. location
 $2^{\prime }$
) will be given by RH expressions using the local Mach number, that is
 $$\begin{eqnarray}\unicode[STIX]{x1D70C}_{2^{\prime }}^{{>}}=\frac{(\unicode[STIX]{x1D6FE}+1)(M+m)^{2}}{(\unicode[STIX]{x1D6FE}-1)(M+m)^{2}+2}\unicode[STIX]{x1D70C}_{1}.\end{eqnarray}$$
The superscript
 $^{{>}}$
has been added to emphasize that shock relations are valid only for supersonic regions. Using (3.6), the expression becomes:
 $$\begin{eqnarray}\unicode[STIX]{x1D70C}_{2^{\prime }}^{{>}}=\left[\frac{(\unicode[STIX]{x1D6FE}+1)(M+m)^{2}}{(\unicode[STIX]{x1D6FE}-1)(M+m)^{2}+2}\right]\left[\frac{\unicode[STIX]{x1D6FE}-1}{2}(M+m)^{2}-1\right]^{-1/(\unicode[STIX]{x1D6FE}-1)}\unicode[STIX]{x1D70C}_{01}.\end{eqnarray}$$
In subsonic regions this expression is clearly invalid and, thus, averages need to be taken using the split form in (3.3). For subsonic regions, where shock holes appear, one can assume that variables will approximately retain their upstream value. That is,
 $\unicode[STIX]{x1D70C}_{2^{\prime }}^{{<}}\approx \unicode[STIX]{x1D70C}_{1}$
. This assumption is indeed supported by observations of instantaneous density profiles in the broken regime (e.g. Larsson & Lele Reference Larsson and Lele2009). Hence, the average downstream density is given by:
 $$\begin{eqnarray}\langle \unicode[STIX]{x1D70C}_{2^{\prime }}\rangle =\langle \unicode[STIX]{x1D70C}_{2^{\prime }}^{{>}}\rangle ^{{>}}+\langle \unicode[STIX]{x1D70C}_{1}\rangle ^{{<}}.\end{eqnarray}$$
Again, using Taylor series for (3.11) and substituting into (3.12) one can integrate the expressions analytically with
 $f_{m}(m)$
Gaussian, to obtain
 $$\begin{eqnarray}\displaystyle \langle \unicode[STIX]{x1D70C}_{2^{\prime }}\rangle & = & \displaystyle \left[\frac{(\unicode[STIX]{x1D6FE}+1)M^{2}}{(\unicode[STIX]{x1D6FE}-1)M^{2}+2}\right]\mathbb{M}^{-1/(\unicode[STIX]{x1D6FE}-1)}\unicode[STIX]{x1D70C}_{01}\langle m^{0}\rangle ^{{>}}-\frac{\unicode[STIX]{x1D6FE}+1}{2}M(M^{2}-2)\mathbb{M}^{(-2\unicode[STIX]{x1D6FE}+1)/(\unicode[STIX]{x1D6FE}-1)}\unicode[STIX]{x1D70C}_{01}\langle m\rangle ^{{>}}\nonumber\\ \displaystyle & & \displaystyle +\,\frac{\unicode[STIX]{x1D6FE}+1}{8}\mathbb{M}^{(-3\unicode[STIX]{x1D6FE}+2)/(\unicode[STIX]{x1D6FE}-1)}[(\unicode[STIX]{x1D6FE}+1)M^{4}-(6\unicode[STIX]{x1D6FE}+4)M^{2}+4]\unicode[STIX]{x1D70C}_{01}\langle m^{2}\rangle ^{{>}}\nonumber\\ \displaystyle & & \displaystyle +\,\mathbb{M}^{-1/(\unicode[STIX]{x1D6FE}-1)}\unicode[STIX]{x1D70C}_{01}\langle m^{0}\rangle ^{{<}}-M\mathbb{M}^{-\unicode[STIX]{x1D6FE}/(\unicode[STIX]{x1D6FE}-1)}\unicode[STIX]{x1D70C}_{01}\langle m\rangle ^{{<}}\nonumber\\ \displaystyle & & \displaystyle +\,\frac{1}{4}\mathbb{M}^{(-2\unicode[STIX]{x1D6FE}+1)/(\unicode[STIX]{x1D6FE}-1)}[(\unicode[STIX]{x1D6FE}+1)M^{2}-2]\unicode[STIX]{x1D70C}_{01}\langle m^{2}\rangle ^{{<}},\end{eqnarray}$$
which, though very complicated, provides an analytical closed form for the mean density downstream of a shock as a function of both
 $M$
and
 $M_{t}$
.
Thus the density jump across a shock in a turbulent flow with mean Mach number
 $M$
and turbulent Mach number
 $M_{t}$
can be written as
 $$\begin{eqnarray}\frac{\langle \unicode[STIX]{x1D70C}_{2^{\prime }}\rangle }{\langle \unicode[STIX]{x1D70C}_{1}\rangle }=g_{\unicode[STIX]{x1D70C}}(M,M_{t}),\end{eqnarray}$$
where
 $g_{\unicode[STIX]{x1D70C}}(M,M_{t})$
is the ratio of (3.13) and (3.6).
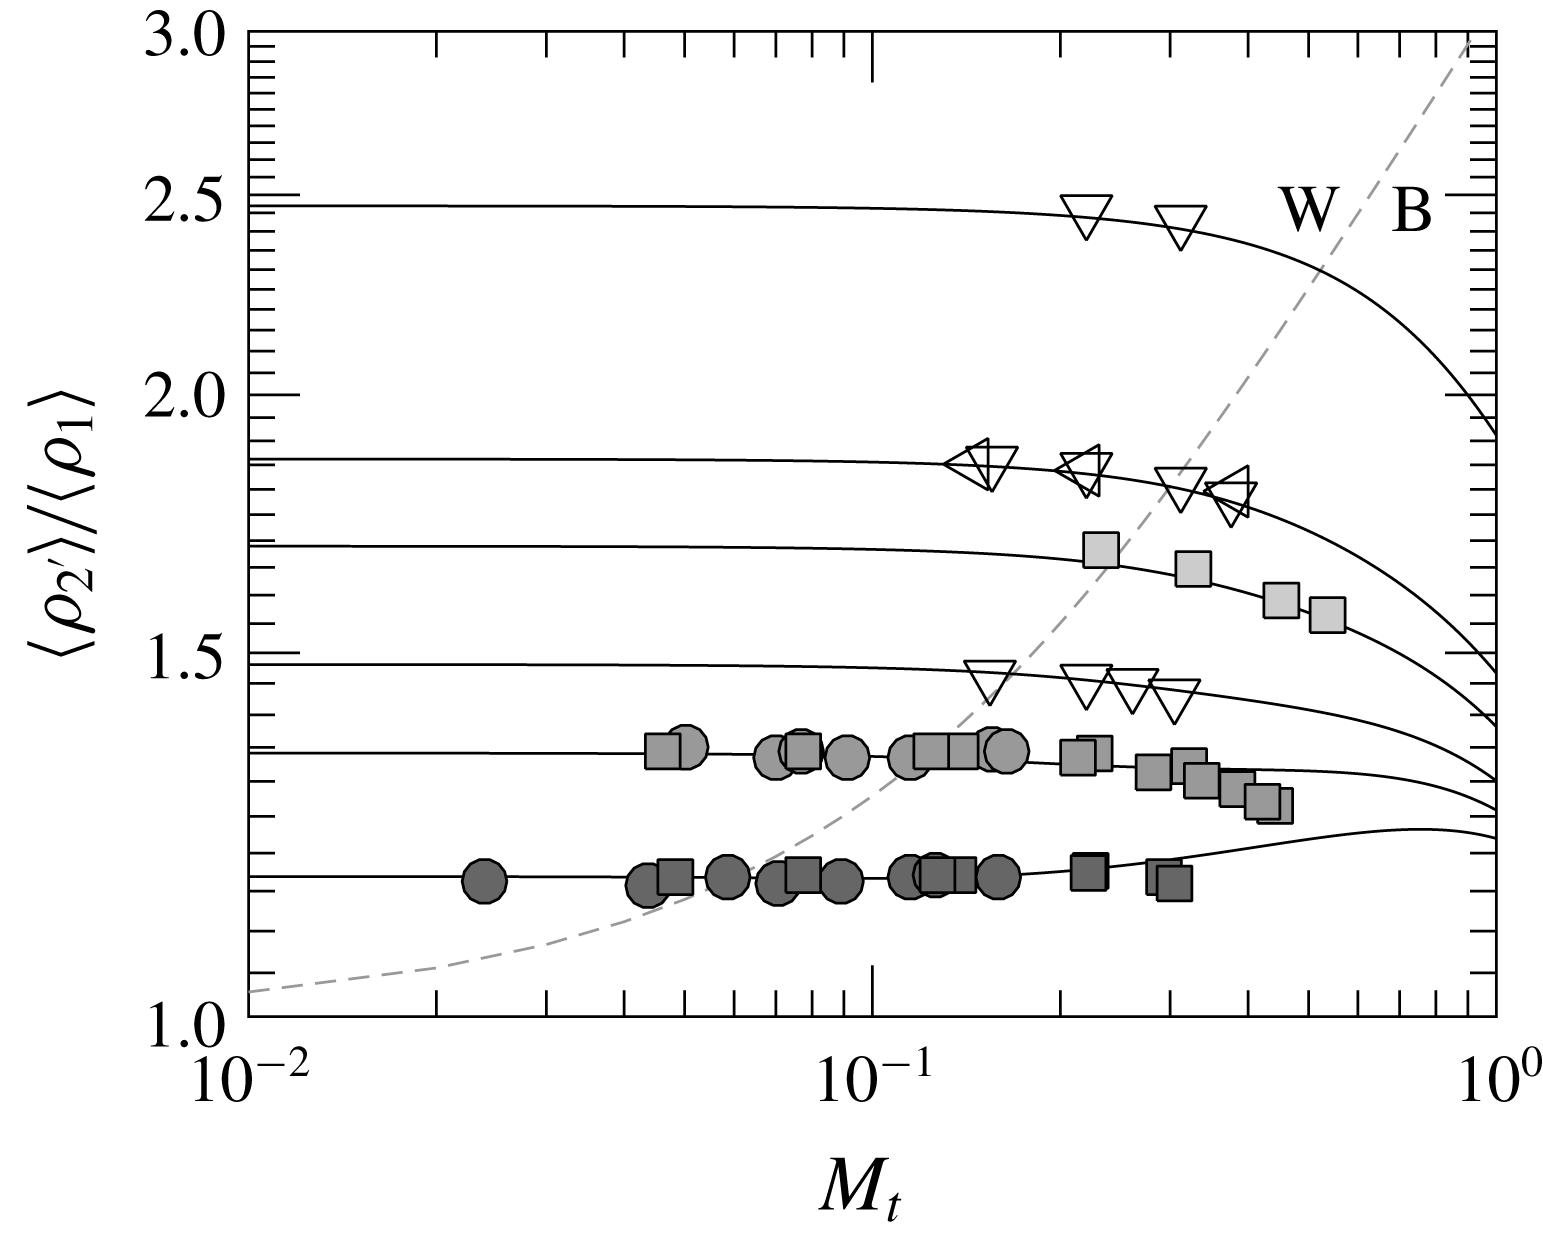
Mean density jumps from IT (squares) and SDT (circle) simulations at
 $M=1.1$
(dark), 1.2 (medium) and 1.4 (light). Other symbols are for Larsson & Lele (Reference Larsson and Lele2009) (▿), and Larsson et al. (Reference Larsson, Bermejo-Moreno and Lele2013) (◃). Solid lines correspond to the analytical solution (3.14) at
 $M=1.1$
, 1.2, 1.28, 1.4, 1.5 and 1.87 (bottom to top). Grey dashed line at
 $M_{t}/\unicode[STIX]{x0394}M=0.6$
separates the wrinkled (W) and broken (B) regimes.

In figure 9 we show
 $\langle \unicode[STIX]{x1D70C}_{2^{\prime }}\rangle /\langle \unicode[STIX]{x1D70C}_{1}\rangle$
from DNS data as a function of
 $M_{t}$
along with (3.14). We see very good agreement between DNS data from various sources (symbols) and the theoretical prediction (solid lines). As expected, laminar conditions are recovered as the turbulent Mach number decreases which is seen as solid lines approach their asymptotic RH value at
 $M_{t}\rightarrow 0$
. It is interesting to note that the effect of turbulent fluctuations depends on the mean Mach number as well. In particular, stronger turbulence effects are observed at higher
 $M$
. This suggests an interaction between means and fluctuations which is not accounted for in classical theories such as LIA. For relatively high
 $M$
, an increase in turbulence intensity measured by
 $M_{t}$
, results in weakened jumps relative to the laminar situation consistent with previous observations (Larsson et al.
Reference Larsson, Bermejo-Moreno and Lele2013). It is worth mentioning here, that mean jumps are unaffected by turbulence within LIA and can thus not capture this behaviour. Predictions using RDT, in turn, were also found (Larsson et al.
Reference Larsson, Bermejo-Moreno and Lele2013) to remain only qualitatively consistent with the data. The quantitative agreement between (3.14) and data observed in figure 9, thus, provides support to the adequacy of the QE coupled with the isentropic assumption of upstream fluctuations to capture this two-way coupling.
We also see a qualitative change in the effect of turbulence as
 $M$
decreases. For relatively weak shocks (low
 $M$
) the theory predicts stronger shock jumps as turbulence intensity increases. Our DNS data do indeed show a consistent, though small, increase with
 $M_{t}$
. This low-
 $M$
conditions may be important in situations around transients crossing sonic conditions such as bodies, vanes or blades accelerating to supersonic speeds or decelerating to subsonic speeds. At
 $M\approx 1.2$
, jumps appear to be only weakly affected by turbulence with jumps remaining fairly constant with
 $M_{t}$
. This transition
 $M$
, however, is not general and depends on the value of
 $\unicode[STIX]{x1D6FE}$
.
In figure 9 we also show a (dashed) line at constant
 $M_{t}/\unicode[STIX]{x0394}M=0.6$
which separates the wrinkled (denoted W in the figure) and broken (denoted B) regimes (Donzis Reference Donzis2012b
). Conditions to the left of the WB line correspond to wrinkled interactions where the planar shock retains its structure and is only mildly distorted by the relatively weak incoming turbulent fluctuations. To the right of that line, the interaction is in the broken regime where holes appear across the shock. As
 $M_{t}$
is increased further, which implies also high
 $K$
, the fundamental assumptions behind QE will become progressively less applicable. These include the inability of the shock to adjust instantaneously to changing conditions due to turbulence fluctuations (Donzis Reference Donzis2012b
) as well as strong three-dimensional effects. This can explain the discrepancy seen between theory and DNS data for high-
 $M_{t}$
low-
 $M$
interactions in figure 9.
Following the same procedure described above, one can obtain expressions for
 $\langle p_{1}\rangle$
,
 $\langle p_{2^{\prime }}\rangle$
,
 $\langle T_{1}\rangle$
and
 $\langle T_{2^{\prime }}\rangle$
. The final result is
 $$\begin{eqnarray}\displaystyle & \displaystyle \frac{\langle p_{2^{\prime }}\rangle }{\langle p_{1}\rangle }=g_{p}(M,M_{t}), & \displaystyle\end{eqnarray}$$
 $$\begin{eqnarray}\displaystyle & \displaystyle \frac{\langle T_{2^{\prime }}\rangle }{\langle T_{1}\rangle }=g_{T}(M,M_{t}). & \displaystyle\end{eqnarray}$$
The details of the derivation and final expressions can be found in appendix A.
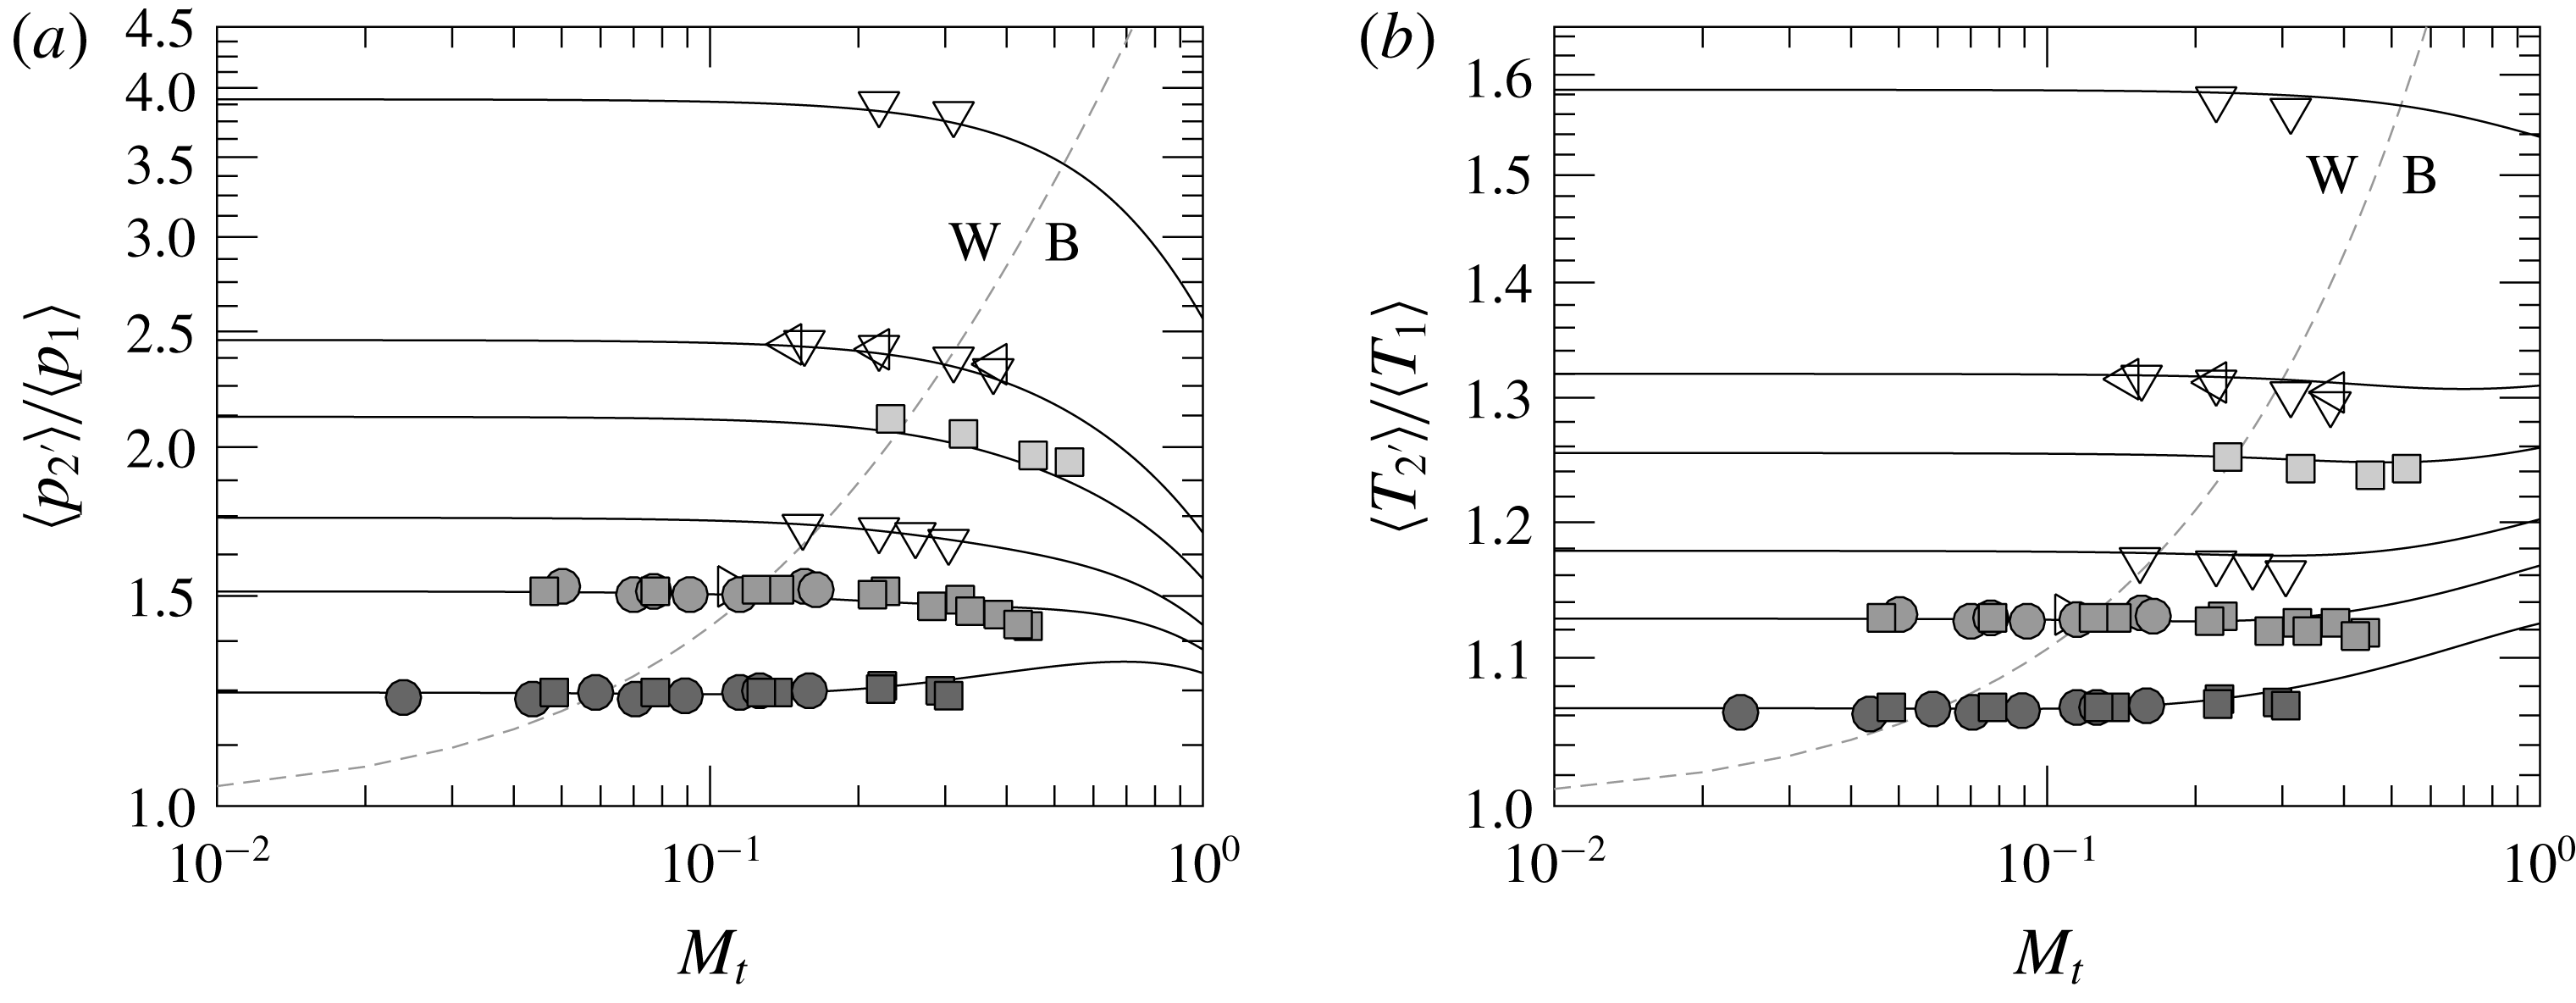
Mean pressure and temperature jumps from IT (squares) and SDT (circles) simulations, Lee et al. (Reference Lee, Lele and Moin1993) (▹), Larsson & Lele (Reference Larsson and Lele2009) (▿) and Larsson et al. (Reference Larsson, Bermejo-Moreno and Lele2013) (◃). Solid lines correspond to the analytical solution (A 5) at
 $M=1.1$
, 1.2, 1.28, 1.4, 1.5 and 1.87 (bottom to top). Grey dashed line at
 $M_{t}/\unicode[STIX]{x0394}M=0.6$
separates the wrinkled (W) and broken (B) regimes.

The comparison between DNS data and (3.15) and (3.16) is shown in figure 10. Again, good agreement is observed at a range of
 $M_{t}$
. While the behaviour of pressure is very similar to that of density we see that that of temperature is not. In fact, trends appear inverted: at low
 $M$
effects are stronger and jumps become larger as
 $M_{t}$
increases. At high
 $M$
, effects are weaker and there is a slight decrease in jumps as
 $M_{t}$
increases.
3.2.2 Comparison to Rankine–Hugoniot relations
While it has been argued in the literature that stronger turbulence leads to weakened shock jumps (Larsson & Lele Reference Larsson and Lele2009), the data presented here suggest a more complex interaction. In particular, whether turbulence weakens or strengthens shock jumps depends on the specific combination of
 $M_{t}$
and
 $M$
. The theoretical results here can, in fact, provide the necessary guidance to understand this observation. Consider the relative change of the density jump
 $\langle \unicode[STIX]{x1D70C}_{2^{\prime }}\rangle /\langle \unicode[STIX]{x1D70C}_{1}\rangle =g_{\unicode[STIX]{x1D70C}}(M,M_{t})$
with respect to the RH jump,
 $g_{\unicode[STIX]{x1D70C}}^{RH}(M)$
:
 $$\begin{eqnarray}R_{\unicode[STIX]{x1D70C}}(M,M_{t})=\frac{g_{\unicode[STIX]{x1D70C}}(M,M_{t})-g_{\unicode[STIX]{x1D70C}}^{RH}(M)}{g_{\unicode[STIX]{x1D70C}}^{RH}(M)}.\end{eqnarray}$$
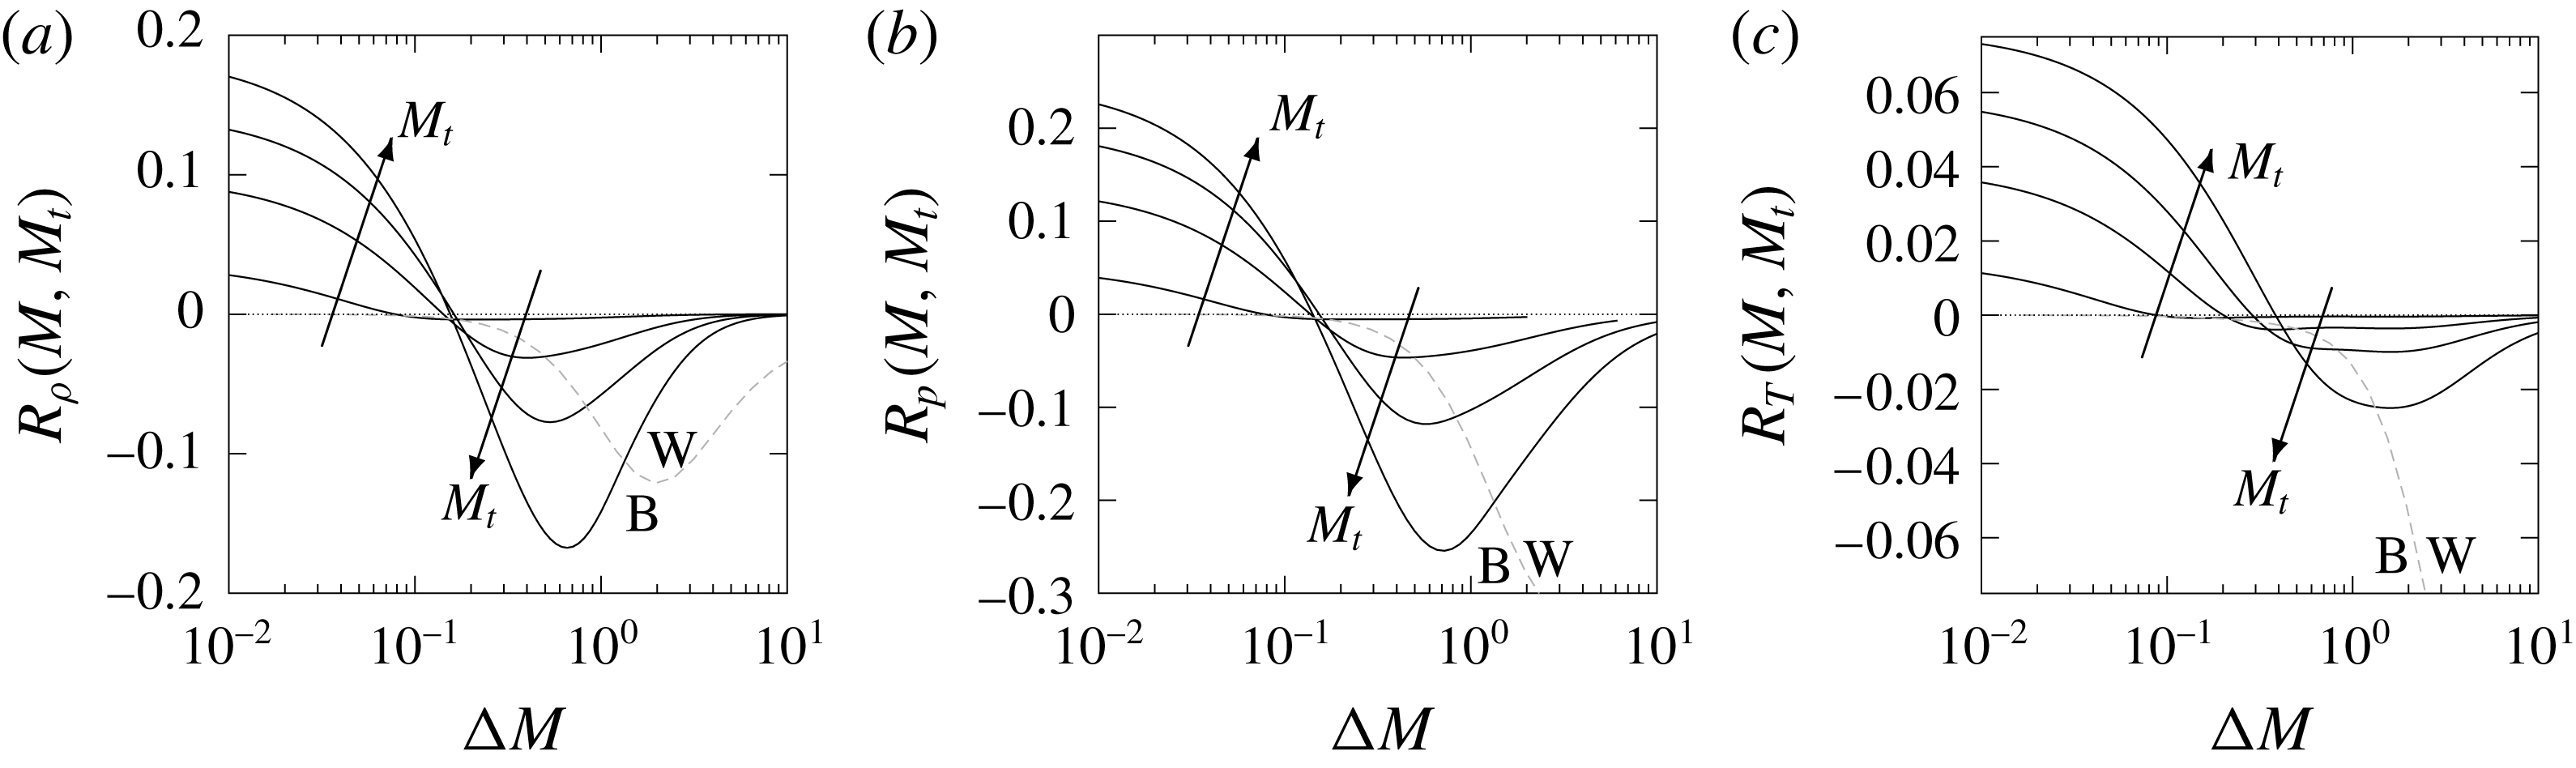
This function, which with (3.14) is known analytically, provides direct information of the effect of turbulence on the jumps of mean thermodynamic quantities. This is shown in figure 11(a) where we can now clearly see that turbulence effects on jumps depend on both
 $M$
and
 $M_{t}$
. In general for low
 $M$
, an increase of turbulence intensity (
 $M_{t}$
) leads to stronger shocks (
 $R_{\unicode[STIX]{x1D70C}}(M,M_{t})>0$
) relative to RH, or equivalently a shock in a uniform laminar flow at the same
 $M$
. However, as
 $M$
increases
 $R_{\unicode[STIX]{x1D70C}}(M,M_{t})$
changes sign and jumps become weaker. At higher
 $M$
,
 $R_{\unicode[STIX]{x1D70C}}(M,M_{t})$
decrease monotonically towards zero from below indicating a vanishing turbulence effect as
 $M\rightarrow \infty$
. A similar general behaviour is observed for the similarly defined
 $R_{p}(M,M_{t})$
and
 $R_{T}(M,M_{t})$
shown in figure 11.
Relative departures from RH jumps for (a) density
 $R_{\unicode[STIX]{x1D70C}}(M,M_{t})$
, (b) pressure
 $R_{p}(M,M_{t})$
and (c) temperature
 $R_{T}(M,M_{t})$
at
 $M_{t}=0.1$
, 0.3, 0.5 and 0.8. Grey dashed line at
 $M_{t}/\unicode[STIX]{x0394}M=0.6$
separates the wrinkled (W) and broken (B) regimes.

Two characteristic Mach numbers can now be identified for
 $R_{\unicode[STIX]{x1D70C}}(M,M_{t})$
. First,
 $M_{cr}^{\unicode[STIX]{x1D70C}}(M_{t})$
is the critical Mach number at which
 $R_{\unicode[STIX]{x1D70C}}(M,M_{t})$
changes sign. This can be readily found by solving
 $R_{\unicode[STIX]{x1D70C}}(M,M_{t})=0$
numerically for fixed
 $M_{t}$
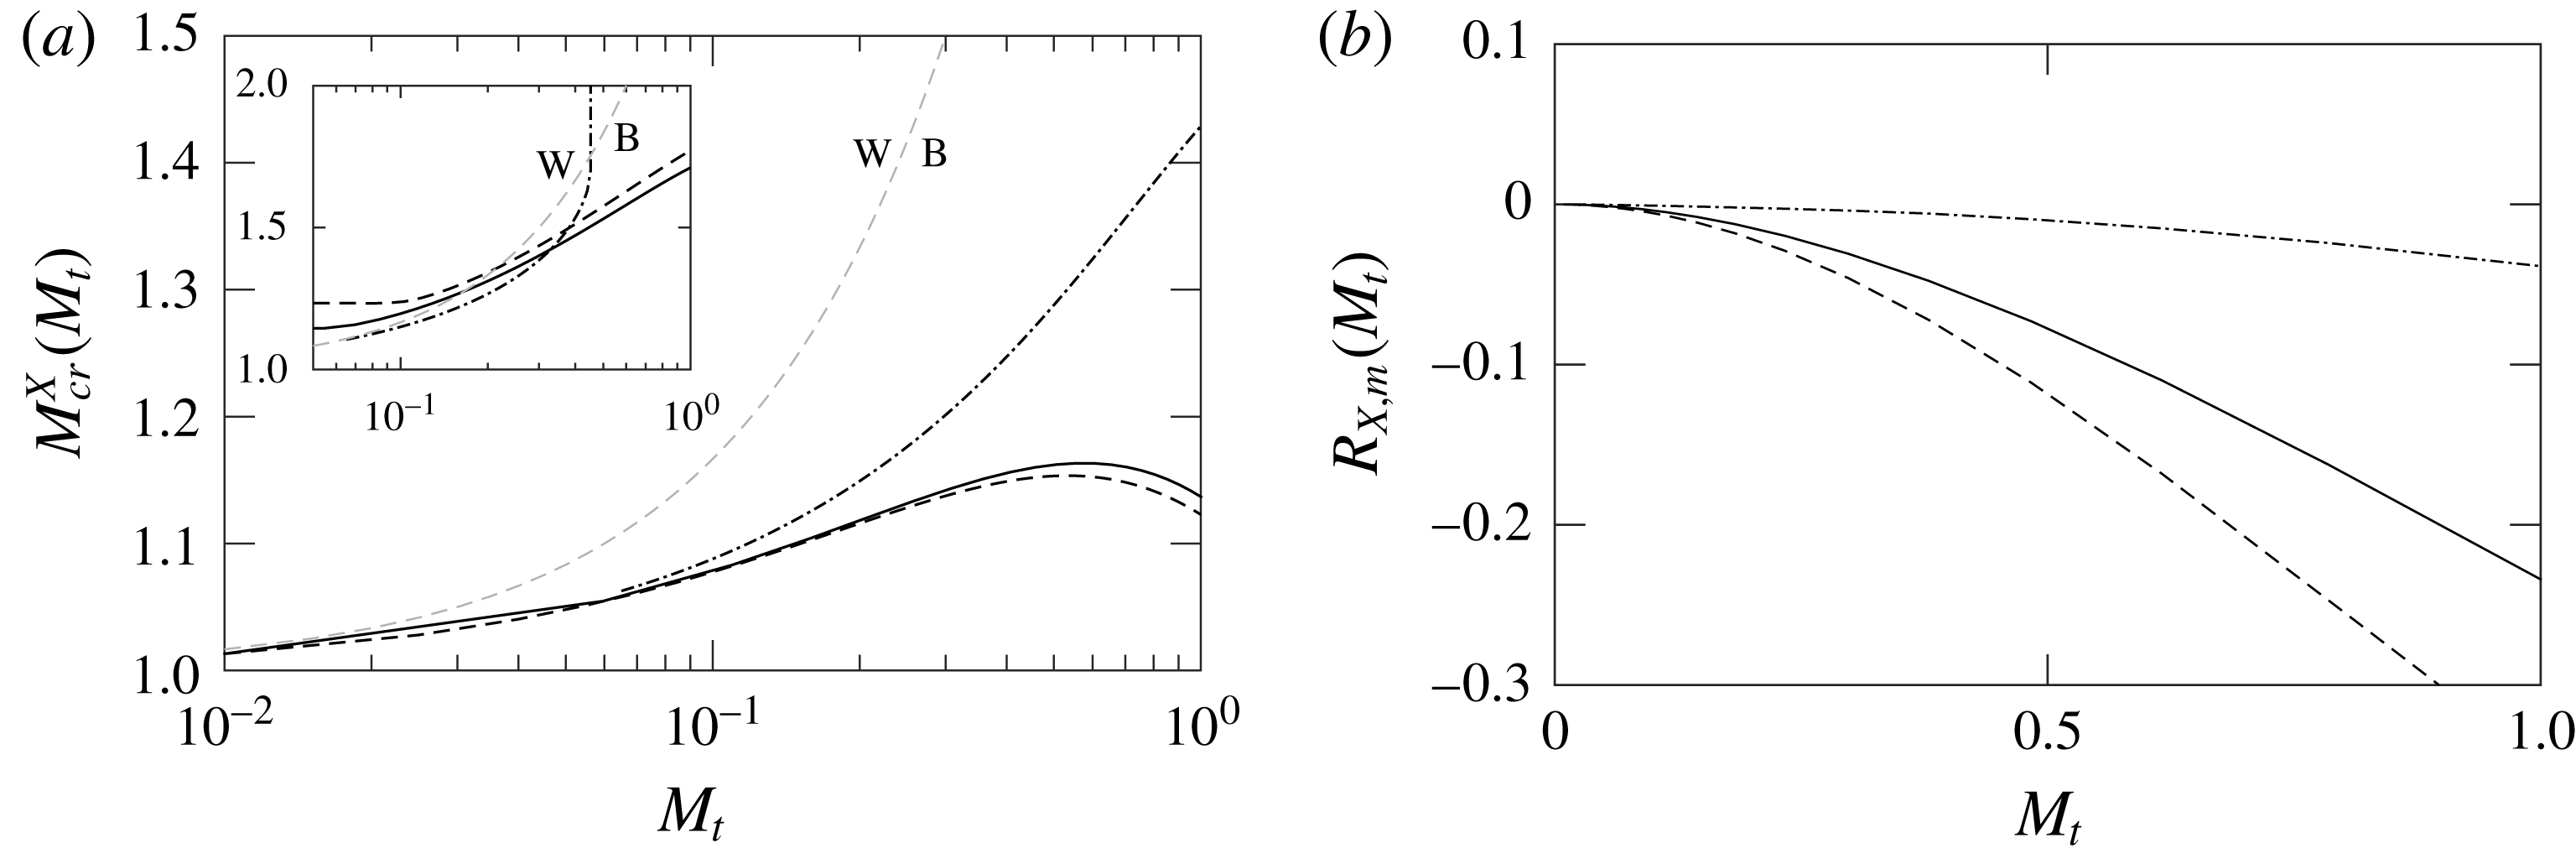
. The result is shown in figure 12(a) along with the critical Mach numbers for pressure and temperature. We see that, while qualitatively similar, the critical Mach number is numerically different for
 $\unicode[STIX]{x1D70C}$
,
 $p$
and
 $T$
. Conditions below and above the corresponding
 $M_{cr}(M_{t})$
lines represent stronger and weaker shock jumps respectively for the different thermodynamic variables. We can also see that the critical Mach number appears mainly in the broken regime.
(a) Critical Mach numbers (
 $M_{cr}^{X}(M_{t})$
) for density (
 $X=\unicode[STIX]{x1D70C}$
, solid), pressure (
 $X=p$
, dashed) and temperature (
 $X=T$
, dash-dotted). Grey dashed line at
 $M_{t}/\unicode[STIX]{x0394}M=0.6$
separates the wrinkled (W) and broken (B) regimes. (b) Maximum weakening of shock jumps due to turbulence measured as the maximum relative departure from RH relations for density (
 $X=\unicode[STIX]{x1D70C}$
, solid), pressure (
 $X=p$
, dashed) and temperature (
 $X=T$
, dash-dotted) for a given
 $M_{t}$
.

An interesting prediction by the theory is the existence of conditions at which pressure and density jumps are weakened by turbulence (
 $M>M_{cr}^{\unicode[STIX]{x1D70C}}$
and
 $M>M_{cr}^{p}$
) while temperature jumps are strengthened (
 $M<M_{cr}^{T}$
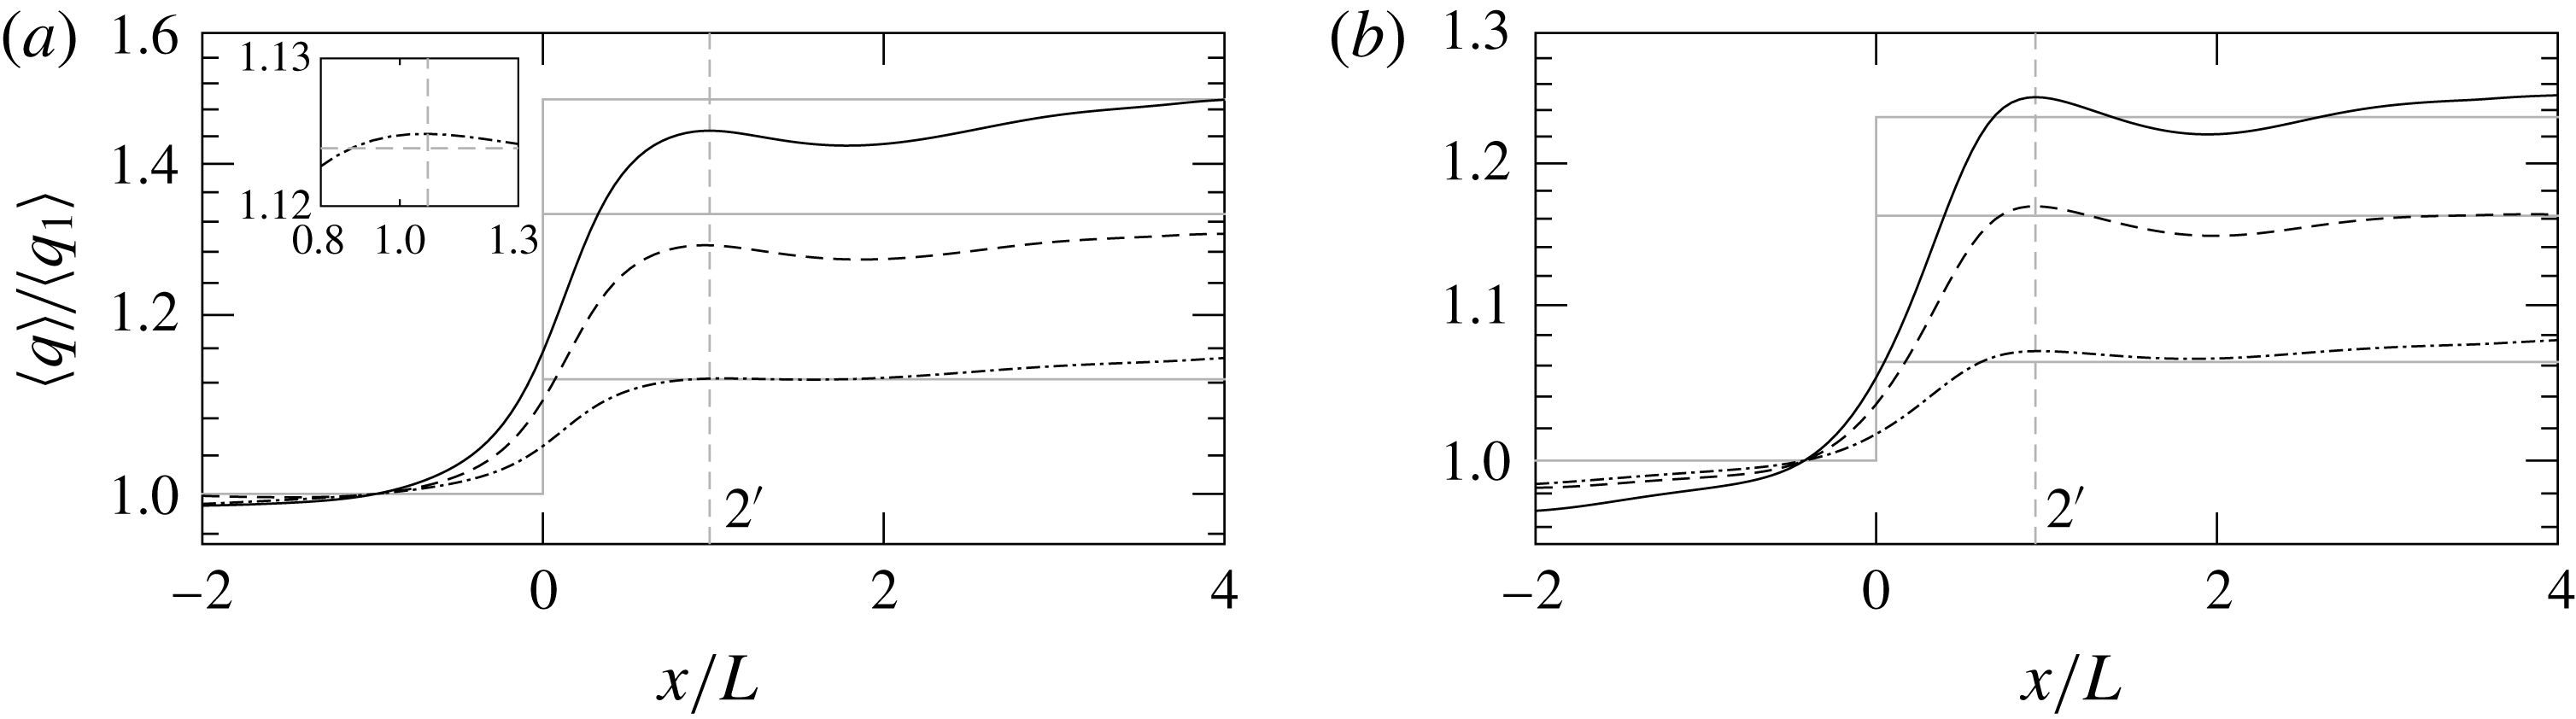
). This is indeed supported by our DNS data at
 $M_{t}=0.39$
and
 $M=1.2$
where temperature experiences an increase stronger than RH while pressure and density experience a weaker-than-RH increase across the shock. This is seen in figure 13(a) where we plot DNS data for this case along with corresponding RH jumps. In figure 13(b) we show a condition where all thermodynamic variables experience a stronger-than-RH jump due to turbulence.
Variation of normalized pressure (solid,
 $q=p$
), density (dashed,
 $q=\unicode[STIX]{x1D70C}$
) and temperature (dash-dotted,
 $q=T$
) across the shock. (a)
 $(M,M_{t},R_{\unicode[STIX]{x1D706}})\approx (1.2,0.39,13)$
which corresponds to
 $M<M_{cr}^{T}$
and
 $M>M_{cr}^{p},M_{cr}^{\unicode[STIX]{x1D70C}}$
Inset: detailed view of temperature around
 $x_{2^{\prime }}$
. (b)
 $(M,M_{t},R_{\unicode[STIX]{x1D706}})\approx (1.1,0.29,10)$
which corresponds to
 $M<M_{cr}^{T},M_{cr}^{p},M_{cr}^{\unicode[STIX]{x1D70C}}$
. Grey solid lines represent the laminar inviscid limits. Vertical grey dashed lines indicate the location of
 $x_{2^{\prime }}$
.

A second characteristic Mach number is the location of the minimum observed for given
 $M_{t}$
in figure 11. This corresponds to the condition at which the largest turbulent effects are observed, and are denoted by
 $M_{m}^{\unicode[STIX]{x1D70C}}(M_{t})$
,
 $M_{m}^{p}(M_{t})$
and
 $M_{m}^{T}(M_{t})$
for density, pressure and temperature, respectively. These can be obtained by solving
 $\unicode[STIX]{x2202}R_{\unicode[STIX]{x1D70C}}(M,M_{t})/\unicode[STIX]{x2202}M=0$
and similar equations for density and pressure. The result is shown in the inset of figure 12(a).
 $M_{m}(M_{t})$
also is mainly in the broken regime though the three thermodynamic quantities lie close to each other and to the WB line. However, for higher
 $M_{t}$
we see
 $M_{m}^{T}(M_{t})$
grows substantially indicating that the strongest turbulence effect on temperature moves to higher values of
 $M$
.
The analysis here also suggests that, for a fixed
 $M_{t}$
, there is a bound on how much a shock can be weakened by turbulence. This is given by the minimum value of
 $R_{\unicode[STIX]{x1D70C}}(M,M_{t})$
(
 $R_{\unicode[STIX]{x1D70C},m}$
for short), which occurs at the second characteristic Mach number, that is
 $R_{\unicode[STIX]{x1D70C},m}\equiv R_{\unicode[STIX]{x1D70C}}(M_{m}^{\unicode[STIX]{x1D70C}}(M_{t}),M_{t})$
. This quantity is shown in figure 12(b) where we see that pressure jumps can be of the order of 30 % weaker at high
 $M_{t}$
. Weakening of temperature jumps however, are much smaller, staying below
 ${\sim}5$
% for the Mach numbers studied here. The Mach number at which this maximum effect is realized can be obtained from figure 11 or the full analytical expressions.
3.2.3 Entropy
Finally we turn to entropy which is also expected to contain both laminar and turbulent contributions. As before, one use QE to obtain the mean entropy jump across a shock as:
 $$\begin{eqnarray}\langle \unicode[STIX]{x0394}s\rangle =\langle \unicode[STIX]{x0394}s^{{<}}\rangle ^{{<}}+\langle \unicode[STIX]{x0394}s^{{>}}\rangle ^{{>}}.\end{eqnarray}$$
For supersonic regions, the standard entropy jump is
 $C_{p}\ln (T_{2^{\prime }}/T_{1})-R\ln (p_{2^{\prime }}/p_{1})$
which can also be written as
 $$\begin{eqnarray}\unicode[STIX]{x0394}s^{{>}}=C_{p}(\ln T_{2^{\prime }}-\ln T_{1})-R(\ln p_{2^{\prime }}-\ln p_{1}).\end{eqnarray}$$
The different terms can be computed as before. For example, the logarithm of the instantaneous temperature in terms of
 $M$
and
 $m$
is
 $$\begin{eqnarray}\ln T_{1}=\ln \left(\left[\frac{\unicode[STIX]{x1D6FE}-1}{2}(M+m)^{2}+1\right]^{-1}T_{01}\right),\end{eqnarray}$$
which upon expanding in Taylor series and averaging leads to:
 $$\begin{eqnarray}\displaystyle \langle \ln T_{1}\rangle ^{{>}} & = & \displaystyle \ln (\mathbb{M}^{-1})\langle m^{0}\rangle ^{{>}}-\frac{2(\unicode[STIX]{x1D6FE}-1)M}{(\unicode[STIX]{x1D6FE}-1)M^{2}+2}\langle m\rangle ^{{>}}\nonumber\\ \displaystyle & & \displaystyle +\,\frac{(\unicode[STIX]{x1D6FE}-1)[(\unicode[STIX]{x1D6FE}-1)M^{2}-2]}{[(\unicode[STIX]{x1D6FE}-1)M^{2}+2]^{2}}\langle m^{2}\rangle ^{{>}}+\ln T_{01}\langle m^{0}\rangle ^{{>}}.\end{eqnarray}$$
We can similarly obtain
 $\langle \ln T_{2^{\prime }}\rangle ^{{>}}$
,
 $\langle \ln p_{1}\rangle ^{{>}}$
and
 $\langle \ln p_{2^{\prime }}\rangle ^{{>}}$
.
For subsonic regions where there is no shock, the entropy increase will be solely due to the dissipative nature of turbulence. Obukhov (Reference Obukhov1949) showed that entropy generation due to turbulent fluctuations in temperature is proportional to the temperature variance. Specifically he showed that when the flow decays from a state characterized by a temperature variance
 $\langle T^{\prime 2}\rangle$
, the total entropy increase is
 $\langle \unicode[STIX]{x0394}s\rangle \approx C_{p}\langle {T^{\prime }}^{2}\rangle /\langle T\rangle ^{2}$
. In the present case, turbulence will not be completely dissipated as it crosses the shock region and reaches
 $x_{2^{\prime }}$
. However, it is still expected that the entropy increase will be proportional to the variance of temperature of the incoming flow. Furthermore, this variance can be written in terms of the turbulent Mach number as
 $\langle T^{\prime 2}\rangle /\langle T\rangle ^{2}\approx (A^{2}/9)(\unicode[STIX]{x1D6FE}-1)^{2}M_{t}^{4}$
(Donzis & Jagannathan Reference Donzis and Jagannathan2013). Thus, for holes one can expect
 $$\begin{eqnarray}\unicode[STIX]{x0394}s^{{<}}=\unicode[STIX]{x1D6FC}_{s}C_{p}(\unicode[STIX]{x1D6FE}-1)^{2}M_{t}^{4},\end{eqnarray}$$
where all prefactors are absorbed in the constant
 $\unicode[STIX]{x1D6FC}_{s}$
.
Finally, with (3.19) and (3.22) we take the conditional averages for the two regions as in (3.18) to obtain
 $$\begin{eqnarray}\frac{\langle \unicode[STIX]{x0394}s\rangle }{C_{p}}=g_{s}(M,M_{t}).\end{eqnarray}$$
The final expressions that comprise the function
 $g_{s}(M,M_{t})$
are explicitly shown in appendix A.
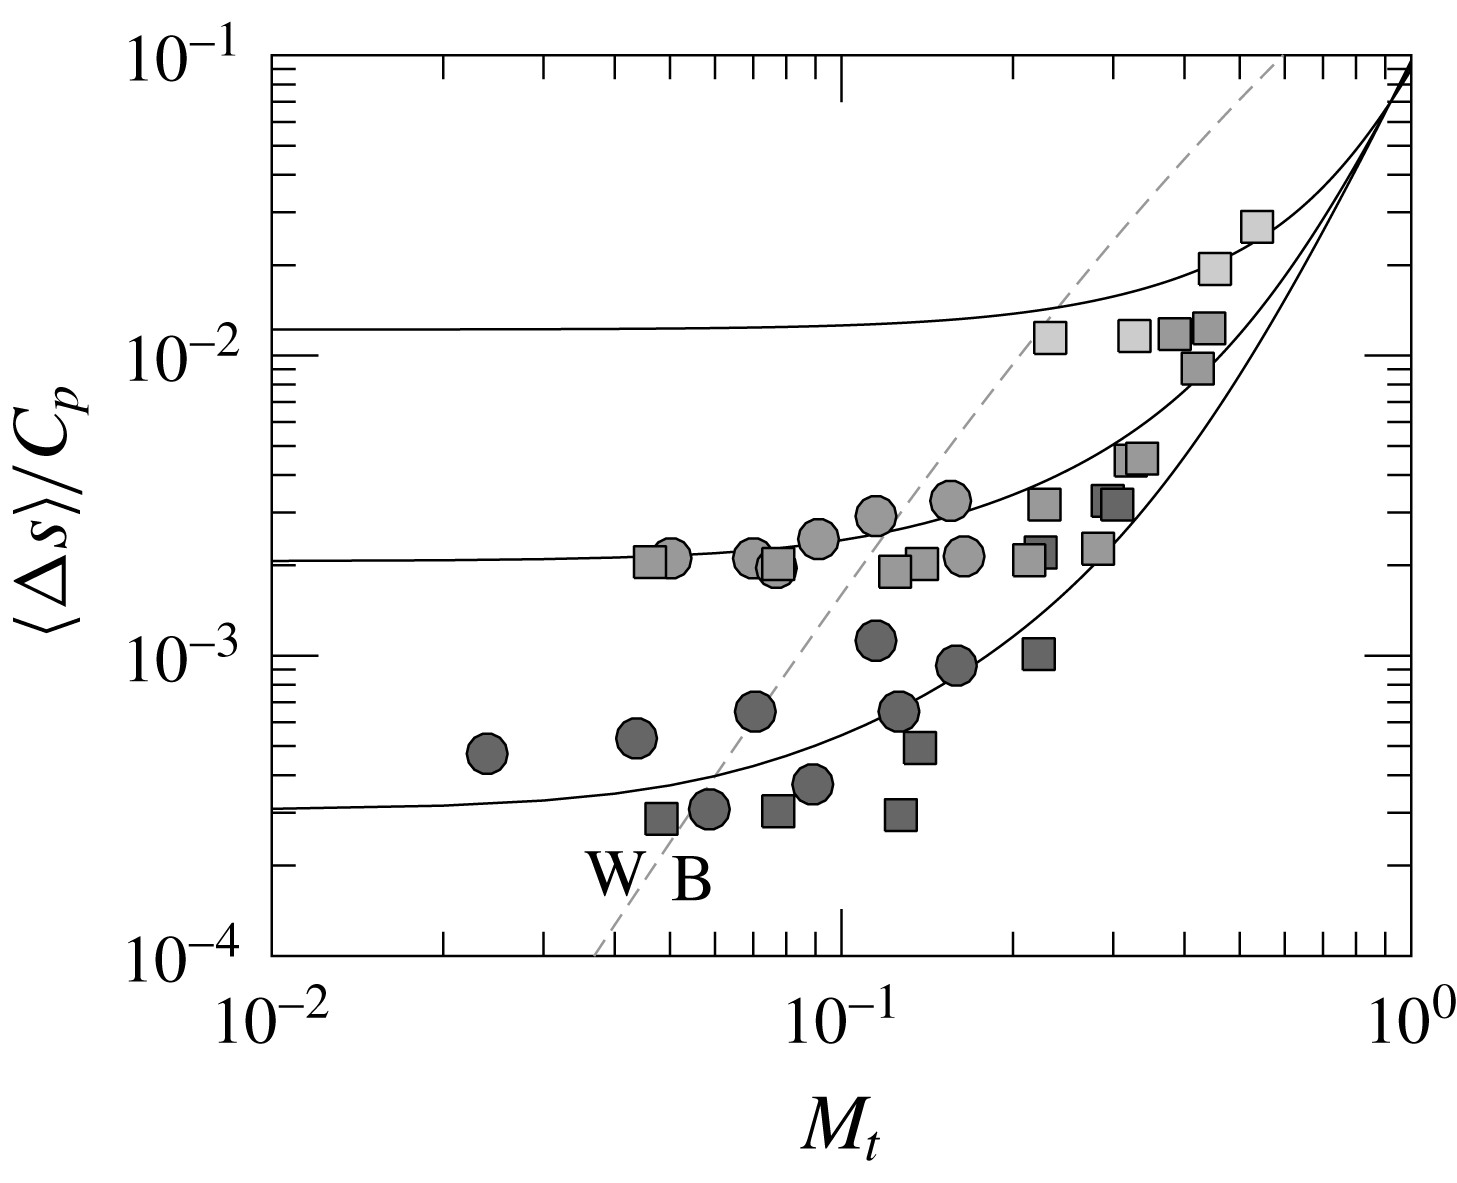
The DNS data of entropy jump across the shock along with the theoretical prediction (3.23) are shown in figure 14. The comparison shows good agreement though there is some scatter in the data. At very low
 $M_{t}$
, the change of entropy is due entirely to the well-known laminar jumps (Thompson Reference Thompson1984). As
 $M_{t}$
increases, we see a substantial increase in entropy production in both DNS data and the theoretical prediction (3.23).
Mean entropy increase from IT (▪) and SDT (●) simulations. Solid lines correspond to the analytical solution (3.23) at
 $M=1.1$
, 1.2, and 1.4 (bottom to top) with
 $\unicode[STIX]{x1D6FC}_{s}=1.176$
. Grey dashed line at
 $M_{t}/\unicode[STIX]{x0394}M=0.6$
separates the wrinkled (W) and broken (B) regimes.

The theoretical result approaches an asymptotic
 $M_{t}^{4}$
at high
 $M_{t}$
indicating that turbulence entropy generation becomes the dominant contribution. Note that the supersonic regions also contains ‘turbulence effects’: this is seen, for example, from the second term in (3.21) which vanishes as the incoming flow fluctuations weakens (
 $M_{t}\rightarrow 0$
). However, the asymptotic behaviour of these terms is a weaker power law than
 $M_{t}^{4}$
. Furthermore, the entropy increase through shock holes is independent of the mean Mach number as it only reflects entropy production due to turbulent dissipation. Thus, the observed decreasing gap between curves at different
 $M$
as
 $M_{t}$
increases is also supportive of an increasingly dominant contribution from turbulent decay.
3.2.4 Remarks
We conclude this section with a few remarks about the generality of the results above. First, we note that there is a negligible Reynolds number effect for mean jumps. This is not unexpected since RH jumps can be shown to be the same in viscous or inviscid flows – molecular transport properties (viscosity and thermal conductivity) only determine the structure of the shock (Zeldovich & Raizer Reference Zeldovich and Raizer2002). Thus, the sole dependence on
 $M$
and
 $M_{t}$
in (3.14)–(3.16) is indeed a very general form, under QE, for jumps. Second, we note that there is little difference between jumps in isotropic and anisotropic turbulence. This suggests that the QE assumption, based on locally one-dimensional shock, does provide an accurate description even with relatively strong turbulence. Finally, we stress that conclusions here result from calculating quantities at
 $x_{2^{\prime }}$
which can be argued to be still unaffected by turbulent mixing downstream of the shock. At
 $x_{2}$
, however, quantities are expected to be affected by turbulence processes and, indeed, Reynolds number effects have been observable (Andreopoulos et al.
Reference Andreopoulos, Agui and Briassulis2000; Donzis Reference Donzis2012a
). These observations are consistent with separate regions, one where the flow is dominated by ‘shock effects’ (
 $x<x_{2^{\prime }}$
), and another one where it is dominated by ‘turbulence effects’ (
 $x>x_{2}$
). The region
 $x_{2^{\prime }}<x<x_{2}$
can then be thought of as a transition region where the fully developed incoming turbulence has been deeply distorted by the shock and is evolving towards its fully developed state. Although our data support this picture, it is unclear to what degree actual flows consist of ‘pure’ regions dominated exclusively by one of these processes. Detailed investigations of this conceptual picture and the relative dominance of different process in each region are worth pursuing, but beyond the objectives here.
3.3 Shock structure
The effects of turbulence on shock characteristics have been studied theoretically in the literature (Ribner Reference Ribner1954a ,Reference Ribner b ; Williams & Howe Reference Williams and Howe1973; Zank et al. Reference Zank, Zhou, Matthaeus and Rice2002; Wouchuk, de Lira & Velikovich Reference Wouchuk, de Lira and Velikovich2009) and observed experimentally (Hesselink & Sturtevant Reference Hesselink and Sturtevant1988) and numerically (Lee et al. Reference Lee, Lele and Moin1993; Larsson & Lele Reference Larsson and Lele2009). These investigations helped identified two regimes – wrinkled and broken – which result from different levels of turbulence intensity. The former corresponds to an interaction in which the shock retains its structure as a sharp gradient over a weakly modified uniform shock plane. The latter corresponds to a strongly modified shock plane with ‘holes’ through which properties may change smoothly or have multiple peaks (Hesselink & Sturtevant Reference Hesselink and Sturtevant1988; Lee et al. Reference Lee, Lele and Moin1993).
A quantitative metric that has been used to characterize inhomogeneities in the structure of the shock is the r.m.s.-to-mean dilatation at the shock (Lee et al. Reference Lee, Lele and Moin1993; Larsson & Lele Reference Larsson and Lele2009)
 $$\begin{eqnarray}\unicode[STIX]{x1D6E9}=\left(\frac{\langle \unicode[STIX]{x1D703}_{s}^{2}\rangle _{s}}{\langle \unicode[STIX]{x1D703}_{s}\rangle _{s}^{2}}-1\right)^{1/2},\end{eqnarray}$$
where
 $\unicode[STIX]{x1D703}_{s}$
is the dilatation at the shock location which is identified as the largest negative value of dilation along the streamwise direction
 $x$
for a given location
 $(y,z)$
. That is,
 $\unicode[STIX]{x1D703}_{s}(y,z)=min_{x}\unicode[STIX]{x1D703}(x,y,z)$
. Note that since the location where
 $\unicode[STIX]{x1D703}$
attains its minimum is, in general, different for different locations
 $(y,z)$
, the averages in (3.24) are not over planes at fixed
 $x$
, but instead over all
 $\unicode[STIX]{x1D703}_{s}(y,z)$
– we use the additional subscript
 $s$
in
 $\langle \cdot \rangle _{s}$
, to differentiate it from plane averages
 $\langle \cdot \rangle$
. DNS data presented below are also time averaged.
Following Donzis (Reference Donzis2012b
), one can write the maximum negative dilatation at the shock as
 $\unicode[STIX]{x1D703}_{s}\approx \unicode[STIX]{x27E6}u\unicode[STIX]{x27E7}/\unicode[STIX]{x1D6FF}_{t}$
where
 $\unicode[STIX]{x27E6}u\unicode[STIX]{x27E7}$
is the velocity change across the shock and
 $\unicode[STIX]{x1D6FF}_{t}$
the shock thickness which, to leading order, can be written as
 $(\unicode[STIX]{x1D70C}c/\unicode[STIX]{x1D707})\unicode[STIX]{x27E6}u\unicode[STIX]{x27E7}(\unicode[STIX]{x0394}M+m)$
. Using unconditional averages over the entire surface and assuming
 $\unicode[STIX]{x27E6}u\unicode[STIX]{x27E7}$
is, to leading order, not affected by fluctuations, QE leads to
 $\langle \unicode[STIX]{x1D703}_{s}\rangle _{s}\sim (\langle \unicode[STIX]{x1D70C}_{1}\rangle \langle c_{1}\rangle /\langle \unicode[STIX]{x1D707}_{1}\rangle )\unicode[STIX]{x27E6}u\unicode[STIX]{x27E7}\unicode[STIX]{x0394}M$
and
 $\langle \unicode[STIX]{x1D703}_{s}^{2}\rangle _{s}\sim (\langle \unicode[STIX]{x1D70C}_{1}\rangle \langle c_{1}\rangle /\langle \unicode[STIX]{x1D707}_{1}\rangle )^{2}\unicode[STIX]{x27E6}u\unicode[STIX]{x27E7}^{2}(\unicode[STIX]{x0394}M^{2}+M_{t}^{2}/3)$
which, when used in (3.24), leads to:
 $$\begin{eqnarray}\unicode[STIX]{x1D6E9}\approx \frac{1}{\sqrt{3}}\frac{M_{t}}{\unicode[STIX]{x0394}M}.\end{eqnarray}$$
This has been shown to provide good collapse of the existing data (Donzis Reference Donzis2012b
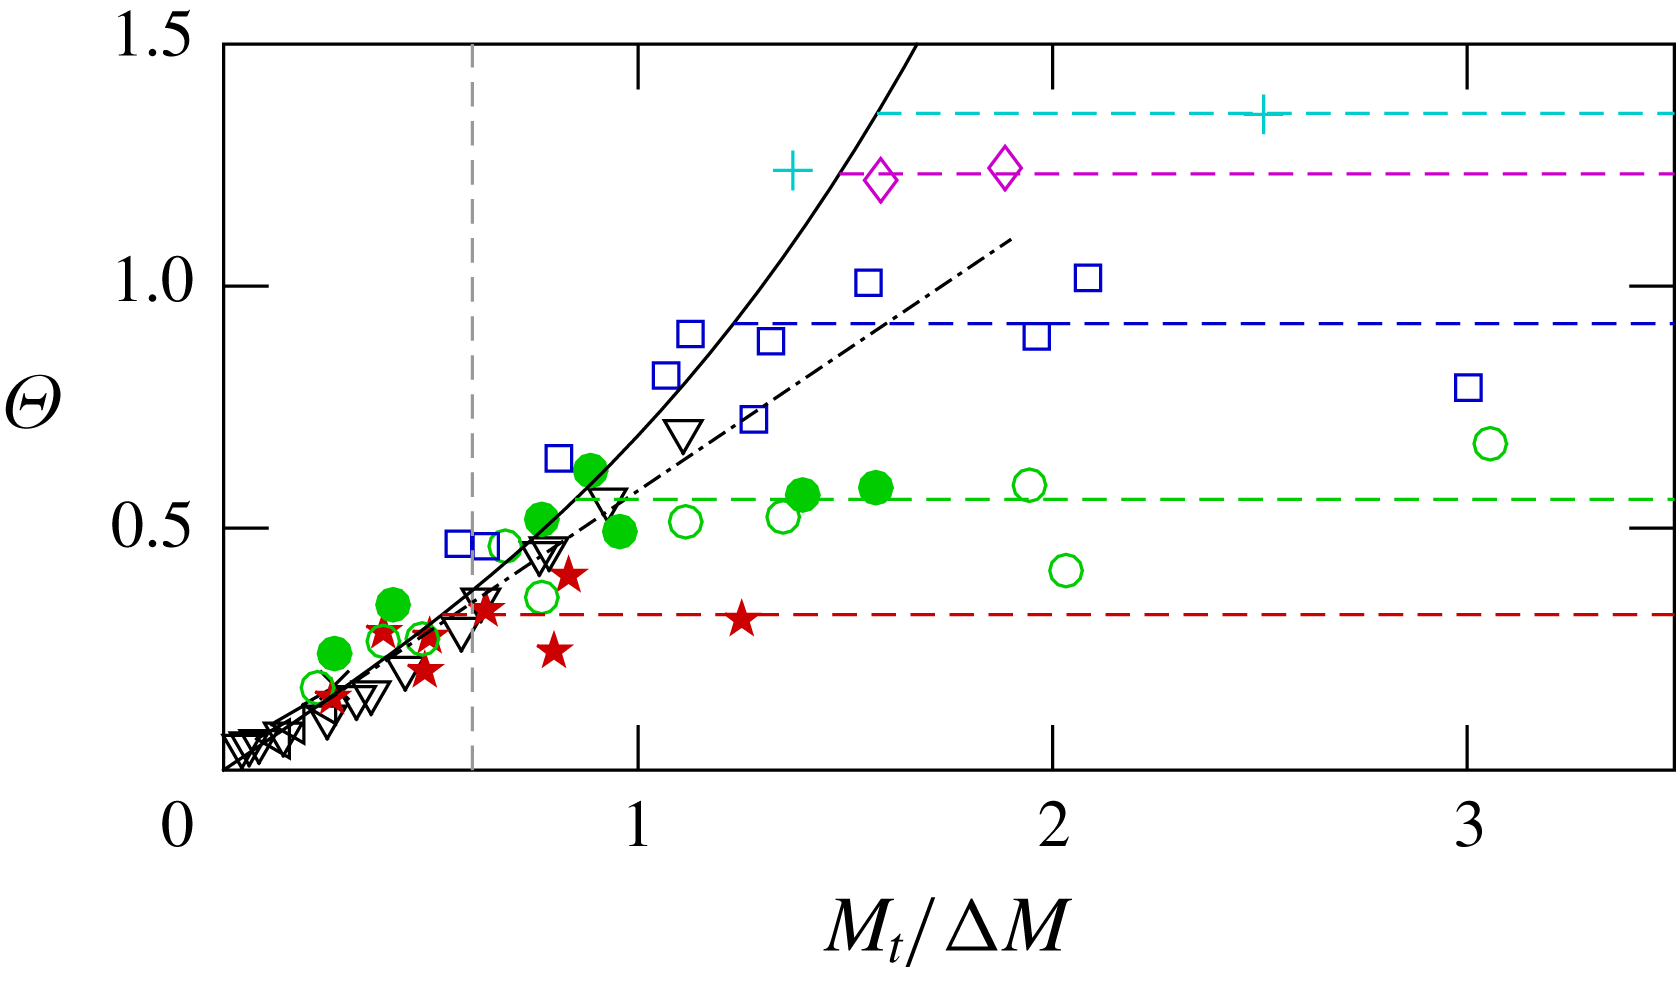
; Boukharfane, Bouali & Mura Reference Boukharfane, Bouali and Mura2018). However, equation (3.25) is expected to be accurate only when turbulence is relatively weak. This is indeed the case as seen in figure 15, where we show
 $\unicode[STIX]{x1D6E9}$
for the present data (in colour) along with other existing data. The dash-dotted line is (3.25) while the solid line contains the next-order term in the expansion (Donzis Reference Donzis2012b
), that is
 $\unicode[STIX]{x1D6E9}\approx e_{1}M_{t}/\unicode[STIX]{x0394}M+e_{2}(M_{t}/\unicode[STIX]{x0394}M)^{3}$
where
 $e_{1}$
and
 $e_{2}$
are fitting constants. There is good agreement between the data and the theory in the wrinkled regime (
 $M_{t}/\unicode[STIX]{x0394}M\lesssim 0.6$
) consistent with previous studies (Donzis Reference Donzis2012b
; Boukharfane et al.
Reference Boukharfane, Bouali and Mura2018).
As
 $M_{t}/\unicode[STIX]{x0394}M$
increases, however, departures are apparent with two interesting features. First we see that, in spite of significant scatter,
 $\unicode[STIX]{x1D6E9}$
seems to approach an asymptotic value (
 $\unicode[STIX]{x1D6E9}_{\infty }$
) at high
 $M_{t}/\unicode[STIX]{x0394}M$
with a value dependent on the Reynolds number. Second, DNS data depart from the QE prediction at higher
 $M_{t}/\unicode[STIX]{x0394}M$
when
 $R_{\unicode[STIX]{x1D706}}$
is high. This effect does not appear to be due to the increase of holes in the shock since figure 7 shows that the fraction of subsonic regions does not depend on
 $R_{\unicode[STIX]{x1D706}}$
. A potential explanation for this effect is that at low
 $R_{\unicode[STIX]{x1D706}}$
, stronger viscous effects enhance transverse diffusion of momentum which would make the one-dimensional local behaviour assumption in QE less applicable. However, a thorough verification of this explanation requires more data at a wide range of parameters.
R.m.s.-to-mean dilatation at the shock for
 $R_{\unicode[STIX]{x1D706}}\approx 5$
(red stars),
 $R_{\unicode[STIX]{x1D706}}\approx 10$
(green circles),
 $R_{\unicode[STIX]{x1D706}}\approx 25$
(blue squares),
 $R_{\unicode[STIX]{x1D706}}\approx 45$
(magenta diamonds),
 $R_{\unicode[STIX]{x1D706}}\approx 65$
(cyan pluses). Open and closed symbols are for IT and SDT simulations, respectively. Vertical grey dashed line at
 $M_{t}/\unicode[STIX]{x0394}M=0.6$
for reference. Horizontal dashed lines: average of DNS data at high
 $M_{t}/\unicode[STIX]{x0394}M$
for
 $R_{\unicode[STIX]{x1D706}}\approx 5$
, 10, 25, 45 and 65 from bottom to top. Other symbols: Jamme et al. (Reference Jamme, Cazalbou, Torres and Chassaing2002) (
 $\times$
), Larsson & Lele (Reference Larsson and Lele2009) (▿) and Boukharfane et al. (Reference Boukharfane, Bouali and Mura2018) (◃).

Before we discuss the asymptotic value
 $\unicode[STIX]{x1D6E9}_{\infty }$
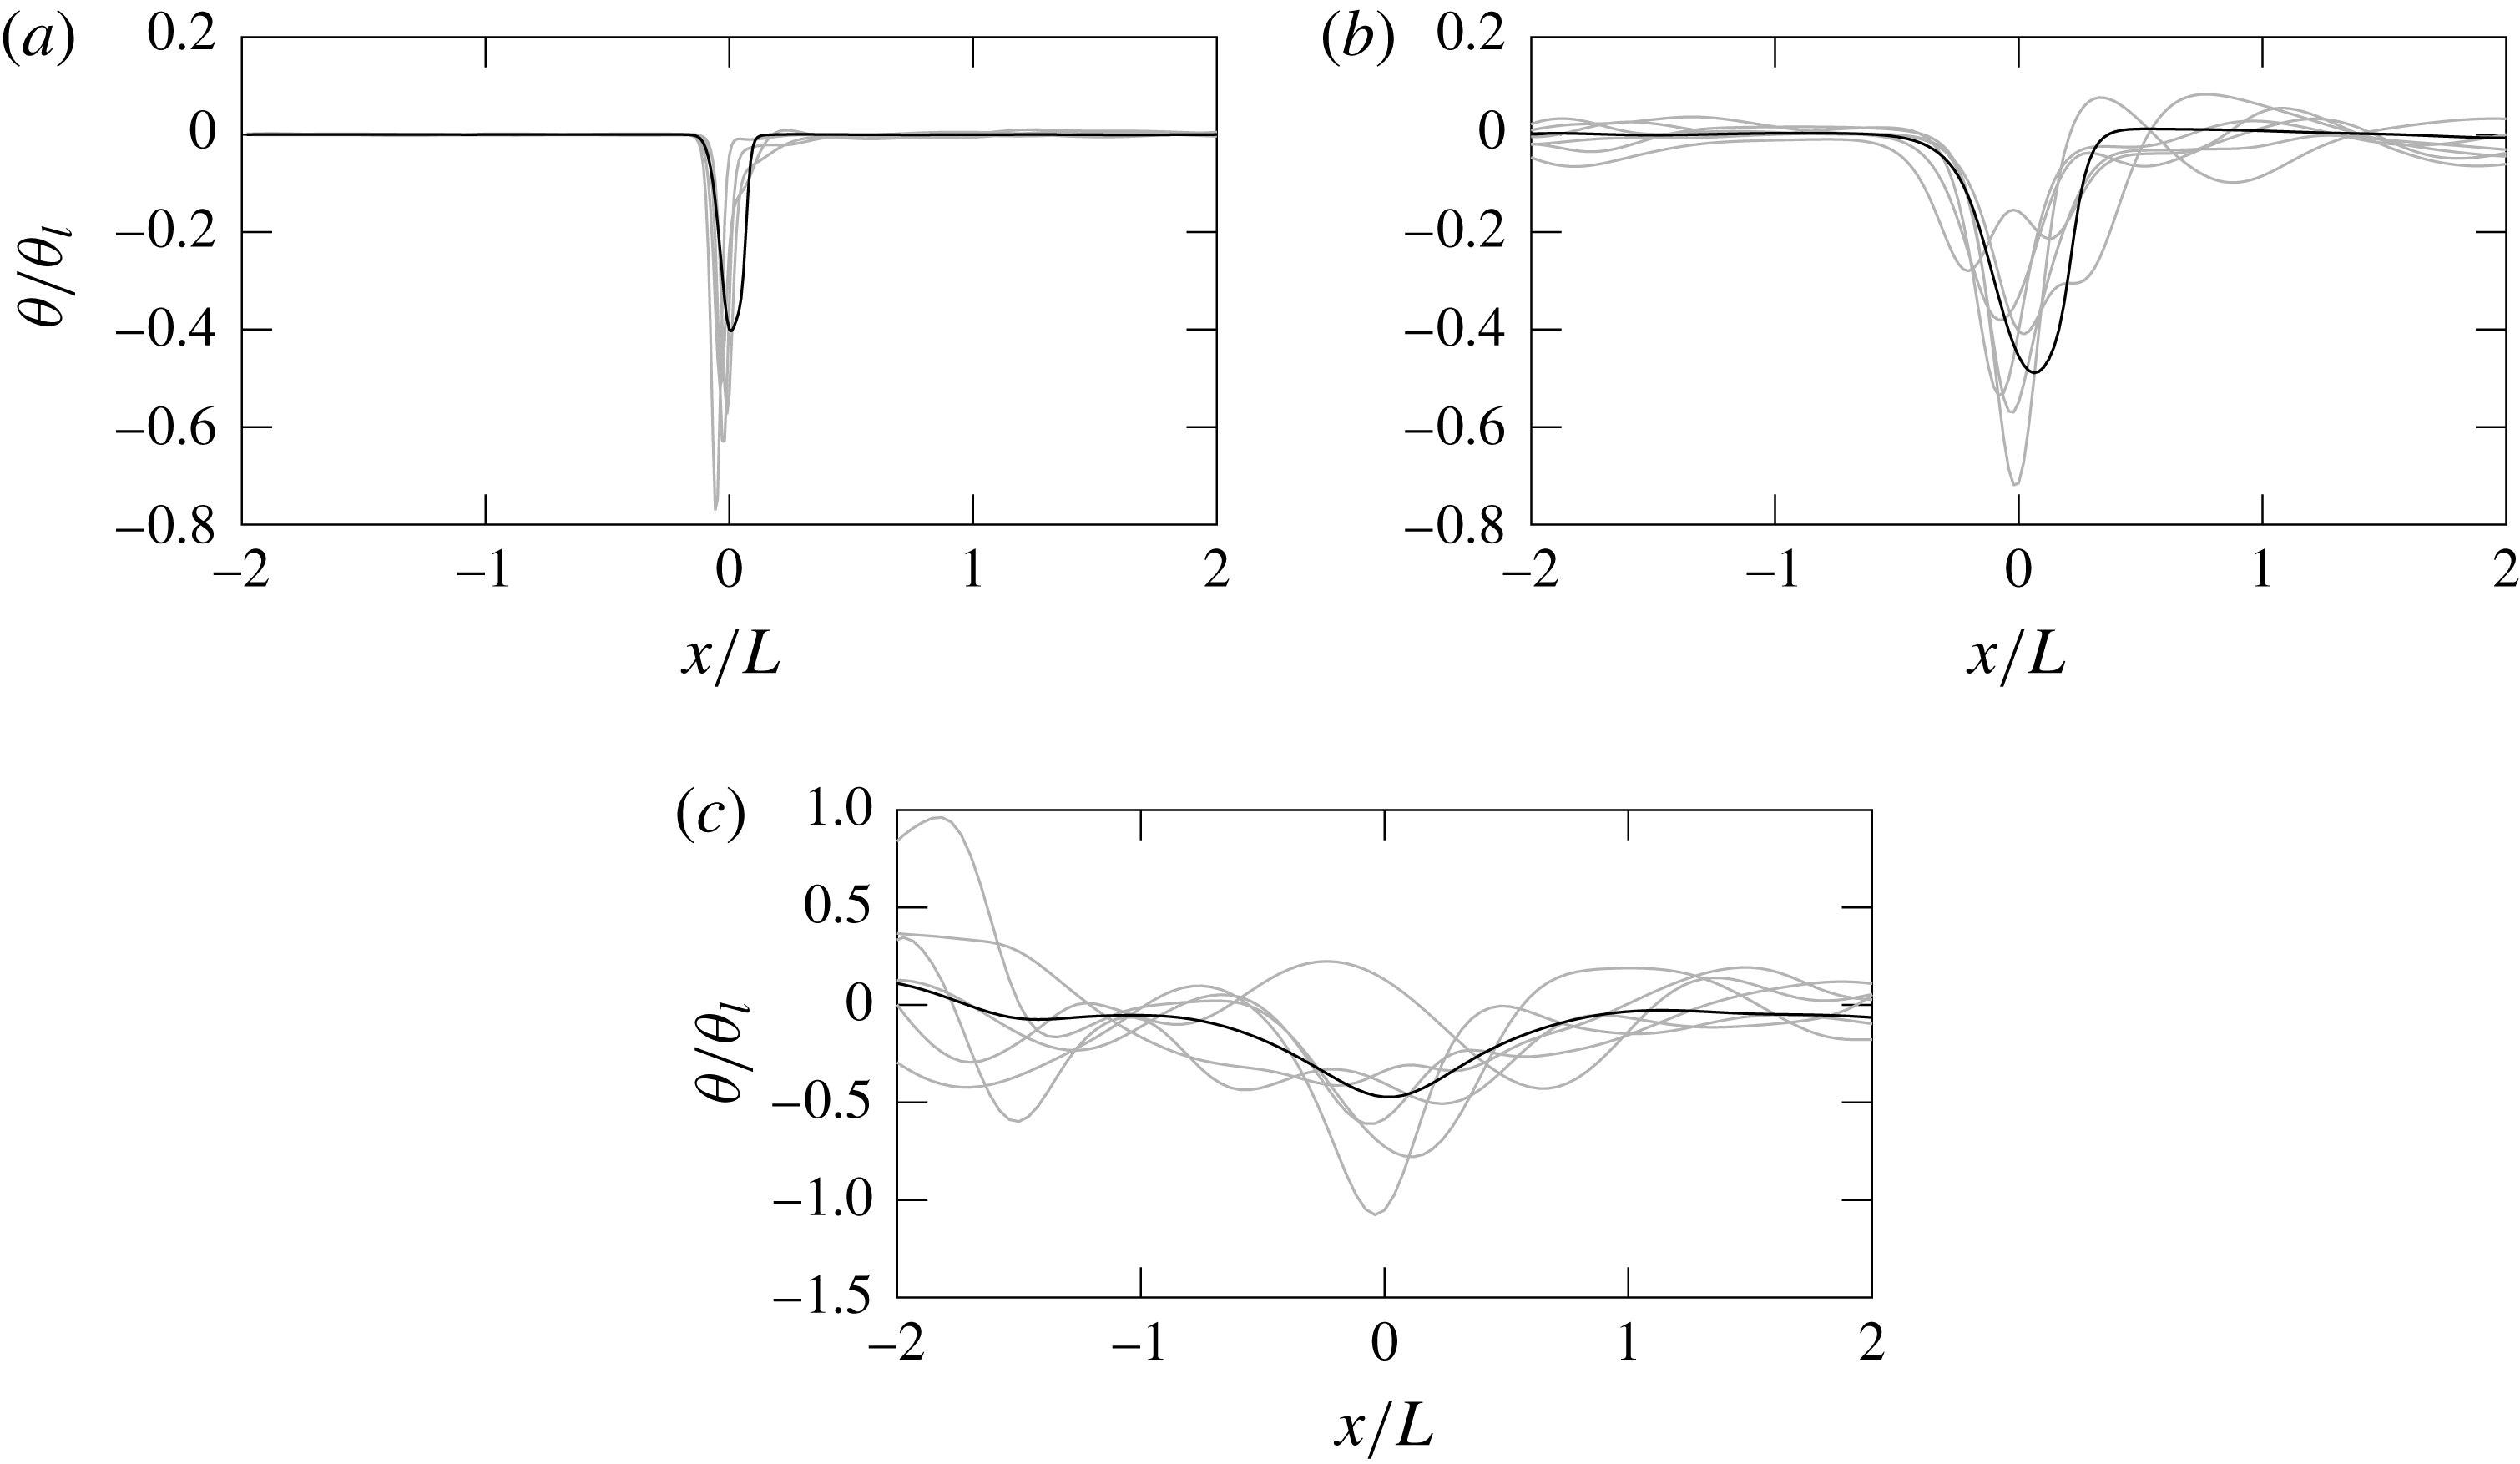
, it is instructive to see the structure of the flow as it crosses the shock. In figure 16 we show, for three different cases, plane-averaged dilatation along the streamwise direction (dark line) with a set of instantaneous dilatation profiles at some arbitrary locations (light grey lines). In (a) we show a wrinkled case (though close to broken limit) with a very strong mean dilatation comprised of similar instantaneous profiles. At higher
 $M_{t}/\unicode[STIX]{x0394}M$
in the broken regime (b) we also see a strong peak though spatially broader, consistent with theoretical predictions (Donzis Reference Donzis2012b
). Individual dilatation profiles, however, display a wider range of behaviours: some have the same qualitative peak while others present multiple peaks or a very broad smooth variation (Lee et al.
Reference Lee, Lele and Moin1993; Larsson & Lele Reference Larsson and Lele2009). At even higher values of
 $M_{t}/\unicode[STIX]{x0394}M$
(c) individual profiles show very large fluctuations upstream and downstream of the shock comparable to the mean (dark line). It is interesting to note that while fluctuations in this case are of the same order as the mean, the latter still shows the same peak as, although much broader than, in the wrinkled regime.
Instantaneous dilatation normalized by laminar condition (
 $\unicode[STIX]{x1D703}_{l}$
) along the streamwise direction at different transverse locations (grey) and their mean (black) at
 $M=1.1$
,
 $R_{\unicode[STIX]{x1D706}}\approx 10$
and (a)
 $M_{t}=0.05$
(wrinkled), (b)
 $M_{t}=0.14$
(broken) and (c)
 $M_{t}=0.34$
(vanished).

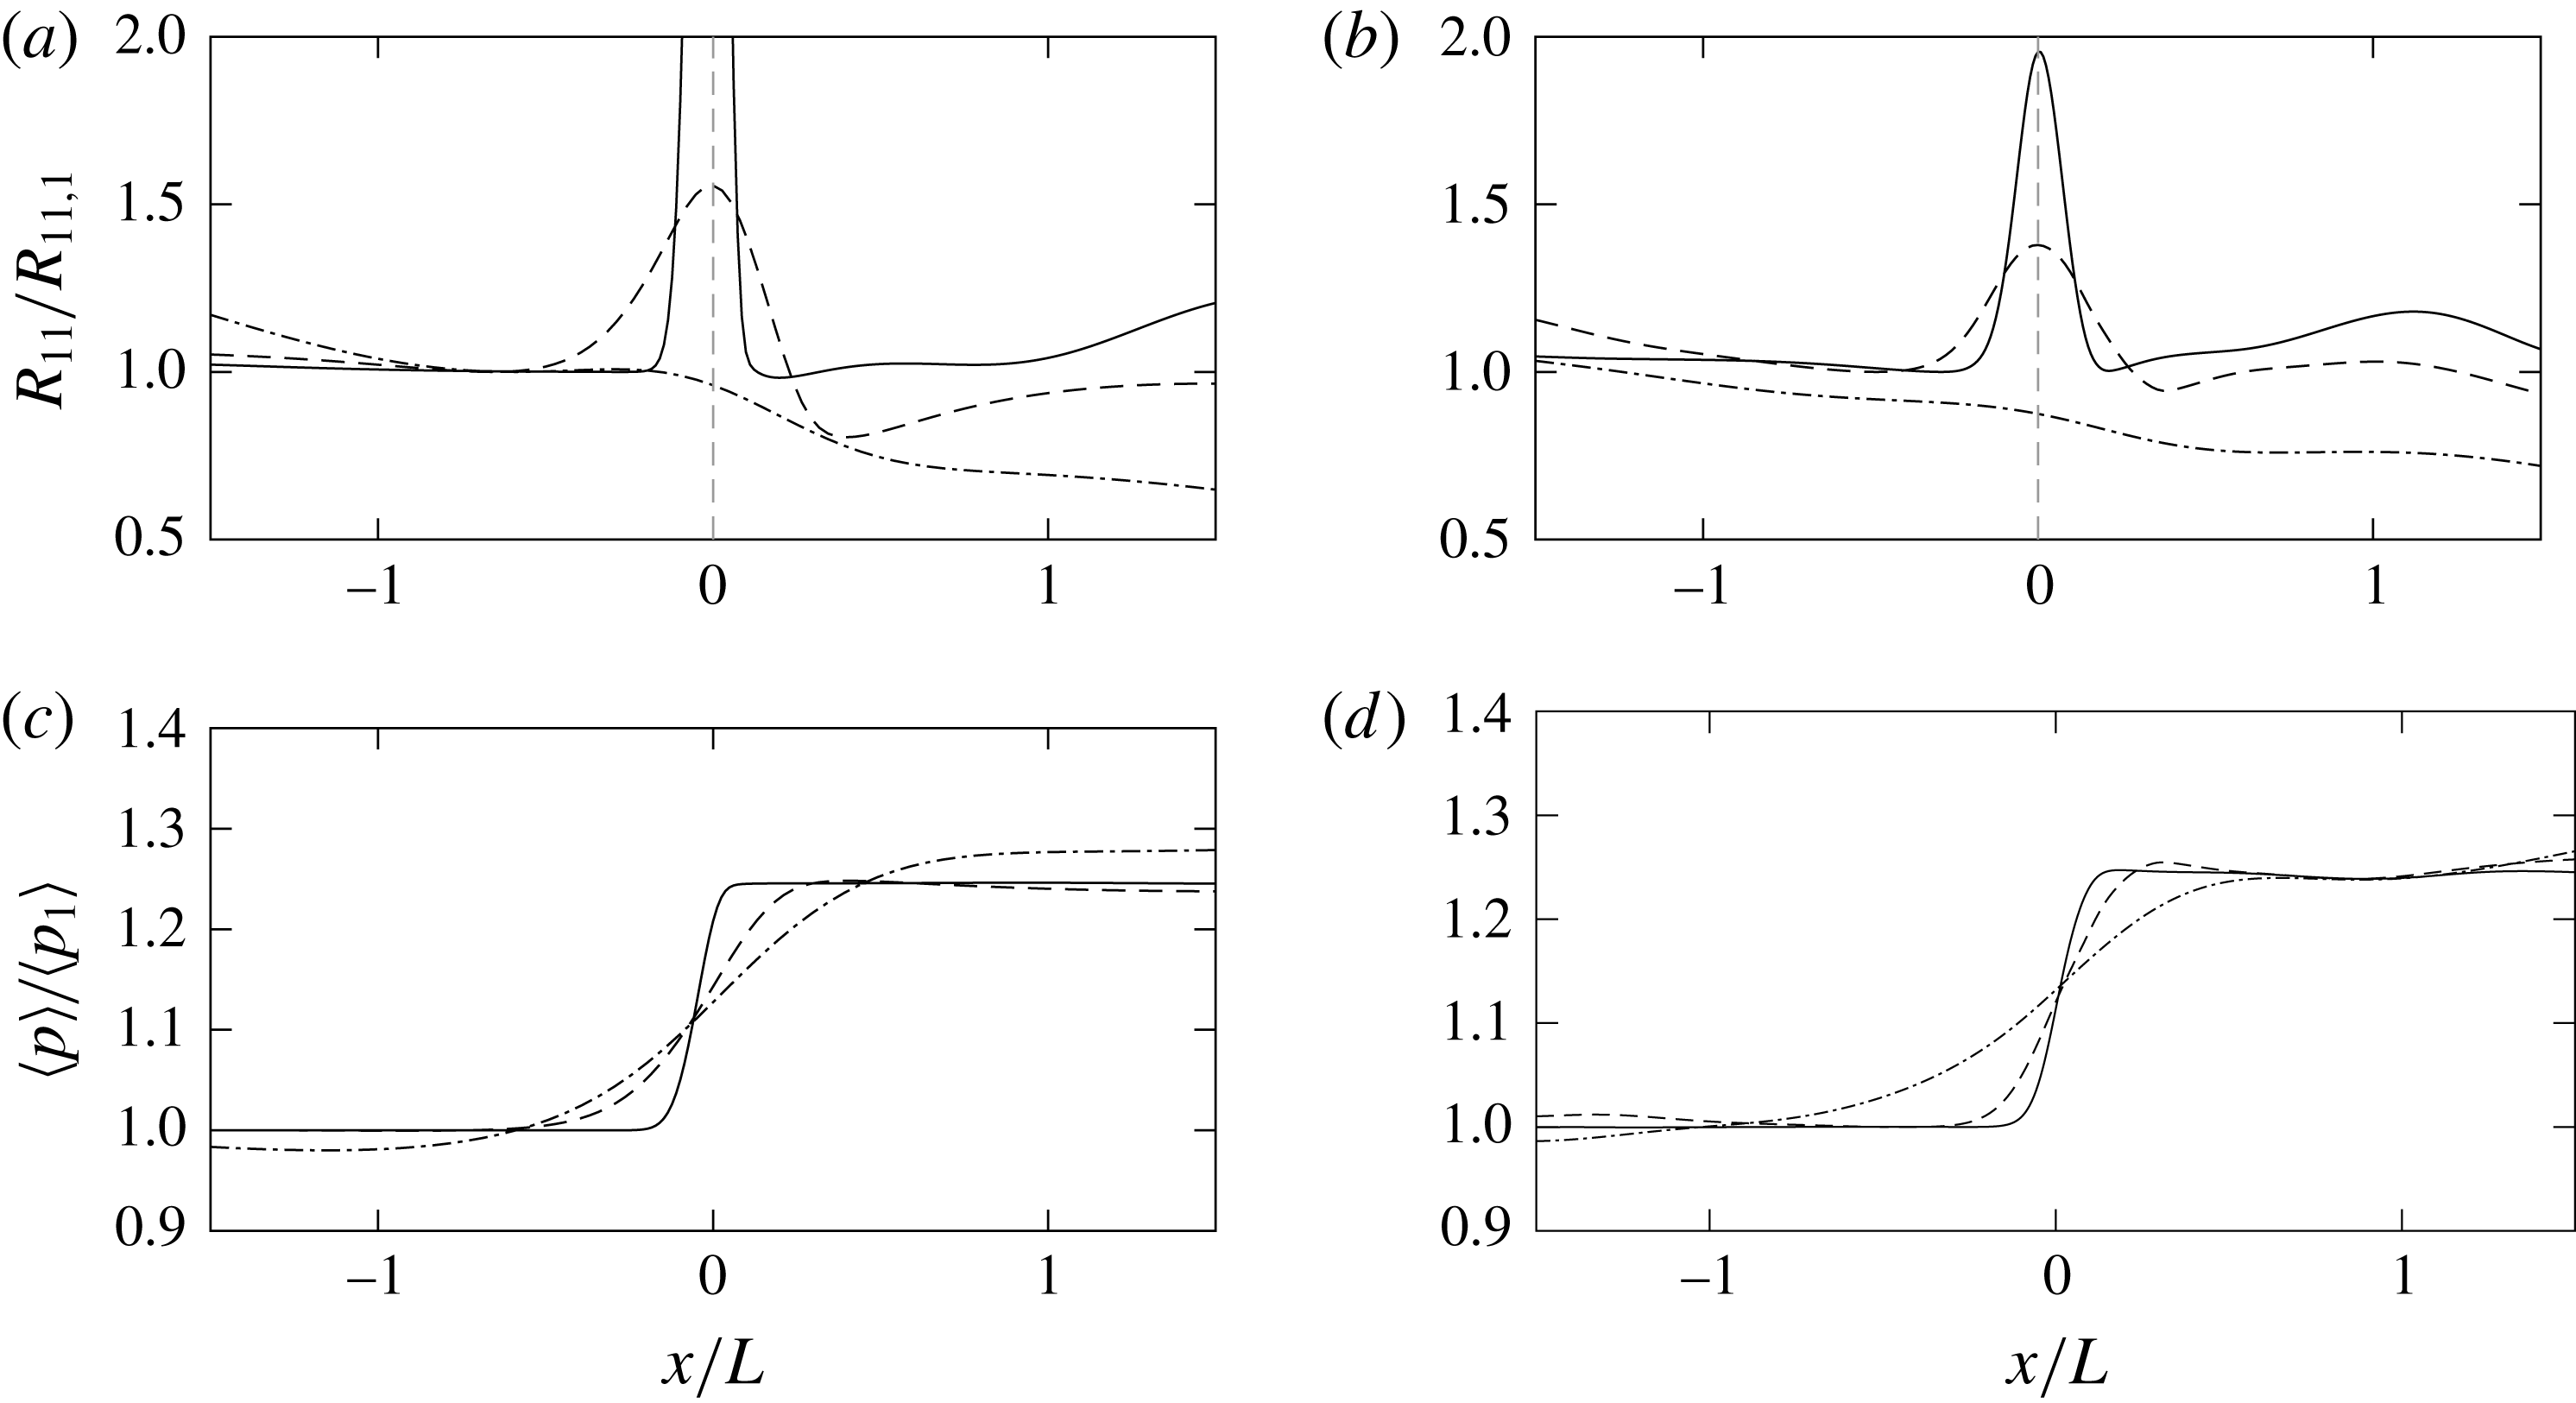
Typical distributions of Reynolds stresses and mean pressure are shown in figure 17 at similar conditions. In (a) and (b) we see that, consistent with observations in the literature, the downstream peak of
 $R_{11}$
at
 $x_{2}$
decreases with
 $M_{t}$
. As
 $M_{t}$
increases further, we observe both the peaks upstream and downstream of the shock (
 $x_{1}$
and
 $x_{2}$
, respectively) vanish. We term this, then, the ‘vanished’ regime. Clearly in this regime, it is not possible to compute amplification factors since no upstream and downstream locations can be identified unambiguously as Reynolds stresses undergo a classical turbulent decay. It is interesting that other mean quantities such as mean pressure (c,d) or mean velocity retain the typical qualitative behaviour of a shock. While these mean gradients may lead to production by mean shear in the Reynolds stress budget, because of the short residence time within the shock region, they cannot, on average, counteract the viscous decay.
Furthermore, since in the vanished regime no
 $x_{1}$
location can be identified, it is also not possible to determine
 $R_{\unicode[STIX]{x1D706}}$
,
 $M_{t}$
or
 $\unicode[STIX]{x0394}M$
upstream of the shock. Alternatively, one can estimate them by assessing the limit at which local extrema vanish for
 $R_{11}$
. For example, for
 $R_{\unicode[STIX]{x1D706}}\approx 5$
, 10 and 25, we find that the vanished regime appears at
 $M_{t}/\unicode[STIX]{x0394}M\approx 2.14$
, 3.4 and 4.4, respectively. In these three cases,
 $K$
is found to be very close to 1.0. This is, in fact, not unexpected. As we show below, the amplification factor for
 $R_{11}$
shows a universal behaviour with
 $K$
for relatively high
 $K$
. In particular, it decreases with
 $K$
and reaches values around 0.8 at
 $K\approx 1$
. Beyond this value of
 $K$
no local extrema are observed and amplification factors cannot be obtained.
Distributions of
 $R_{11}$
at
 $M=1.1$
, (a)
 $R_{\unicode[STIX]{x1D706}}\approx 10$
and
 $M_{t}=0.05$
(solid),
 $M_{t}=0.14$
(dashed) and
 $M_{t}=0.34$
(dash-dotted) and (b)
 $R_{\unicode[STIX]{x1D706}}\approx 25$
and
 $M_{t}=0.22$
(solid),
 $M_{t}=0.3$
(dashed) and
 $M_{t}=0.44$
(dash-dotted). Distribution of
 $p$
at (c)
 $R_{\unicode[STIX]{x1D706}}\approx 10$
and
 $M_{t}=0.05$
(solid),
 $M_{t}=0.14$
(dashed) and
 $M_{t}=0.34$
(dash-dotted) and (d)
 $R_{\unicode[STIX]{x1D706}}\approx 25$
and
 $M_{t}=0.22$
(solid),
 $M_{t}=0.3$
(dashed) and
 $M_{t}=0.44$
(dash-dotted).

We now get back to the asymptotic value
 $\unicode[STIX]{x1D6E9}_{\infty }$
. As
 $M_{t}/\unicode[STIX]{x0394}M$
increases, increasingly large areas of the shock are subsonic and present holes. However, it is unclear what the value of
 $\unicode[STIX]{x1D703}_{s}$
is across holes. Furthermore, as turbulence becomes more intense, the flow will experience stronger locally three-dimensional effects which will favour strong mixing in all directions and thus weaken the applicability of QE. According to the definition of
 $\unicode[STIX]{x1D6E9}$
one searches for the largest negative dilatation around the location of the shock along
 $x$
for a given
 $(y,z)$
location. When turbulence is strong (see instantaneous profiles in figure 16
c), one would expect
 $\unicode[STIX]{x1D6E9}$
to be essentially dominated by turbulence statistics and we can then use known scaling laws for velocity gradients. However,
 $\unicode[STIX]{x1D6E9}$
is based on the average of the minimum dilatation close to the average location of the shock. While the mean dilatation in isotropic turbulence is zero, the average of minimum dilatation across an arbitrary plane is not. Thus, we make the additional assumption that these values are, to first approximation, proportional to the average magnitude of those gradients. Moments of velocity gradients are known to scale as power laws with the Reynolds number (Monin & Yaglom Reference Monin and Yaglom1975):
 $\langle |\unicode[STIX]{x2202}u/\unicode[STIX]{x2202}x|^{n}\rangle =C_{n}(u_{1,rms}/L)^{n}R_{\unicode[STIX]{x1D706}}^{2d_{n}}$
where
 $C_{n}$
are flow-dependent constants and
 $d_{n}$
are the so-called scaling exponents. While these power laws have been historically believed to hold only for high Reynolds numbers, recent work suggests that their applicability extends to rather low Reynolds numbers (Schumacher, Sreenivasan & Yakhot Reference Schumacher, Sreenivasan and Yakhot2007; Schumacher et al.
Reference Schumacher, Scheel, Krasnov, Donzis, Yakhot and Sreenivasan2014; Yakhot & Donzis Reference Yakhot and Donzis2017). We then estimate
 $\unicode[STIX]{x1D6E9}_{\infty }$
, when turbulence dominates, as
 $$\begin{eqnarray}\unicode[STIX]{x1D6E9}_{\infty }\approx \left(\frac{\langle |\unicode[STIX]{x2202}u/\unicode[STIX]{x2202}x|^{2}\rangle }{\langle |\unicode[STIX]{x2202}u/\unicode[STIX]{x2202}x|\rangle ^{2}}-1\right)^{1/2}\approx c_{1}(c_{2}R_{\unicode[STIX]{x1D706}}^{2(d_{2}-2d_{1})}-1)^{1/2},\end{eqnarray}$$
where all order-unity prefactors have been absorbed in the constants
 $c_{1}$
and
 $c_{2}$
. The exponents have been studied extensively and are relatively well known (e.g. Schumacher et al.
Reference Schumacher, Sreenivasan and Yakhot2007; Yakhot & Donzis Reference Yakhot and Donzis2018) with values
 $d_{2}=1$
and
 $d_{1}=0.46$
.
In figure 18 we show
 $\unicode[STIX]{x1D6E9}_{\infty }$
from DNS along with (3.26) with
 $c_{1}=1.756$
and
 $c_{2}=0.8217$
obtained as best-fit coefficients indeed of order unity. The good agreement between theory and DNS supports the idea of
 $\unicode[STIX]{x1D6E9}$
being dominated by turbulence rather than the shock at those conditions. At the same time from figure 7 we see that even for
 $M_{t}/\unicode[STIX]{x0394}M\approx 3$
the subsonic regions are only approximately 30 % of the shock area. Thus, the dominance of turbulence appears to stem from strong turbulent mixing across and after the weak shock.
Asymptotic value of
 $\unicode[STIX]{x1D6E9}$
as a function of
 $R_{\unicode[STIX]{x1D706}}$
. Different symbols represent the average of DNS data at a fixed
 $R_{\unicode[STIX]{x1D706}}$
in the asymptotic state (see text). Symbols as in figure 15. Solid line is (3.26) with
 $c_{1}=1.756$
and
 $c_{2}=0.8217$
.

4 Amplification factors
As we have shown, turbulent flows can significantly affect jumps in thermodynamic variables as well as statistical features of the shock structure. Simultaneously, the occurrence of a shock also affects the characteristics of turbulent flows. A useful quantity to characterize these changes is the so-called amplification factor,
 $G\equiv R_{11,2}/R_{11,1}$
. The main rationale behind selecting
 $x_{2}$
as the downstream location (Donzis Reference Donzis2012a
and references therein; Ryu & Livescu Reference Ryu and Livescu2014; Boukharfane et al.
Reference Boukharfane, Bouali and Mura2018) is that, as discussed in § 2.3, the flow undergoes a viscous decay beyond that location where inviscid assumptions are less justified. Here we follow this convention and use
 $x_{2}$
. We note, however, that other methods have also been proposed (e.g. Larsson & Lele Reference Larsson and Lele2009, where Reynolds stresses are extrapolated to the mean shock location in an attempt to account for the viscous decay).
When data available in the literature are examined collectively, it is clear that
 $G$
depends not only on
 $M$
(as predicted by LIA) but also on the turbulent Mach number and the Reynolds number (Andreopoulos et al.
Reference Andreopoulos, Agui and Briassulis2000; Donzis Reference Donzis2012a
). In Donzis (Reference Donzis2012a
) we proposed an alternative parameter to characterize the interaction (
 $K$
) defined as
 $$\begin{eqnarray}K\equiv \unicode[STIX]{x1D6FF}_{l}/\unicode[STIX]{x1D702},\end{eqnarray}$$
where
 $\unicode[STIX]{x1D6FF}_{l}$
is the shock thickness at a uniform Mach number,
 $M$
. As
 $K$
decreases, the shock becomes increasingly smaller relative to turbulence scales. One would, then, expect the interaction to approach the conditions in which LIA is applicable, that is when the shock is a discontinuity interacting with very weak fluctuations in an inviscid flow (low
 $M_{t}$
and high
 $R_{\unicode[STIX]{x1D706}}$
). Indeed, recent well-resolved simulations (Ryu & Livescu Reference Ryu and Livescu2014) support this limiting expectation. Our interest here, however, is in the case of finite
 $M_{t}$
and
 $R_{\unicode[STIX]{x1D706}}$
where both parameters play a role. Using classical scaling arguments, one can also write
 $K=M_{t}/R_{\unicode[STIX]{x1D706}}^{1/2}\unicode[STIX]{x0394}M$
(Donzis Reference Donzis2012a
), an expression that was also used in other contexts to assess resolution in DNS (Moin & Mahesh Reference Moin and Mahesh1998).
Figure 19 shows the amplification factor for all the DNS database presented here (in colour) along with other amplification factors in the literature. In (a) we show
 $G$
as a function of
 $\unicode[STIX]{x0394}M$
, the only parameter that controls the interaction within LIA. Wide differences are seen between the LIA prediction (solid line) and data. As pointed out before (Donzis Reference Donzis2012a
) these departures are systematic in
 $R_{\unicode[STIX]{x1D706}}$
and
 $M_{t}$
but disappear when data are plotted against
 $K$
. This is shown in figure 19(b) where we see a high degree of collapse of the new and earlier data onto a single curve at high
 $K$
which is well represented by a power law of the form
 $G\approx 0.75K^{-1/4}$
proposed in Donzis (Reference Donzis2012a
). As pointed out above, as
 $K\rightarrow 0$
, we have
 $\unicode[STIX]{x1D6FF}_{l}\ll \unicode[STIX]{x1D702}$
and one expects to recover conditions in which LIA applies. Ryu & Livescu (Reference Ryu and Livescu2014) indeed observed this trend. Thus, data suggest a universal behaviour of amplification factors with
 $K$
, with a Mach-number-dependent asymptotic state as
 $K\rightarrow 0$
. At high
 $K$
, the amplification factor is seen to go below unity, a possibility suggested before (Donzis Reference Donzis2012a
), which represents turbulence attenuation as it crosses the shock. Beyond
 $K\approx 1.0$
, amplification factors cannot be defined as the extrema at
 $x_{1}$
and
 $x_{2}$
vanish, marking the beginning of the vanished regime.
(a) Collection of amplification factors of streamwise velocity as a function of
 $\unicode[STIX]{x0394}M$
along with LIA prediction (Ribner Reference Ribner1954b
). (b) Same data as a function of
 $K=M_{t}/(R_{\unicode[STIX]{x1D706}}^{1/2}\unicode[STIX]{x0394}M)$
. Horizontal dashed lines: LIA prediction for
 $M=1.1$
, 1.2, 1.3, 1.4, 1.5 and 1.8 from bottom to top. In both panels red circles correspond to
 $M=1.1$
, blue squares to
 $M=1.2$
and green diamonds to
 $M=1.4$
. Open and closed symbols are for IT and SDT simulations, respectively. Other symbols: Lee et al. (Reference Lee, Lele and Moin1993, Reference Lee, Lele and Moin1997) (▹), Hannappel & Friedrich (Reference Hannappel and Friedrich1995) (
 $+$
), Barre et al. (Reference Barre, Alem and Bonnet1996) (◃), Mahesh et al. (Reference Mahesh, Lele and Moin1997) (▵), Jamme et al. (Reference Jamme, Cazalbou, Torres and Chassaing2002) (
 $\times$
), Larsson & Lele (Reference Larsson and Lele2009) and Larsson et al. (Reference Larsson, Bermejo-Moreno and Lele2013) (▿), Ryu & Livescu (Reference Ryu and Livescu2014) (*, grey levels for
 $M=1.1$
,
 $M=1.2$
and
 $M=1.4$
from light to dark), Boukharfane et al. (Reference Boukharfane, Bouali and Mura2018) (

 $\star$
, grey levels for
 $M=1.1$
,
 $M=1.3$
and
 $M=1.5$
from light to dark).


This transition between scaling laws based on different non-dimensional groups in particular limits is observed in diverse physical phenomena from equations of states near the critical point (Widom Reference Widom1965) to flows in rough pipes (Goldenfeld Reference Goldenfeld2006). In the latter, Goldenfeld studied the transition from the well-known power-law dependence of the friction coefficient on the Reynolds number to a Reynolds-number-independent scaling law on the ratio of roughness to pipe diameter. In such cases, the dependence on two parameters can be cast in terms of a reduced parameter under which data are observed to collapse into a single universal curve. The data in figure 19(b) are very suggestive of such a behaviour with a transition from
 $K$
to
 $M$
as
 $K\rightarrow 0$
. Thus we start by considering the general relation
 $G=f_{1}(K,\unicode[STIX]{x0394}M)$
for some unknown function
 $f_{1}$
and its observed limiting behaviour. At high values of
 $K$
we observe a
 $K^{-1/4}$
scaling; at low values of
 $K$
,
 $G$
tends to LIA. Note that this imposes significant constraints on the functional form for
 $f_{1}$
. For simplicity in the analysis we consider the behaviour for
 $M\lesssim 2$
where the LIA solution can be approximated as a power law of the form
 $\unicode[STIX]{x0394}M^{1/6}$
as shown in figure 19(a) with a dashed line. Following Widom (Reference Widom1965), we propose the following scaling relation:
 $$\begin{eqnarray}G=K^{-1/4}f_{2}(K^{\unicode[STIX]{x1D6FC}}\unicode[STIX]{x0394}M),\end{eqnarray}$$
where
 $\unicode[STIX]{x1D6FC}$
is an exponent to be determined by specific limits. Note that this is essentially a case of incomplete similarity also justified from renormalization group theory (Barenblatt Reference Barenblatt2003) where universality is revealed only under a suitable combination of the original governing non-dimensional parameters, although this combination cannot be obtained on dimensional grounds alone. Consistency with the
 $\unicode[STIX]{x0394}M^{1/6}$
asymptotic behaviour requires that
 $f_{2}(x)\sim x^{1/6}$
as
 $x\rightarrow 0$
and, simultaneously, that the
 $K$
dependency must disappear. It is easy to see that
 $G$
will become independent of
 $K$
in that limit if
 $\unicode[STIX]{x1D6FC}=3/2$
. The final result is then
 $$\begin{eqnarray}G=K^{-1/4}f_{2}(K^{3/2}\unicode[STIX]{x0394}M).\end{eqnarray}$$
The implication of this scaling is that while the phenomenon depends on the two parameters
 $K$
and
 $\unicode[STIX]{x0394}M$
at two different limiting conditions, a collapse on a universal curve will emerge if one plots
 $G/K^{-1/4}$
as a function of
 $K^{3/2}\unicode[STIX]{x0394}M$
. This is indeed the case as seen in figure 20 where we show data at
 $M<2$
, the condition at which the scaling argument applies. We can see that, for example, the data from Ryu & Livescu (Reference Ryu and Livescu2014) which depart from
 $K$
scaling at different
 $\unicode[STIX]{x0394}M$
(figure 19
b) collapse onto the line with a slope of
 $1/6$
. This low
 $K$
behaviour is readily understood by recalling that
 $f_{2}(x)\sim x^{1/6}$
at small
 $x$
which corresponds to
 $G\sim \unicode[STIX]{x0394}M^{1/6}$
. At high
 $K$
,
 $G\sim K^{-1/4}$
which under the normalization in the plot is seen as a horizontal line. Given the number and variety of data sources and flow conditions collected here, combined with the lack of systematic trends with Reynolds, turbulent and mean Mach numbers individually, the collapse of the data is deemed very satisfactory. This is especially so when one compares with figure 19(a) where the scatter around the theoretical prediction is reduced by a factor of 3 and, more importantly, no systematic trends with
 $R_{\unicode[STIX]{x1D706}}$
and
 $M_{t}$
are observed.
The transition from
 $K$
-scaling to
 $M$
-scaling allows us also to determine the combination of parameters at which it occurs. From figure 20, we observe that this transition happens at
 $K^{3/2}\unicode[STIX]{x0394}M\approx 0.0055$
. Explicitly, we can then write
 $$\begin{eqnarray}K_{tr}\approx \frac{0.03}{\unicode[STIX]{x0394}M^{2/3}},\end{eqnarray}$$
which is found to be consistent with the data in figure 19(b), especially those of Ryu & Livescu (Reference Ryu and Livescu2014) which clearly show the transition. We also point out that (4.4) provides a precise meaning to the distinction between low-
 $K$
and high-
 $K$
interactions, a classification that was put forth only in qualitative terms (Donzis Reference Donzis2012a
): amplification factors at
 $K<K_{tr}$
could be well represented by LIA; amplification factors at
 $K>K_{tr}$
scale as
 $G\approx 0.75K^{-1/4}$
. Equation (4.4) can also be written as
 $(\unicode[STIX]{x1D6FF}_{l}/\unicode[STIX]{x1D702})_{tr}\approx 0.03/\unicode[STIX]{x0394}M^{2/3}$
which emphasizes the fact that the transition depends not only on the ratio of length scales. From figure 20 we see that the majority of the data in the literature with
 $M<2$
correspond to high-
 $K$
interactions.
We close this section by noting that the amplification factor shows no systematic difference between the two types of mechanisms used to generate turbulence here, namely, IT and SDT (§ 2.2). Since the former is statistically isotropic while the latter is not with longitudinal stresses
 $R_{11}$
up to 64 % larger than transverse stresses
 $R_{22}$
(table 2), data suggest that amplification of turbulence in the streamwise direction may be dominated by one-dimensional processes in that direction. This is consistent with the discussion in § 3.2 where it was argued that the dynamics in the region upstream of
 $x_{2^{\prime }}$
is mainly determined by shock effects in QE. Fully developed turbulence, on the other hand, is attained only at
 $x_{2}$
beyond which well-known return-to-isotropy processes (not accounted for in LIA) are expected to operate at relatively long time scales (Larsson & Lele Reference Larsson and Lele2009; Larsson et al.
Reference Larsson, Bermejo-Moreno and Lele2013; Ryu & Livescu Reference Ryu and Livescu2014; Livescu & Ryu Reference Livescu and Ryu2016). In light of these observations, it may not be entirely surprising the virtually undetectable dependence of
 $G$
on anisotropy in the incoming turbulence.
5 Summary and conclusions
We have investigated the interaction of a normal shock and turbulence with a focus on high intensity turbulence levels. We presented theoretical results on turbulent jumps of mean thermodynamic quantities, shock structure and amplification factors, all supported by a large database of new high-resolution shock-resolving DNS at a wide range of
 $M_{t}(0.02-0.54)$
and
 $R_{\unicode[STIX]{x1D706}}(5-65)$
, and mean Mach numbers,
 $M$
, up to 1.4.
A number of theoretical results were presented using the quasi-equilibrium assumption (Donzis Reference Donzis2012b
). Under such an assumption, the shock responds instantaneously to local changes in upstream conditions due to turbulent fluctuations. When turbulent fluctuations are strong enough, the flow can become subsonic locally. In Donzis (Reference Donzis2012b
) we proposed this to be the origin of so-called holes in the shock, a situation commonly referred to as the broken regime of the interaction which emerges when
 $M_{t}/\unicode[STIX]{x0394}M\gtrsim 0.6$
. Here we presented DNS data that quantitatively support the assertion that beyond this threshold subsonic regions become rapidly apparent, leading to a broken regime.
We presented analytical expressions for mean jumps across the shock using the QE approximation, in which standard RH jumps are valid locally. The resulting functions depend on both
 $M$
and
 $M_{t}$
compared to RH jumps which depend solely on
 $M$
. Our and others’ numerical data agree well with the theoretical predictions and we argued that while
 $R_{\unicode[STIX]{x1D706}}$
does not appear in the final expressions, this can be justified from analysis of the governing equations in the one-dimensional limit. The effect of anisotropy on the incoming turbulence was found to be negligible on mean jumps, again supporting the basic tenets behind QE. The analytical results apply well both in the wrinkled and broken regime due to the different treatment of supersonic and subsonic regions ahead of the shock. Interestingly, though, departures from RH jumps of mean variables are seen even in the wrinkled regime due to the nonlinear functional form of RH jumps which, when averaged, result in values different than RH jumps using mean properties ahead of the shock. Note that this effect is missing when linearized RH jumps are used in theories such as LIA. Furthermore, in the latter, mean properties are considered known boundary conditions to the problem at the mean Mach number
 $M$
. Our results, consistent with other DNS in the literature, do not support this assumption which may be, in part, responsible for LIA being unable to capture the observed behaviour beyond weak fluctuations. This change in mean properties has also relevance for practical applications where shock stabilization in a turbulent environment is critical such as flows in supersonic nozzles or in scramjet engines. It can also provide guidance in designing stationary STI experiments and simulations as an incorrect back pressure will lead to drifting shocks.
The theoretical results were further found to provide quantitative predictive capabilities. For example, we found that turbulence can weaken (as argued before) but also strengthen jumps depending on a critical Mach number
 $M_{cr}$
defined here which in turns depend on the intensity of turbulent fluctuations through
 $M_{t}$
. For
 $M<M_{cr}$
, jumps are stronger than in laminar flows at the same
 $M$
; for
 $M>M_{cr}$
jumps are weaker. Furthermore, density, pressure and temperature present different critical Mach numbers giving raise to conditions in which temperature jumps are larger than RH while density and pressure jumps are weaker than RH. These predictions have been verified with DNS data.
Thus we conclude that collectively the data support QE as a good approximation which leads to analytical results for density, pressure, temperature and entropy, consistent with the available data. In fact, it is interesting to observe how well it performs even with highly broken shocks where three-dimensional effects could play a role. We also note that QE is not expected to be accurate for variables at locations beyond
 $x_{2^{\prime }}$
where turbulent – as opposed to shock – processes dominate the dynamics. It is also unclear whether derivations under QE are applicable to, e.g. variances of thermodynamic quantities. This is part of ongoing efforts.
The effect of turbulence on the shock structure was quantified with the r.m.s.-to-mean dilatation at the shock,
 $\unicode[STIX]{x1D6E9}$
, suggested previously in the literature. Under QE,
 $\unicode[STIX]{x1D6E9}$
is found to depend, in the wrinkled regime, on the non-dimensional group
 $M_{t}/\unicode[STIX]{x0394}M$
where the theory agrees well with the present DNS as well as other DNS in the literature. Departures from the theory are seen for
 $M_{t}/\unicode[STIX]{x0394}M\gtrsim 0.6$
where stronger turbulent effects create increasingly large areas with holes. At high
 $M_{t}/\unicode[STIX]{x0394}M$
, an asymptotic value of
 $\unicode[STIX]{x1D6E9}$
is observed which depends on the Reynolds number. This was explained by the fact that at high turbulence intensities, dilatation fluctuations are dominated by turbulent effects. Thus, classical results on turbulence gradients were used to obtain
 $\unicode[STIX]{x1D6E9}$
which agrees with DNS data.
Finally, we presented results on turbulence amplification due to the shock. The focus was on
 $G$
, the amplification factor of the streamwise velocity component. A large collection of results, mainly from simulations, was presented. The new simulations presented here cover a wide range of parameters and extended the results in the literature to interactions at relatively high
 $K$
. The large amount of data collected exhibit large departures from LIA which are found to depend systematically on
 $M_{t}$
and
 $R_{\unicode[STIX]{x1D706}}$
. Consistent with Donzis (Reference Donzis2012a
) new data exhibit a collapse on a single curve when plotted against
 $K$
for high
 $K$
. However, as pointed out in Ryu & Livescu (Reference Ryu and Livescu2014) at low
 $K$
, the asymptotic behaviour depends on
 $M$
, consistent with LIA. This dependence on two parameters in two different limits resembles Widom scaling in critical phenomena. Here, its application leads to universality of the form
 $GK^{1/4}=f_{2}(K^{3/2}\unicode[STIX]{x0394}M)$
which collapses all the data with no systematic trend observed in any other governing parameter. This led to a transition criterion (
 $K_{tr}\approx 0.03/\unicode[STIX]{x0394}M^{2/3}$
) between low-
 $K$
and high-
 $K$
interactions which separates interactions where LIA applies and when
 $G\sim K^{-1/4}$
applies, respectively. The successful characterization of departures from LIA, provides an opportunity for generalizations of LIA and other theories, which can now use the correct scaling behaviour presented here as a constraint. Modifications would likely be required to generalize results here to more complex geometries such as shock–boundary layer interactions, but are of clear interest.
In summary, the canonical interaction of a normal shock with high-intensity turbulence was studied theoretically and numerically. A theory was proposed which captures turbulence effects on jumps across the shock as well as the structure of the shock surface. The theory also predicts new regimes of the interaction (e.g. vanished regime, attenuation or amplification of mean jumps) which are supported quantitatively by numerical data. Finally, new universal scaling laws were proposed for amplification factors which collapse all available data and establish flow conditions for which known theoretical limits should apply.
Acknowledgements
The authors gratefully acknowledge support from NSF (grant OCI-1054966) and AFOSR (grants FA9550-12-1-0443, FA9550-17-1-0107). This work used Extreme Science and Engineering Discovery Environment (XSEDE) resources. We thank R. Bowersox, C. Pantano and J. Larsson for helpful discussions on the topics of this paper.
Appendix A
In this appendix we provide the detailed derivations and complete expressions for final forms not provided in the main section of the paper.
The leading orders of truncated integrals of
 $m$
for a Gaussian distribution are given in table 3.
Low-order moments of
 $m$
for a Gaussian distribution
 $f_{m}(m)=1/M_{t}\sqrt{3/2\unicode[STIX]{x03C0}}\text{e}^{-(3m^{2}/2M_{t}^{2})}$
.

Similar to density (3.6), the expressions for pressure and temperature are given by:
 $$\begin{eqnarray}\displaystyle & p_{1}=\left[{\displaystyle \frac{\unicode[STIX]{x1D6FE}-1}{2}}(M+m)^{2}+1\right]^{-\unicode[STIX]{x1D6FE}/(\unicode[STIX]{x1D6FE}-1)}p_{01}, & \displaystyle\end{eqnarray}$$
 $$\begin{eqnarray}\displaystyle & T_{1}=\left[{\displaystyle \frac{\unicode[STIX]{x1D6FE}-1}{2}}(M+m)^{2}-1\right]^{-1}T_{01}. & \displaystyle\end{eqnarray}$$
Under QE, thermodynamic variables downstream of the shock will be given by RH expressions in supersonic regions:
 $$\begin{eqnarray}\displaystyle & p_{2^{\prime }}^{{>}}=\left[{\displaystyle \frac{2\unicode[STIX]{x1D6FE}}{\unicode[STIX]{x1D6FE}-1}}(M+m)^{2}-{\displaystyle \frac{\unicode[STIX]{x1D6FE}-1}{\unicode[STIX]{x1D6FE}+1}}\right]\!\!\left[{\displaystyle \frac{\unicode[STIX]{x1D6FE}-1}{2}}(M+m)^{2}\right]^{-\unicode[STIX]{x1D6FE}/(\unicode[STIX]{x1D6FE}-1)}p_{01}, & \displaystyle\end{eqnarray}$$
 $$\begin{eqnarray}\displaystyle & T_{2^{\prime }}^{{>}}\,=\left[{\displaystyle \frac{2\unicode[STIX]{x1D6FE}}{\unicode[STIX]{x1D6FE}+1}}((M+m)^{2}-1)+1\right]\!\!\!\left[{\displaystyle \frac{(\unicode[STIX]{x1D6FE}-1)(M+m)^{2}+2}{(\unicode[STIX]{x1D6FE}+1)(M+m)^{2}}}\right]\!\!\!\left[{\displaystyle \frac{\unicode[STIX]{x1D6FE}-1}{2}}(M+m)^{2}-1\right]^{-1}\!T_{01}, & \displaystyle \nonumber\\ \displaystyle & & \displaystyle\end{eqnarray}$$
 $p_{2^{\prime }}^{{<}}\approx p_{1}$
and
 $T_{2^{\prime }}^{{<}}\approx T_{1}$
.
These four expressions are now expanded around their respective mean as
 $$\begin{eqnarray}q=q|_{m=0}+\left(\frac{\unicode[STIX]{x2202}q}{\unicode[STIX]{x2202}m}\right)_{m=0}m+{\displaystyle \frac{1}{2}}\left(\frac{\unicode[STIX]{x2202}^{2}q}{\unicode[STIX]{x2202}m^{2}}\right)_{m=0}m^{2}+\cdots \,,\end{eqnarray}$$
where
 $q=p_{1}$
,
 $p_{2^{\prime }}^{{>}}$
,
 $T_{1}$
or
 $T_{2^{\prime }}^{{>}}$
.
For upstream quantities (
 $\langle p_{1}\rangle$
and
 $\langle T_{1}\rangle$
) the averages are computed using complete integrals against the p.d.f. of
 $m$
. For downstream quantities (
 $\langle p_{2^{\prime }}\rangle$
and
 $\langle T_{2^{\prime }}\rangle$
) one needs to split integrals as in (3.12) to distinguish subsonic from supersonic regions:
 $$\begin{eqnarray}\displaystyle & \langle p_{1}\rangle =\displaystyle \int _{-\infty }^{\infty }p_{1}\,f_{m}(m)\,\text{d}m, & \displaystyle\end{eqnarray}$$
 $$\begin{eqnarray}\displaystyle & \langle p_{2^{\prime }}\rangle =\displaystyle \int _{-\unicode[STIX]{x0394}M}^{\infty }p_{2^{\prime }}^{{>}}f_{m}(m)\,\text{d}m+\displaystyle \int _{-\infty }^{-\unicode[STIX]{x0394}M}p_{1}\,f_{m}(m)\,\text{d}m, & \displaystyle\end{eqnarray}$$
 $$\begin{eqnarray}\displaystyle & \langle T_{1}\rangle =\displaystyle \int _{-\infty }^{\infty }T_{1}\,f_{m}(m)\,\text{d}m, & \displaystyle\end{eqnarray}$$
 $$\begin{eqnarray}\displaystyle & \langle T_{2^{\prime }}\rangle =\displaystyle \int _{-\unicode[STIX]{x0394}M}^{\infty }T_{2^{\prime }}^{{>}}f_{m}(m)\,\text{d}m+\displaystyle \int _{-\infty }^{-\unicode[STIX]{x0394}M}T_{1}\,f_{m}(m)\,\text{d}m. & \displaystyle\end{eqnarray}$$
Upon integration aided by the forms in table 3, the final expressions of mean pressure and temperature are
 $$\begin{eqnarray}\langle p_{1}\rangle =\mathbb{M}^{-\unicode[STIX]{x1D6FE}/(\unicode[STIX]{x1D6FE}-1)}p_{01}+{\displaystyle \frac{\unicode[STIX]{x1D6FE}}{12}}\mathbb{M}^{(-3\unicode[STIX]{x1D6FE}+2)/(\unicode[STIX]{x1D6FE}-1)}[(3\unicode[STIX]{x1D6FE}-1)M^{2}-2]p_{01}M_{t}^{2},\end{eqnarray}$$
 $$\begin{eqnarray}\displaystyle \langle p_{2^{\prime }}\rangle & = & \displaystyle \left[{\displaystyle \frac{2\unicode[STIX]{x1D6FE}}{\unicode[STIX]{x1D6FE}+1}}M^{2}-{\displaystyle \frac{\unicode[STIX]{x1D6FE}-1}{\unicode[STIX]{x1D6FE}+1}}\right]\mathbb{M}^{-\unicode[STIX]{x1D6FE}/(\unicode[STIX]{x1D6FE}-1)}p_{01}\langle m^{0}\rangle ^{{>}}\nonumber\\ \displaystyle & & \displaystyle +\,{\displaystyle \frac{\unicode[STIX]{x1D6FE}M}{\unicode[STIX]{x1D6FE}+1}}(-2M^{2}+\unicode[STIX]{x1D6FE}+3)\mathbb{M}^{(-2\unicode[STIX]{x1D6FE}+1)/(\unicode[STIX]{x1D6FE}-1)}p_{01}\langle m\rangle ^{{>}}\nonumber\\ \displaystyle & & \displaystyle +\,{\displaystyle \frac{\unicode[STIX]{x1D6FE}}{4(\unicode[STIX]{x1D6FE}+1)}}\mathbb{M}^{(-3\unicode[STIX]{x1D6FE}+2)/(\unicode[STIX]{x1D6FE}-1)}\nonumber\\ \displaystyle & & \displaystyle \times \,[(2\unicode[STIX]{x1D6FE}+2)M^{4}-(3\unicode[STIX]{x1D6FE}^{2}+8\unicode[STIX]{x1D6FE}+9)M^{2}+(2\unicode[STIX]{x1D6FE}+6)]p_{01}\langle m^{2}\rangle ^{{>}}\nonumber\\ \displaystyle & & \displaystyle +\,\mathbb{M}^{-\unicode[STIX]{x1D6FE}/(\unicode[STIX]{x1D6FE}-1)}p_{01}\langle m^{0}\rangle ^{{<}}-\unicode[STIX]{x1D6FE}M\mathbb{M}^{(-2\unicode[STIX]{x1D6FE}+1)/(\unicode[STIX]{x1D6FE}-1)}p_{01}\langle m\rangle ^{{<}}\nonumber\\ \displaystyle & & \displaystyle +\,{\displaystyle \frac{\unicode[STIX]{x1D6FE}}{4}}\mathbb{M}^{(-3\unicode[STIX]{x1D6FE}+2)/(\unicode[STIX]{x1D6FE}-1)}[(3\unicode[STIX]{x1D6FE}-1)M^{2}-2]p_{01}\langle m^{2}\rangle ^{{<}},\end{eqnarray}$$
 $$\begin{eqnarray}\langle T_{1}\rangle =\mathbb{M}^{-1}T_{01}+{\displaystyle \frac{\unicode[STIX]{x1D6FE}-1}{12}}\mathbb{M}^{-3}[(3\unicode[STIX]{x1D6FE}-3)M^{2}-2]T_{01}M_{t}^{2},\end{eqnarray}$$
 $$\begin{eqnarray}\displaystyle \langle T_{2^{\prime }}\rangle & = & \displaystyle \left[{\displaystyle \frac{2\unicode[STIX]{x1D6FE}}{\unicode[STIX]{x1D6FE}+1}}(M^{2}-1)+1\right]\left[{\displaystyle \frac{(\unicode[STIX]{x1D6FE}-1)M^{2}+2}{(\unicode[STIX]{x1D6FE}+1)M^{2}}}\right]\mathbb{M}^{-1}T_{01}\langle m^{0}\rangle ^{{>}}\nonumber\\ \displaystyle & & \displaystyle +\,{\displaystyle \frac{4(\unicode[STIX]{x1D6FE}-1)}{(\unicode[STIX]{x1D6FE}+1)^{2}M^{3}}}T_{01}\langle m\rangle ^{{>}}-{\displaystyle \frac{6(\unicode[STIX]{x1D6FE}-1)}{(\unicode[STIX]{x1D6FE}+1)^{2}M^{4}}}T_{01}\langle m^{2}\rangle ^{{>}}\nonumber\\ \displaystyle & & \displaystyle +\,\mathbb{M}^{-1}T_{01}\langle m^{0}\rangle ^{{<}}-(\unicode[STIX]{x1D6FE}-1)M\mathbb{M}^{-2}T_{01}\langle m\rangle ^{{<}}\nonumber\\ \displaystyle & & \displaystyle +\,{\displaystyle \frac{\unicode[STIX]{x1D6FE}-1}{4}}\mathbb{M}^{-3}[3(\unicode[STIX]{x1D6FE}-1)M^{2}-2]T_{01}\langle m^{2}\rangle ^{{<}},\end{eqnarray}$$
where, as in the main text, we have defined
 $\mathbb{M}=(\unicode[STIX]{x1D6FE}-1)M^{2}/2+1$
for convenience. The ratio of the corresponding expressions yield the expressions denoted in (3.15) and (3.16).
A similar procedure is followed to obtain the entropy jump (3.19). In terms of supersonic and subsonic regions we write
 $$\begin{eqnarray}\langle \unicode[STIX]{x0394}s\rangle =C_{p}(\langle \ln T_{2^{\prime }}\rangle ^{{>}}-\langle \ln T_{1}\rangle ^{{>}})-R(\langle \ln p_{2^{\prime }}\rangle ^{{>}}-\langle \ln p_{1}\rangle ^{{>}})+\unicode[STIX]{x1D6FC}_{s}C_{p}(\unicode[STIX]{x1D6FE}-1)^{2}M_{t}^{4}\langle m^{0}\rangle ^{{<}},\end{eqnarray}$$
which requires the evaluation of
 $\langle \ln T_{1}\rangle$
(as in (3.21)),
 $\langle \ln T_{2^{\prime }}\rangle$
,
 $\langle \ln p_{1}\rangle$
and
 $\langle \ln p_{2^{\prime }}\rangle$
. Again using QE, the logarithm of pressure and temperature can be expanded in Taylor series and integrated in the appropriate probability space to obtain
 $$\begin{eqnarray}\displaystyle \langle \ln p_{1}\rangle ^{{>}} & = & \displaystyle \ln (\mathbb{M}^{-\unicode[STIX]{x1D6FE}/(\unicode[STIX]{x1D6FE}-1)})\langle m^{0}\rangle ^{{>}}-\frac{2\unicode[STIX]{x1D6FE}M}{(\unicode[STIX]{x1D6FE}-1)M^{2}+2}\langle m\rangle ^{{>}}\nonumber\\ \displaystyle & & \displaystyle +\,{\displaystyle \frac{\unicode[STIX]{x1D6FE}}{4}}[(\unicode[STIX]{x1D6FE}-1)M^{2}-2]\mathbb{M}^{-2}\langle m^{2}\rangle ^{{>}}+\ln p_{01}\langle m^{0}\rangle ^{{>}},\end{eqnarray}$$
 $$\begin{eqnarray}\displaystyle \langle \ln p_{2^{\prime }}\rangle ^{{>}} & = & \displaystyle \ln \left(\left[{\displaystyle \frac{2\unicode[STIX]{x1D6FE}}{\unicode[STIX]{x1D6FE}+1}}M^{2}-{\displaystyle \frac{\unicode[STIX]{x1D6FE}-1}{\unicode[STIX]{x1D6FE}+1}}\right]\mathbb{M}^{-\unicode[STIX]{x1D6FE}/(\unicode[STIX]{x1D6FE}-1)}\right)\langle m^{0}\rangle ^{{>}}\nonumber\\ \displaystyle & & \displaystyle +\,{\displaystyle \frac{\unicode[STIX]{x1D6FE}M(-2M^{2}+\unicode[STIX]{x1D6FE}+3)}{2\unicode[STIX]{x1D6FE}M^{2}-\unicode[STIX]{x1D6FE}+1}}\mathbb{M}^{-1}\langle m\rangle ^{{>}}\nonumber\\ \displaystyle & & \displaystyle +\,\unicode[STIX]{x1D6FE}\left[-\mathbb{M}^{-2}+{\displaystyle \frac{\mathbb{M}^{-1}}{2}}+{\displaystyle \frac{4-4\unicode[STIX]{x1D6FE}}{\left(-2\unicode[STIX]{x1D6FE}M^{2}+\unicode[STIX]{x1D6FE}-1\right)^{2}}}-{\displaystyle \frac{2}{\left(2\unicode[STIX]{x1D6FE}M^{2}-\unicode[STIX]{x1D6FE}+1\right)}}\right]\langle m^{2}\rangle ^{{>}}\nonumber\\ \displaystyle & & \displaystyle +\,\ln p_{01}\langle m^{0}\rangle ^{{>}},\end{eqnarray}$$
 $$\begin{eqnarray}\displaystyle \langle \ln T_{2^{\prime }}\rangle ^{{>}} & = & \displaystyle \ln \left(\left[{\displaystyle \frac{2\unicode[STIX]{x1D6FE}}{\unicode[STIX]{x1D6FE}+1}}(M^{2}-1)+1\right]\left[{\displaystyle \frac{(\unicode[STIX]{x1D6FE}-1)M^{2}+2}{(\unicode[STIX]{x1D6FE}+1)M^{2}}}\right]\mathbb{M}^{-1}\right)\langle m^{0}\rangle ^{{>}}\nonumber\\ \displaystyle & & \displaystyle +\,{\displaystyle \frac{2(\unicode[STIX]{x1D6FE}-1)}{2\unicode[STIX]{x1D6FE}M^{3}-\unicode[STIX]{x1D6FE}M+M}}\langle m\rangle ^{{>}}-{\displaystyle \frac{(\unicode[STIX]{x1D6FE}-1)[\unicode[STIX]{x1D6FE}(6M^{2}-1)+1]}{(2\unicode[STIX]{x1D6FE}M^{3}-\unicode[STIX]{x1D6FE}M+M)^{2}}}\langle m^{2}\rangle ^{{>}}\nonumber\\ \displaystyle & & \displaystyle +\,\ln T_{01}\langle m^{0}\rangle ^{{>}}.\end{eqnarray}$$
These expressions can be combined into (A 6) to obtain
 $g_{s}(M,M_{t})$
in (3.23).